by Scott Muniz | Aug 21, 2020 | Uncategorized
This article is contributed. See the original author and article here.
Until now, Update Staging Lab could detect regressions based solely on changes in the crash/hang behavior of your apps for upcoming security updates. This month’s update to the Update Staging Lab service includes changes to our algorithm to help you more clearly notice significant memory usage increases in the test VMs running your apps. Performance metrics, such as memory usage, can be indicative of overall application health and we believe this addition will greatly help keep your apps performing optimally.
Read on for more details or watch this video for a quick walk through of the latest improvements. For more information on Update Staging Lab’s ability to help with regression analysis, see Regression results based on process reliability.
Looking closer at memory regressions
The Update Staging Lab dashboard shows the memory consumed by your application on a new pre-released Windows update and compares it with the memory used by the last released Windows update. With this month’s enhancements, memory regression analysis is now featured in your favorited processes. Applications can contain multiple processes and you can manually select your favorite processes through the Reliability tab. Our service will then identify memory regressions in these favorited processes while comparing test runs across different Windows update releases. If a regression is detected, details about the regression are easily available.
Now let’s look at this feature in detail—and discuss how you can troubleshoot memory regressions using Windows Performance Analyzer.
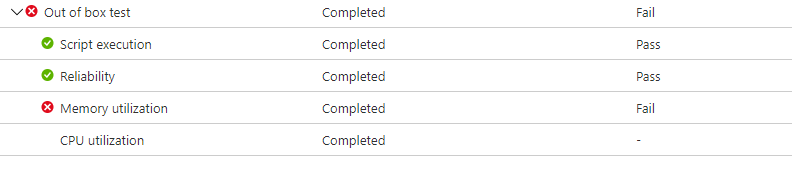
The failure signal caused by a memory regression is shown in the Update Staging Lab dashboard on the Test results page under Memory Utilization:
 Memory utilization displays Fail because of high memory consumption
Failure for the application due to higher memory consumption, will also be displayed as Fail on the Test Summary page:
 The Test Summary page displays failure because of memory regression
By providing these failure signals upfront, our goal is to clearly flag potential issues that can disrupt and impact the end user experience for your application. You can then download the log files and use the Windows Performance Analyzer, or your preferred toolkit, to investigate further. You can also work jointly with the Update Staging Lab team on remediating the issue and help prevent issues impacting end users.
Memory signals are captured in the Memory Utilization tab in the Update Staging Lab service for all test runs. The example below shows a recent test run with the onboarded application “Smoke Test Memory Stress” against the pre-release August 2020 security update. (This application was written by our team to illustrate memory regressions.)
 Memory regression comparison for all processes and favorited processes
In this example, the favorite process “USLTestMemoryStress.exe” process consumed an average of approximately 100 MB on the pre-release August update compared to the released July update, hence the Update Staging Lab identified a regression. The other processes—shown here as “USLTestMemoryStress_Aux1.exe” and “USLTestMemoryStress_Aux2.exe”—also belong to the same application, but consumed approximately the same amount of memory for the two releases so they “passed” and were considered healthy.
The regression on the main process was determined to be “statistically significant” so the service communicated and highlighted this difference to the user. If the comparison was not statistically significant, it would not be highlighted. Because memory utilization can be noisy, we use statistical models to distinguish, across builds and releases, meaningful differences from inconsequential differences. A comparison may be rarely be flagged when there is no true difference (a false positive), but this is a necessary tradeoff to improve the likelihood of correctly identifying regressions (or true positives.)
The next step is to understand what caused the memory regression. You can download the zip files for both executions from the Download log files option, as shown below. These zip files contain the results of your test run, including script results and memory and CPU performance data which is included in the ETL file.
 Where to locate test result log files for download
Download and unzip the logs for the two test runs, then locate the ETL file within each folder and rename them as target.etl (for the test run on the pre-release update) and baseline.etl (for the test run on last released update) to simplify exploration and navigation.
Troubleshooting memory regressions with Windows Performance Analyzer
If you don’t currently have it installed, you’ll need to install and launch Windows Performance Analyzer from the Microsoft Store. Then, open the baseline.etl trace (analyzed in blue tabs), then open the target.etl trace (analyzed in purple tabs), as shown below:
 Opening target.etl and baseline.etl in Windows Performance Analyzer
In the example above, both tabs were dragged into the “Virtual Memory Snapshots” view. We then applied a filter on processes containing “usl” to limit the analysis to the favorited processes, as shown below:
 Limiting the analysis to favorited processes
You can open multiple instances of this “Virtual Memory Snapshots” view and restrict the analysis to a single process via applying similar filters in Advanced Settings in Windows Performance Analyzer.
To compare multiple traces in a single graph, you’ll first need to open a comparative view for the two traces via Windows, then select New Comparative Analysis View:
 Creating a comparative view between baseline and target
If you aggregate the memory at the Process Name level instead of the Process level, you can see a difference in the Memory Working Set of approximately 100 MB for the first “USLTestMemoryStress.exe”, while the other processes have the same Memory Working Set:
 Comparing memory utilization at the process level
You can load other WPA Memory views like Total Commit or VirtualAlloc Commit Lifetime to understand more about the memory difference between the two test runs.
Learn more
Memory regressions for key processes can lead to issues for the end user, but they can now be caught and isolated easily with Update Staging Lab. We hope these new features will help you more easily identify and troubleshoot memory regressions in your applications and enable you to remediate as needed. We are working on additional UI and service-level improvements and are excited to share details on those soon.
In the example above, we illustrated some of the insights you can obtain by investigating the memory consumption patterns that Update Staging Lab presents after a test run. Obviously, every app is different, and you understand your app performance profile better than anyone, so we encourage you to follow the links below to learn more about the Windows Performance Analyzer and provide us with feedback.
Finally, if you aren’t already using Update Staging Lab to validate your applications, please join the private preview and try these latest features so we can continue to make improvements that matter to you. Also, we would love your feedback so feel free to leave comments below or email us at uslpreview@microsoft.com.
by Scott Muniz | Aug 21, 2020 | Uncategorized
This article is contributed. See the original author and article here.
Thanks for being part of this Data Architecture Blog and Community. In this post I want to discuss the importance of building a Data Community in your organization and how Azure Data Services can help nurture that Data Community and drive solution adoption and success.
How do you convince someone in an organization to be engaged in a Data Community and contribute to the many assets required to meet an organizations vision for Data and Analytics Solutions? I love the term Tom Sawyering. Not the deceitful part of getting someone to do my work (I believe in doing my own ironing, painting, data wrangling, upskilling, etc.), but the recognition that to be able to paint a fence at scale you need more than one painter. I know this firsthand, as I have been recruiting my wife to help paint our house this summer.
Wikipedia definition of Tom Sawyering someone https://en.wiktionary.org/wiki/Tom_Sawyer
“To convince someone to volunteer, especially to do something which one should do oneself.”
To compound this scaling issue, organizations have many projects and initiatives so there is more than one fence to paint. To get the job done you are going to need resources from outside your immediate team or department. So how do you attract people to author content for Data and Analytics Solutions? More importantly how do you foster contributors that don’t end up disillusioned and feeling like they have been Tom Sawyered. Azure Data Services can help with faster time to value, and the innovation and agility focus of these solutions is going to attract a Data Community. How do you upskill the Data Community? The Microsoft global skilling initiative can help with that. Members of the Data Community also need good business problems to solve to provide the necessary focus and opportunity to build proficiency and upskill to meet the challenge. In this time of Covid-19, necessity truly is the mother of invention so you need to be innovative in your approach in building your Data Community – upskill the organization with both students entering the workforce, and by reskilling the existing workforce.
To get started whether a green field initiative (not super common), or by more commonly extending, expanding, or modernizing an existing Data and Analytics Solution you need resources – people (labor), and infrastructure (buildings, electricity, tools, hardware, and software, or cloud platforms like Azure). To be successful with people resources for a solution you need to have customers/users who are both authors and consumers of data and content. To be successful with infrastructure resources you need technology, tools, hardware, and software that are flexible, agile, and elastic because of business volatility and changing demand. Azure can help achieve this economic benefit by providing elastic infrastructure and reducing sunk costs in building, power, and servers. Azure can also help achieve a financial benefit by improving cash flows and creating a variable vs fixed cost structure. In my opinion the most important is the agility benefit that comes with IT and Business Transformation and faster time to value. This innovation approach vs the cost savings provided by the economic and financial benefit is what brings the extended resources to the Data and Analytics Solution. This business opportunity and innovation is what attracts people to the solution, but the cost saving can also be opportunities to reinvested to help with resourcing more people for required roles for the solution.
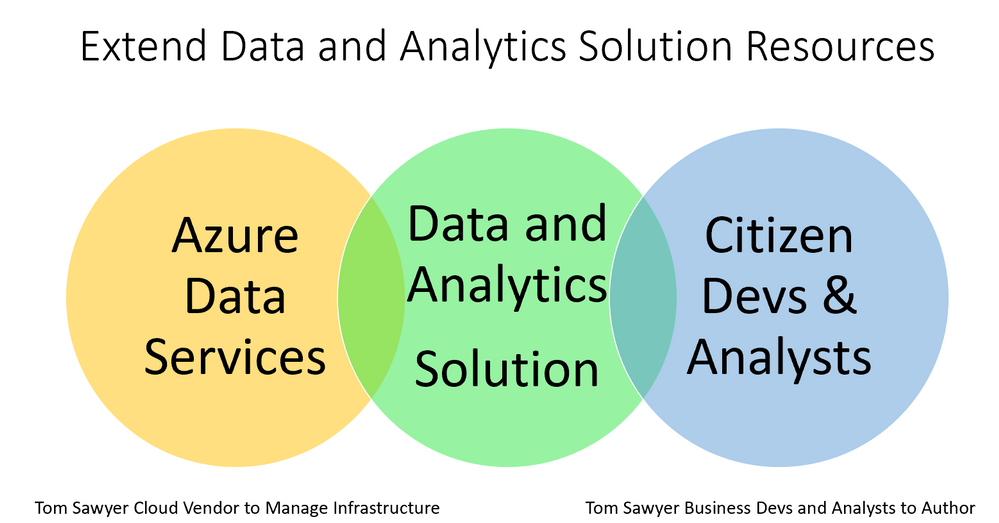
If you are moving an existing data solution from on premises to Azure this cost saving may be delayed as you pay to keep the production on premises solution going until you compete migration. So, for a time you pay to keep the as-is data solution running while you build the new to-be Data and Analytics Solution – kind of like a double mortgage. The size of and adoption by the Data Community is going to be a big part of the justification for continued investment in the solution so you best get them onboard early – early involvement also builds ongoing commitment and ownership. The following diagram depicts how Azure Data Services can extend an organizations infrastructure, and how the Data Community can extend the workforce required for creation, ongoing maintenance, and growth of Data and Analytics Solutions.

How does Azure make this possible? This diagram illustrates how the cloud vendor manages more of the infrastructure and how that can provide a faster time to value, standardization, and lower cost.

Demystifying Service Offerings from Microsoft Azure, Amazon AWS, and Google Cloud Platform
By Charlie Crocker
https://www.kdnuggets.com/2019/06/understanding-cloud-data-services.html
Instead of just lift and shifting on premise data solutions to IaaS, bridging more workloads to PaaS Data Services on Azure and SaaS BI Services like Power BI can also come with people resource savings and enable existing resources to focus on activities higher up the stack.

Demystifying Service Offerings from Microsoft Azure, Amazon AWS, and Google Cloud Platform
By Charlie Crocker
https://www.kdnuggets.com/2019/06/understanding-cloud-data-services.html
While Azure Data Services provide infrastructure benefits Power BI provides self-service capabilities that can help anyone in the organization be more engaged with data. Users can easily collaborate with others to Tom Sawyer some additional volunteers and build a data-driven culture and Data Community. Azure and Power BI also provide differentiated capabilities for users in the Data Community who have a diversity of needs. Examples by User Role:
Data Analyst – Power BI, Notebooks (Jupyter in Azure ML, Databricks, Synapse Analytics)
Data Scientist – Notebooks (Jupyter in Azure ML, Databricks, Synapse Analytics) and ML models deployed to the Kubernetes service AKS
Data Engineer – Azure Data Factory, Databrick Notebooks, Synapse Notebooks
DBA – Azure SQL Database, PostgreSQL, MySQL, Synapse as well as Database Management tools like SQL Server Management Studio (SSMS) and Azure Data Studio.
Developer/Software Engineers – Relational Databases like those mentioned for DBA role, NoSQL Databases like CosmosDB as well as Integrated Development Environments and Code Editors
Just like painters of trim, main walls, lower story, second story, and chimney (35 ft up) on a house are going to need tools like different sized paint brushes and ladders, paint, buckets. A Data Community needs different tools.
Data and Analytics Solutions require a Data Community and Azure Data Services to successfully solve business problems! Put hands on keyboard and do the work. Do the work and learn the Skills. Just like Mr. Miyagi in Karate Kid used Paint the Fence to upskill Daniel https://www.youtube.com/watch?v=R37pbIySnjg
Enjoy the rest of your summer!
Darwin
by Scott Muniz | Aug 21, 2020 | Uncategorized
This article is contributed. See the original author and article here.
News this week includes:
Microsoft 365 apps say farewell to Internet Explorer 11 and Windows 10 sunsets Microsoft Edge Legacy.
The Natural Language Queries feature introduced by Excel at Ignite last November is now generally available in Windows, Mac, and Excel for the web.
Microsoft announced it has transitioned Azure HDInsight to the Microsoft engineered distribution of Apache Hadoop and Spark, specifically built to drastically improve the performance, improved release cadence of powerful Open Source data analytics frameworks and optimized to natively run at cloud scale in Azure.
@harveer singh is our Member of the Week, and a great contributor in the Office 365 community.
View the Weekly Roundup for August 17-21 in Sway and attached PDF document.
by Scott Muniz | Aug 21, 2020 | Azure, Microsoft, Technology, Uncategorized
This article is contributed. See the original author and article here.
Final Update: Friday, 21 August 2020 17:48 UTC
We’ve confirmed that all systems are back to normal with no customer impact as of 8/21, 17:17 UTC. Our logs show the incident started on 8/21, 17:06 UTC and that during the 11 minutes that it took to resolve the issue a small number of customers in the South Central US region experienced data latency and data gaps, as well as possible alert misfires.
- Root Cause: The failure was due to an unexpected service interruption during a service update task.
- Incident Timeline: 11 minutes – 8/21, 17:06 UTC through 8/21, 17:17 UTC
We understand that customers rely on Application Insights as a critical service and apologize for any impact this incident caused.
-Jeff
Initial Update: Friday, 21 August 2020 17:39 UTC
We are aware of issues within Application Insights in South Central US region and are actively investigating. Some customers may experience Latency and Data Gaps.
- Work Around: None
- Next Update: Before 08/21 20:00 UTC
We are working hard to resolve this issue and apologize for any inconvenience.
-Jeff
by Scott Muniz | Aug 21, 2020 | Uncategorized
This article is contributed. See the original author and article here.
We announced the general availability of workload isolation for Azure Synapse Analytics which allows data engineers to configure and manage resources across their workloads to meet their business and performance objectives. This experience is not only available using familiar T-SQL syntax but we have also introduced the public preview of a graphical user interface in the Azure portal to provide a guided experience to the entire workload management process.
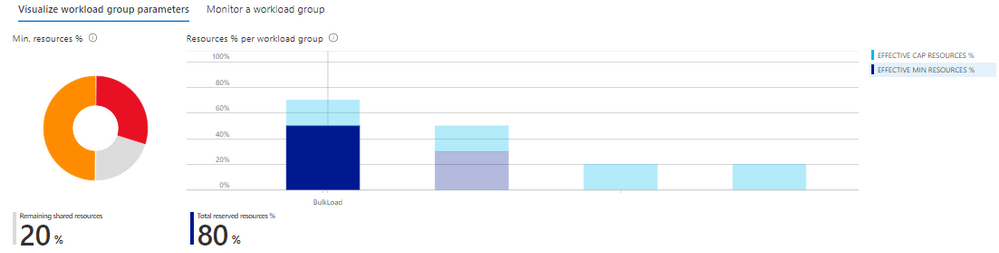
The Azure portal workload management experience comes with built-in commonly used views and charts which dynamically update allowing you to:
- Immediately identify how much shared resources are available that have not been allocated and reserved to a particular workload group across the entire SQL pool. You can also quickly understand the distribution of resources across your workload groups.

- Leverage built-in charts to monitor resource allocation, query timeouts, active and queued queries per workload group.

- Pinpoint changes in the Effective Values of your workload group based on your service level objective and shared resources.

Using these views and charts, you can balance resource demands of various workloads under concurrency and ensure your workload groups are not underutilized or overloaded. This can be done easily by creating, updating, or even deleting workload groups and classifiers both in T-SQL and directly in the portal:

The process of employing effective workload management practices has never been easier with the code-free experience in the Azure portal.
Try it out today! If you have feedback on the preview of this experience, reach out to the following distribution list: SynapseSQLStudioFeedback@service.microsoft.com.
For more information on workload management, see the following documentation:

by Scott Muniz | Aug 21, 2020 | Uncategorized
This article is contributed. See the original author and article here.

Microservices communication: Rabbitmq and Asp.net core
Damien Doumer is a software developer and Microsoft MVP in development technologies, who from Cameroon and currently based in France. He plays most often with ASP.Net Core and Xamarin, and builds mobile apps and back-ends. He often blogs, and he likes sharing content on his blog at https://doumer.me. Though he’s had to deal with other programming languages and several frameworks, he prefers developing in C# with the .Net framework. Damien’s credo is “Learn, Build, Share and Innovate”. Follow him on Twitter @Damien_Doumer.

ASP.NET MVC: Load Page with Data on Bootstrap Modal
Asma Khalid is an Entrepreneur, ISV, Product Manager, Full Stack .Net Expert, Community Speaker, Contributor, and Aspiring YouTuber. Asma counts more than 7 years of hands-on experience in Leading, Developing & Managing IT-related projects and products as an IT industry professional. Asma is the first woman from Pakistan to receive the MVP award three times, and the first to receive C-sharp corner online developer community MVP award four times. See her blog here.

Install and Configure Power BI Report Server Step by Step
Mohamed El-Qassas is a Microsoft MVP, SharePoint StackExchange (StackOverflow) Moderator, C# Corner MVP, Microsoft TechNet Wiki Judge, Blogger, and Senior Technical Consultant with +10 years of experience in SharePoint, Project Server, and BI. In SharePoint StackExchange, he has been elected as the 1st Moderator in the GCC, Middle East, and Africa, and ranked as the 2nd top contributor of all the time. Check out his blog here.

Microsoft Teams provisioning with Power Automate and Graph API
Vesku Nopanen is a Principal Consultant in Office 365 and Modern Work and passionate about Microsoft Teams. He helps and coaches customers to find benefits and value when adopting new tools, methods, ways or working and practices into daily work-life equation. He focuses especially on Microsoft Teams and how it can change organizations’ work. He lives in Turku, Finland. Follow him on Twitter: @Vesanopanen

SharePoint online Highlighted Content Web Part
John Naguib is an Office Servers and Services MVP. He’s also a Solution Architect and Senior Consultant, with a deep knowledge of SharePoint. In addition, he has a strong .net application development background and is knowledgable in Office 365, Azure and several Microsoft products. John is a recognized expert within the IT industry, as he’s published several gold award articles on Microsoft TechNet blogs and spoken at several events. He is based in Egypt. Follow him on Twitter @johnnaguib.

Recent Comments