This article is contributed. See the original author and article here.
Until now, Update Staging Lab could detect regressions based solely on changes in the crash/hang behavior of your apps for upcoming security updates. This month’s update to the Update Staging Lab service includes changes to our algorithm to help you more clearly notice significant memory usage increases in the test VMs running your apps. Performance metrics, such as memory usage, can be indicative of overall application health and we believe this addition will greatly help keep your apps performing optimally.
Read on for more details or watch this video for a quick walk through of the latest improvements. For more information on Update Staging Lab’s ability to help with regression analysis, see Regression results based on process reliability.
Looking closer at memory regressions
The Update Staging Lab dashboard shows the memory consumed by your application on a new pre-released Windows update and compares it with the memory used by the last released Windows update. With this month’s enhancements, memory regression analysis is now featured in your favorited processes. Applications can contain multiple processes and you can manually select your favorite processes through the Reliability tab. Our service will then identify memory regressions in these favorited processes while comparing test runs across different Windows update releases. If a regression is detected, details about the regression are easily available.
Now let’s look at this feature in detail—and discuss how you can troubleshoot memory regressions using Windows Performance Analyzer.
The failure signal caused by a memory regression is shown in the Update Staging Lab dashboard on the Test results page under Memory Utilization:

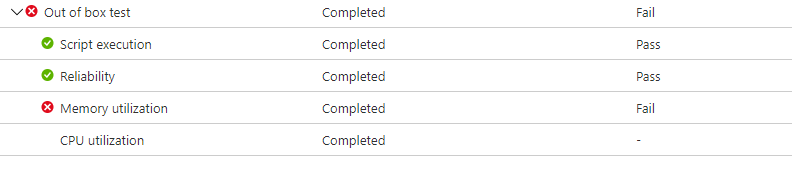
Failure for the application due to higher memory consumption, will also be displayed as Fail on the Test Summary page:

By providing these failure signals upfront, our goal is to clearly flag potential issues that can disrupt and impact the end user experience for your application. You can then download the log files and use the Windows Performance Analyzer, or your preferred toolkit, to investigate further. You can also work jointly with the Update Staging Lab team on remediating the issue and help prevent issues impacting end users.
Memory signals are captured in the Memory Utilization tab in the Update Staging Lab service for all test runs. The example below shows a recent test run with the onboarded application “Smoke Test Memory Stress” against the pre-release August 2020 security update. (This application was written by our team to illustrate memory regressions.)

In this example, the favorite process “USLTestMemoryStress.exe” process consumed an average of approximately 100 MB on the pre-release August update compared to the released July update, hence the Update Staging Lab identified a regression. The other processes—shown here as “USLTestMemoryStress_Aux1.exe” and “USLTestMemoryStress_Aux2.exe”—also belong to the same application, but consumed approximately the same amount of memory for the two releases so they “passed” and were considered healthy.
The regression on the main process was determined to be “statistically significant” so the service communicated and highlighted this difference to the user. If the comparison was not statistically significant, it would not be highlighted. Because memory utilization can be noisy, we use statistical models to distinguish, across builds and releases, meaningful differences from inconsequential differences. A comparison may be rarely be flagged when there is no true difference (a false positive), but this is a necessary tradeoff to improve the likelihood of correctly identifying regressions (or true positives.)
The next step is to understand what caused the memory regression. You can download the zip files for both executions from the Download log files option, as shown below. These zip files contain the results of your test run, including script results and memory and CPU performance data which is included in the ETL file.

Download and unzip the logs for the two test runs, then locate the ETL file within each folder and rename them as target.etl (for the test run on the pre-release update) and baseline.etl (for the test run on last released update) to simplify exploration and navigation.
Troubleshooting memory regressions with Windows Performance Analyzer
If you don’t currently have it installed, you’ll need to install and launch Windows Performance Analyzer from the Microsoft Store. Then, open the baseline.etl trace (analyzed in blue tabs), then open the target.etl trace (analyzed in purple tabs), as shown below:

In the example above, both tabs were dragged into the “Virtual Memory Snapshots” view. We then applied a filter on processes containing “usl” to limit the analysis to the favorited processes, as shown below:

You can open multiple instances of this “Virtual Memory Snapshots” view and restrict the analysis to a single process via applying similar filters in Advanced Settings in Windows Performance Analyzer.
To compare multiple traces in a single graph, you’ll first need to open a comparative view for the two traces via Windows, then select New Comparative Analysis View:

If you aggregate the memory at the Process Name level instead of the Process level, you can see a difference in the Memory Working Set of approximately 100 MB for the first “USLTestMemoryStress.exe”, while the other processes have the same Memory Working Set:

You can load other WPA Memory views like Total Commit or VirtualAlloc Commit Lifetime to understand more about the memory difference between the two test runs.
Learn more
Memory regressions for key processes can lead to issues for the end user, but they can now be caught and isolated easily with Update Staging Lab. We hope these new features will help you more easily identify and troubleshoot memory regressions in your applications and enable you to remediate as needed. We are working on additional UI and service-level improvements and are excited to share details on those soon.
In the example above, we illustrated some of the insights you can obtain by investigating the memory consumption patterns that Update Staging Lab presents after a test run. Obviously, every app is different, and you understand your app performance profile better than anyone, so we encourage you to follow the links below to learn more about the Windows Performance Analyzer and provide us with feedback.
- Windows Performance Analyzer
- Analyzing website performance with the Windows Performance Toolkit
- Windows Performance Step-by-Step Guides
Finally, if you aren’t already using Update Staging Lab to validate your applications, please join the private preview and try these latest features so we can continue to make improvements that matter to you. Also, we would love your feedback so feel free to leave comments below or email us at uslpreview@microsoft.com.
Brought to you by Dr. Ware, Microsoft Office 365 Silver Partner, Charleston SC.

Recent Comments