by Scott Muniz | Jul 21, 2020 | Uncategorized
This article is contributed. See the original author and article here.
Follow me on Twitter, happy to take your suggestions on topics or improvements /Chris
Durable Functions are an extension of Azure Functions that lets you write stateful functions in a serverless environment. Durable functions manages state, checkpoints, and restarts for you.
What does that even mean you ask?
It means you can have long-running functions like really long-running functions. It also has a state which means it remembers where it is, like a workflow.
How about this. Imagine you have a situation where :
> you need to manage something by dividing it up in different checkpoints. Each checkpoint is one step closer for it to be considered handled. More concretely imagine a game for example where you need to load a bunch of different resources and only when everything is loaded and ready are you able to play the game.
Oh, ok, so it’s like a workflow framework
Yea exactly, it enables you to specify how something should be executed through a flow. There are even different architectural patterns that is recommended for different flows.
Sounds like that could be expensive, is it?
No not really, the payment model is very close to the one Azure Functions use, only pay for when the functions/ workflow is actually executing.
Sounds great, tell me more
In this article we will cover:
- What are Durable functions, let’s talk through what it is and what the central concepts are
- How it works, we will explain a little bit of how it works
- Resources, we will give out some resources so you can delve further in
- Lab, we will code through an example so you see the major concepts in use and what happens when
Concepts and high-level explanation
There are some concepts we need to know about when dealing with durable functions. All concepts play a role that together enables us to run our durable function.
- Orchestrator function, this is a function where we define the workflow, we set up what should happen in the workflow, what activities to carry out and what happens when it’s done
- Activity function, Activity functions are the basic unit of work in a durable function orchestration. Activity functions are the functions and tasks that are orchestrated in the process. You can have as many activity functions as you want. Make sure to give them descriptive names that represent steps in your flow
- Client functions, Client functions are the triggered functions that create new instances of an orchestration. Client functions are the entry point for creating an instance of a Durable Functions orchestration
Ok, I think I got but can you maybe explain it a bit more?
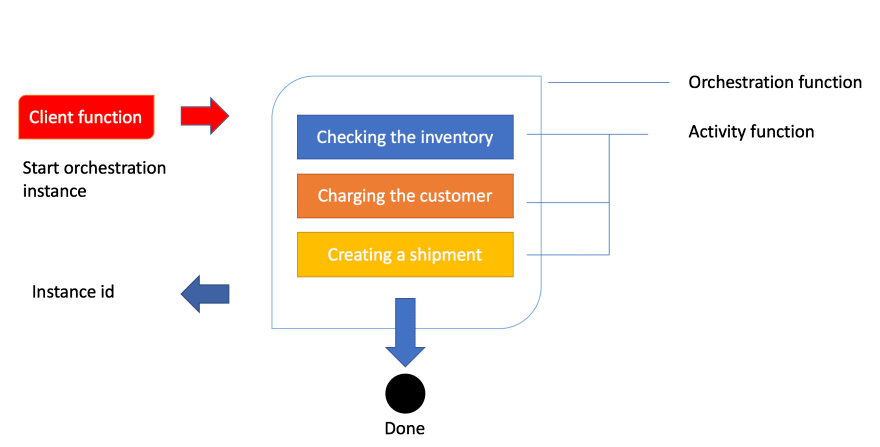
Sure, the best way to explain it is through a realistic example and an image. So let’s talk about order processing. In order processing we imagine we have the following tasks to carry out:
- Checking the inventory,
- Charging the customer,
- Creating a shipment
Given that we know how an order is processed let’s show you that image so you get a feeling for the workflow:

Ok, above we see how a client function is being invoked. In the case of an order being created, this typically is an HTTP endpoint we hit from an application. The next thing to happen is that the client’s function starts an instance of an orchestration. This means we will get an instance id, our unique reference to that specific flow. Next thing to happen is that we try to carry out everything inside of the orchestration like checking the inventory, charging the customer and creating a shipment.
How it works
Let’s talk a bit more about how this technically works. The thing with the orchestration is that what it orchestrates usually is asynchronous which means we don’t know exactly when something finishes. To avoid that you pay running costs for it durable functions powers down and saves the state.
When an orchestration function is given more work to do (for example, a response message is received or a durable timer expires), the orchestrator wakes up and re-executes the entire function from the start to rebuild the local state.
wait, re-running everything?
No worries, during the replay, if the code tries to call a function (or do any other async work), the Durable Task Framework consults the execution history of the current orchestration. If it finds that the activity function has already executed and yielded a result, it replays that function’s result and the orchestrator code continues to run.
Oh ok, that sounds better
Replay continues until the function code is finished or until it has scheduled new async work
Resources
Lab – simple activity flow
We believe the best way to learn is to build something with it. So how do we do it? Well, it’s quite simple. Using VS Code we can install a plugin making this process really easy.

Creating our project
Open up the command palette or type COMMAND + SHIFT + P.
Then we select the following, to create a new project

This is followed by us selecting a language, let’s take C#. Then we are faced with this list of choices
Select Durable Functions Orchestration , next name your function:

You will be asked to select a storage account, you will need to select Subscription, Storage account and Resource group. The reason for this is that when you save the state of your function it needs to be saved somewhere for later recovery.
Your project should now look like this:
-| obj/
-| bin/
-| .gitignore
-| <name of directory>.csproj
-| local.settings.json
-| Orchestration.cs
Let’s take a closer look at Orchestration.cs:
using System.Collections.Generic;
using System.Net.Http;
using System.Threading.Tasks;
using Microsoft.Azure.WebJobs;
using Microsoft.Azure.WebJobs.Extensions.DurableTask;
using Microsoft.Azure.WebJobs.Extensions.Http;
using Microsoft.Extensions.Logging;

namespace Company.Function
{
    public static class Orchestration
    {
        [FunctionName("Orchestration")]
        public static async Task<List<string>> RunOrchestrator(
            [OrchestrationTrigger] IDurableOrchestrationContext context)
        {
            var outputs = new List<string>();

            // Replace "hello" with the name of your Durable Activity Function.
            outputs.Add(await context.CallActivityAsync<string>("Orchestration_Hello", "Tokyo"));
            outputs.Add(await context.CallActivityAsync<string>("Orchestration_Hello", "Seattle"));
            outputs.Add(await context.CallActivityAsync<string>("Orchestration_Hello", "London"));

            // returns ["Hello Tokyo!", "Hello Seattle!", "Hello London!"]
            return outputs;
        }

        [FunctionName("Orchestration_Hello")]
        public static string SayHello([ActivityTrigger] string name, ILogger log)
        {
            log.LogInformation($"Saying hello to {name}.");
            return $"Hello {name}!";
        }

        [FunctionName("Orchestration_HttpStart")]
        public static async Task<HttpResponseMessage> HttpStart(
            [HttpTrigger(AuthorizationLevel.Anonymous, "get", "post")] HttpRequestMessage req,
            [DurableClient] IDurableOrchestrationClient starter,
            ILogger log)
        {
            // Function input comes from the request content.
            string instanceId = await starter.StartNewAsync("Orchestration", null);

            log.LogInformation($"Started orchestration with ID = '{instanceId}'.");

            return starter.CreateCheckStatusResponse(req, instanceId);
        }
    }
}
Above you can see how three functions have been generated for you when you created the project. Every function has been decorated with FunctionName decorator. This is how the runtime knows what these functions are and can generate endpoints from it, among other things.
Explaining the artifacts
Ok, so we created three different functions or artifacts, an orchestrator function, an HTTP start/client function, and an activity function. How does this all work?
Well, it all starts with a HttpStart function that kicks everything off. Then said function kicks off the Orchestrator that in turn starts the Activity functions specified in the orchestrator. Sounds a bit theoretical but let’s dive into each of these artifacts and see what happens in the code.
HttpStart
As mentioned above, this is the function that starts it all. Let’s have a look at its source code and discuss what’s happening:
[FunctionName("Orchestration_HttpStart")]
public static async Task<HttpResponseMessage> HttpStart(
  [HttpTrigger(AuthorizationLevel.Anonymous, "get", "post")] HttpRequestMessage req,
  [DurableClient] IDurableOrchestrationClient starter,
   ILogger log)
{
  // Function input comes from the request content.
  string instanceId = await starter.StartNewAsync("Orchestration", null);

  log.LogInformation($"Started orchestration with ID = '{instanceId}'.");
  return starter.CreateCheckStatusResponse(req, instanceId);
}
We can see above that we have three input parameters:
- req, of type IHttpRequestMessage, this is the incoming web request. Note how this parameter has the
HttpTrigger decorator with two input params, AuthorizationLevel, and the strings “get” and “post”. This instructs this method to listen to WebRequests using the HTTP verbs GET and POST.
- starter, of type IIDurableOrchestrationClient, this is the client that allows us to control the general flow.
- log, of type ILogger, this instance lets us log different messages that can be subscribed to by Azure and will also be visible in the terminal while developing our project.
Next up our starter instance calls StartNewAsync() which produce an instanceId. The instanceId is a reference or handler to this specific function invocation. It doesn’t matter so much for this demo but the for the second one we will use that information.
The last thing to happen is that we create an HTTP response by calling CreateCheckStatusResponse() .
Orchestrator
Let’s look at the Orchestrator next. This is where all the interesting things are happening, this is where we set up our flow, what function to be called when and why. Let’s look at the code:
[FunctionName("Orchestration")]
public static async Task<List<string>> RunOrchestrator(
  [OrchestrationTrigger] IDurableOrchestrationContext context)
{
  var outputs = new List<string>();

  // Replace "hello" with the name of your Durable Activity Function.
  outputs.Add(await context.CallActivityAsync<string>("Orchestration_Hello", "Tokyo"));
  outputs.Add(await context.CallActivityAsync<string>("Orchestration_Hello", "Seattle"));
  outputs.Add(await context.CallActivityAsync<string>("Orchestration_Hello", "London"));

  // returns ["Hello Tokyo!", "Hello Seattle!", "Hello London!"]
  return outputs;
}
The first thing we see that we have a method FunctionName("Orchestration") . We have an input parameter context of type IDurableOrchestrationContext. This parameter has the capability of controlling the flow but also call helpers but also activity functions, that does the heavy lifting. When contextcalls CallActivitySync()it does just that, it calls an activity function with the name Orchestration_Helloand pass it a string.
Orchestration_Hello
Next up we have an activity function. This is where we carry out all the heavy lifting.
[FunctionName("Orchestration_Hello")]
public static string SayHello([ActivityTrigger] string name, ILogger log)
{
  log.LogInformation($"Saying hello to {name}.");
  return $"Hello {name}!";
}
We see that it returns straight away but it could definitely be a long-running activity. The point is whether it runs in a millisecond or takes some time, it doesn’t matter, the orchestration function still has to wait for it to conclude. Imagine this function can do a lot more, like talking to a database or do an HTTP request.
Debugging
You may think you understand everything up to this point but it really clicks when you see a debugging flow happening. So that’s what we are going to be doing next, we are going to start up our durable function from VS Code and you will be able to see how the breakpoints hit and when.
Now we are ready to debug so let’s hit debug by going to Run/ Start Debugging in the VS Code menu.
We should be getting something like this printed in the terminal
Http Functions:
  Orchestration_HttpStart: [GET,POST] http://localhost:7071/api/Orchestration_HttpStart
Next thing we need to do is to kick everything off by hitting our client function route as indicated above http://localhost:7071/api/Orchestration_HttpStart. We need to start the whole thing by calling the mentioned URL
1) The first thing to happen is our HttpStart function being hit:
We let the debugger advance:
2) Next, the Orchestration is being hit.
Next up we advance to the next breakpoint and we see that our activity
3) Next, the function Orchestration_Hello is being hit next.
We advanced the breakpoint and we find ourselves being back in the orchestration function:
This will lead to the activity function being hit again, this time with the argument Seattleand so on.
As you can see it will keep going like this between activity function and orchestrator until orchestrator is done.
We end up coming to a page like this which is the HTTP response from the method called HttpStart
// 20200721125052
// http://localhost:7071/api/Orchestration_HttpStart

{
  "id": "151c37c2bbc14f659ffb0a4d3ed9e54e",
  "statusQueryGetUri": "http://localhost:7071/runtime/webhooks/durabletask/instances/151c37c2bbc14f659ffb0a4d3ed9e54e?taskHub=TestHubName&connection=Storage&code=/XsKEv/uaBc41kmo1ayzMMhI7mh5fNazn4azktrpMbJtuEnSnpm1lA==",
  "sendEventPostUri": "http://localhost:7071/runtime/webhooks/durabletask/instances/151c37c2bbc14f659ffb0a4d3ed9e54e/raiseEvent/{eventName}?taskHub=TestHubName&connection=Storage&code=/XsKEv/uaBc41kmo1ayzMMhI7mh5fNazn4azktrpMbJtuEnSnpm1lA==",
  "terminatePostUri": "http://localhost:7071/runtime/webhooks/durabletask/instances/151c37c2bbc14f659ffb0a4d3ed9e54e/terminate?reason={text}&taskHub=TestHubName&connection=Storage&code=/XsKEv/uaBc41kmo1ayzMMhI7mh5fNazn4azktrpMbJtuEnSnpm1lA==",
  "purgeHistoryDeleteUri": "http://localhost:7071/runtime/webhooks/durabletask/instances/151c37c2bbc14f659ffb0a4d3ed9e54e?taskHub=TestHubName&connection=Storage&code=/XsKEv/uaBc41kmo1ayzMMhI7mh5fNazn4azktrpMbJtuEnSnpm1lA=="
}
What’s interesting for us to know at this point is what did we end up producing? The answer lies in the URL called statusQueryGetUri. Let’s follow that link:
// 20200721122529
// http://localhost:7071/runtime/webhooks/durabletask/instances/e1d7e237acb74834a02854050805712e?taskHub=TestHubName&connection=Storage&code=/XsKEv/uaBc41kmo1ayzMMhI7mh5fNazn4azktrpMbJtuEnSnpm1lA==

{
  "name": "Orchestration",
  "instanceId": "e1d7e237acb74834a02854050805712e",
  "runtimeStatus": "Completed",
  "input": null,
  "customStatus": null,
  "output": [
    "Hello Tokyo!",
    "Hello Seattle!",
    "Hello London!"
  ],
  "createdTime": "2020-07-21T11:18:28Z",
  "lastUpdatedTime": "2020-07-21T11:24:25Z"
}
As you can see above the response from our Orchestration function is an array consisting of the responses from all activity functions, like so:
"output": [
  "Hello Tokyo!",
  "Hello Seattle!",
  "Hello London"
]
It ended up that way because of the way we constructed the code, we wrote this:
outputs.Add(await context.CallActivityAsync<string>("Orchestration_Hello", "Tokyo"));
outputs.Add(await context.CallActivityAsync<string>("Orchestration_Hello", "Seattle"));
outputs.Add(await context.CallActivityAsync<string>("Orchestration_Hello", "London"));
Summary
There is so much more to learn about Durable Functions but I can already hear some of you snore at this point which is why we will save topics such as Application Patterns and implementation of a pattern Fan-out/fan-in for the next part.
So I hope you are excited about that one.
Acknowledgements
I wouldn’t be writing this if it wasn’t for your guidance in how Durable Functions work. You both are amazing human beings.
So go give them a follow, they really know their stuff on Serverless
by Scott Muniz | Jul 20, 2020 | Uncategorized
This article is contributed. See the original author and article here.
We here in the ADX Product Management team would love to hear from you.
Your feedback is crucial for us to be able to create the best ADX user experience.
Please take the time to answer our quick survey about your tab navigation experience in the ADX Web Explorer.
It takes only 3 minutes to make a difference.
Take the survey
Help shape the future of ADX Web Explorer, go to ADX User Voice to ask and upvote feature requests
by Scott Muniz | Jul 20, 2020 | Alerts, Microsoft, Technology, Uncategorized
This article is contributed. See the original author and article here.
Recently I came across a scenario where someone had changed the time on a scheduled Azure virtual machine shut down, but the VM was not adhering to the shut down new time.. Learn how asking the wrong question can cause you to miss the answer!
Background – the change
The systems administrator had an Azure Automation Runbook in place that told the Azure Windows Server virtual machine to shut down at 10pm each night. After changing the script to 11pm, the admin noticed that the server was still shutting down at 10pm.

So they started to investigate the wrong question …
“Why isn’t the VM acknowledging the changed time in the updated schedule?”
The importance of broader questions
With this question, we’re assuming part of the cause – that the VM is controlled by the Azure Automation Runbook but somehow doesn’t realize there has been an updated change to the schedule. We could wrack our brains & comb through logs for days, without answering this question. Why? Because it’s the wrong question to ask.
A better question
Instead, let’s rephrase the problem a little broader.
“WHY is the VM shutting down at 10pm?”
Notice I didn’t say “why is the VM still shutting down at 10pm”. I want to set aside for a moment any past behavior versus expected new behavior and instead go exploring some of the reasons why a virtual machine would shut down.
Shut down causes/triggers
Let’s brainstorm a few “usual suspects” that might shut down a VM:
1. Azure Automation – yes, that’s what we were first looking at. Has it saved correctly? Are there any other runbooks executing first?
2. Windows Update – settings on the server itself, Azure Update Management, or even a third party management tool (though in none of those scenarios would I expect it to happen every day, but I have seen stranger things!).
3. Azure Dev/Test Labs – These pre-configured Azure Resource Manager templates let you specify auto shutdown (and auto start) times and policies for your Azure VMs.
4. Something else controlling that server – think of a local script, application or third party management tool. Could the cause of the shut down be inside the VM itself and not related to Azure?
See if you can identify something I’ve left off this list, on purpose!
Analyzing the shut down event
Now I have a few ideas outside the scope of just that one script, it’s time to go and look at the facts.
Starting with the Windows Server event log, it tells me that a shut down event was initiated at 2200hrs. Yeah, no kidding. But it’s not very good at tell me what initiated it. This gives me a clue that it may be a factor outside of the server OS.
Next, I’ll check the VM’s Activity log in the Azure portal. This logs subscription-level events, including those triggered by Azure Policy. Now we can see that “Azure Lab Services” initiates our shut down events at 10:00pm daily – as well as our . That is not our Azure Automation Runbook.

This server is not part of an Azure Dev/Test Lab though, so what have we missed?
Auto-shutdown support for Azure VMs
One place we didn’t look was the Operations section of the Azure VM, in the Azure Portal. Nestled in with Azure Bastion connection, Backup, Policies etc. (relevant to this machine), is the Auto-shutdown section!
And here we’ve found the cause of our shutdowns.

The properties of the Virtual Machine had been configured to shut down the VM daily at 10pm.
Summary
If you’ve ever scratched your head over a problem, only to have someone else quickly find the cause … welcome to the human race! Sometimes our troubleshooting questions lead us in a defined direction, missing the clues that we actually need. So the next time you’re faced with a problem, step back and look at what questions you are asking to try and solve it, and what assumptions they may contain.
Learn more with our Introduction to Azure Virtual Machines, on Microsoft Learn.
by Scott Muniz | Jul 20, 2020 | Alerts, Microsoft, Technology, Uncategorized
This article is contributed. See the original author and article here.
ProxySQL have rich internal functioning metrics which could be accessed from its stats database through the Admin interface, and the stored metrics are the snapshot of a particular point of time when you select the metric table. When troubleshooting the problem, we need to review and accumulate the historical metrics data with powerful query functions like Azure Monitor Kusto Queries to help understand the overall status. In this blog, we will introduce how to post the metrics to Azure Monitor Log Analytics Workspace and leverage the powerful Kusto query language to monitor the ProxySQL statistics metrics.
Access the ProxySQL Metrics for Monitoring:
1. Connect the ProxySQL Admin interface through any client using MySQL protocol with the admin credential like below:
mysql -u admin -padmin -h 127.0.0.1 -P6032
2. Access the statistics metrics by select query like below example:
select Client_Connections_aborted from stats.stats_mysql_global
3. Please refer the metrics detail in https://proxysql.com/documentation/stats-statistics/, there are 18 stats tables storing important monitoring data viz the front end and backend connections, query digest, GTID, prepared statements and etc.
Note: ProxySQL is an open source community tool. It is supported by Microsoft on a best effort basis. In order to get production support with authoritative guidance, you can evaluate and reach out to ProxySQL Product support.
Ingest the Metrics to external monitoring tool – Azure Monitor:
1. Assume you have installed ProxySQL on a Linux VM already, as the Admin interface is only allowed to access locally, we need to run the ingestion code side by side on the same VM. The ingestion sample code will query the ProxySQL stats metrics then post the data to the Logical Workspace in a regular 1-minute interval.
2. Provision a Log Analytics Workspace to store the posted metrics. The Ingestion sample code performs POST Azure Monitor custom log through HTTP REST API: https://docs.microsoft.com/en-us/azure/azure-monitor/platform/data-collector-api
3. The ingestion sample code is developed with .NET Core 3.1, and you could check out from the GitHub repo https://github.com/Azure/azure-mysql/tree/master/ProxySQLMetricsIngest.
Detail usage instructions about the sample ingesting code:
1. Install .NET Core on the Linux VM where ProxySQL is located.
Refer to https://docs.microsoft.com/dotnet/core/install/linux-package-manager-ubuntu-1804
wget -q https://packages.microsoft.com/config/ubuntu/18.04/packages-microsoft-prod.deb -O packages-microsoft-prod.deb
sudo dpkg -i packages-microsoft-prod.deb
sudo add-apt-repository universe
sudo apt-get update
sudo apt-get install apt-transport-https
sudo apt-get update
sudo apt-get install dotnet-sdk-3.1
2. Get the Custom ID and Shared Key of the Log Analytics Workspace
1) In the Azure portal, locate your Log Analytics workspace.
2) Select Advanced Settings and then Connected Sources.
3) To the right of Workspace ID, select the copy icon, and then paste the ID as the value of the Customer ID input for the sample application input.
4) To the right of Primary Key, select the copy icon, and then paste the ID as the value of the Shared Key input for the sample application input.
3. Checkout the sample code and run:
git clone https://github.com/Azure/azure-mysql
cd ProxySQLMetricsIngest/
dotnet build
sudo dotnet run
Here are some details about the sample:
1) It is a console application which will ask for the input of the connection string for ProxySQL Admin Interface, (Log Workspace) custom ID and Shared key.
2) The sample currently register a 1-minute timer to periodically access the ProxySQL stats tables through MySQL protocol and post data into the Log Analytics Workspace
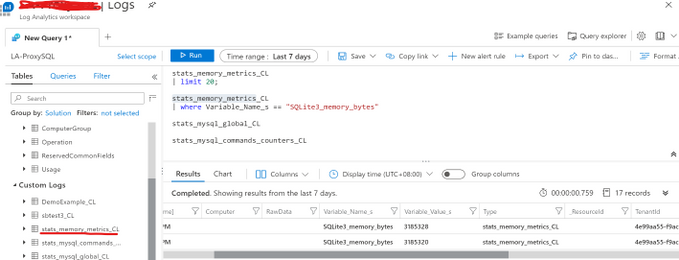
3) Each ProxySQL stats table name would be used as the Custom Log Type Name, and the Log Analytics will automatically add _CL suffix to generate the complete Custom Log Type Name. For example, the stats table stats_memory_metrics will become stats_memroy_metrics_CL in the Custom Logs list. Below is the example screenshot within the Log Analytics Workspace.

4) The sample code also post the error logs in /var/lib/proxysql/proxysql.log to the Log Analytics Workspace as Custom Log Type: PSLogs_CL, to get the file read permission, please execute “sudo dotnet run”.
4. Use Kusto query in Log Analytics Workspace to operate the ProxySQL metrics data.
Please be noticed that all the ProxySQL stats table values are set to string, so need convert it to number in Kusto query. Below is the example to render a time chart of the memory usage about ProxySQL internal module SQLLite.

Disclaimer: This sample code is available AS IS with no warranties and support from Microsoft. Please raise an issue in Github if you encounter any issues and I will try our best to address it.
If you have trouble setting up ProxySQL on Azure Database for MySQL, please contact the Azure Database for MySQL team at AskAzureDBforMySQL@service.microsoft.com
by Scott Muniz | Jul 20, 2020 | Alerts, Microsoft, Technology, Uncategorized
This article is contributed. See the original author and article here.
Dear SSIS Users,
Azure Feature Pack 1.19.0 is here with an updated Azure Storage connection manager. Now you can configure Azure Storage connection manager to authenticate with shared access signature, and use it in Flexible File Task/Source/Destination.
This new version of Azure Feature Pack is pre-installed on Azure-SSIS integration runtime. To install elsewhere, you can download installation packages from the following links:
by Scott Muniz | Jul 20, 2020 | Uncategorized
This article is contributed. See the original author and article here.
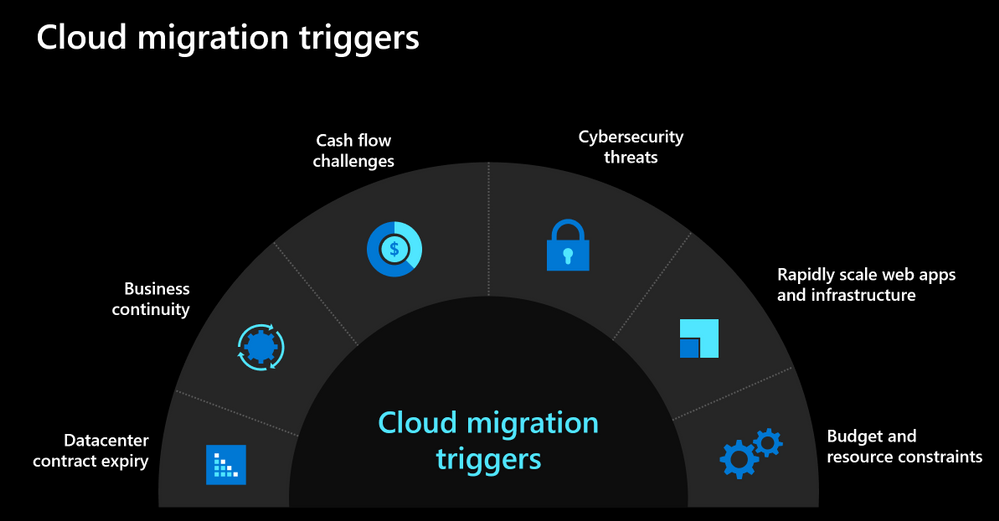
As we navigate the challenges posed by the current environment, many organizations are looking to move to the cloud to not only respond to the current crisis but also be better prepared for future. Below you can see some of the common cloud migration triggers that we see with our customers.

Our customers are ready to move to the cloud but don’t know where to begin. They are seeking help and guidance so that they can confidently move their on-premises workloads and applications to the cloud to meet their evolving needs.

Based on our learnings from hundreds of customer engagements, we’ve developed some recommendations and best practices guidance that you can leverage to accelerate your journey to Azure. Listen to Jeremy Winter, Partner Director of Azure Management share his top three recommendations to quickly move to the cloud in this video.
We also kicked off a blog series to address some of the common challenges that our customers face with cloud migration. You can read the kick-off blog to get an idea about the topics we’ll be discussing. We also published the next blog which focuses on financial considerations for cloud migration. Stay tuned and follow the series to learn about critical considerations for migration such as performing assessments, building the landing zone, executing migration and managing your cloud resources.
by Scott Muniz | Jul 20, 2020 | Alerts, Microsoft, Technology, Uncategorized
This article is contributed. See the original author and article here.
Update: Monday, 20 July 2020 23:42 UTC
We are aware of issues within Application Insights Live Metrics and are actively investigating. Some customers may not be able to access Live Metrics data in Azure portal.
- Next Update: Before 07/21 04:00 UTC
-vincent
by Scott Muniz | Jul 20, 2020 | Uncategorized
This article is contributed. See the original author and article here.
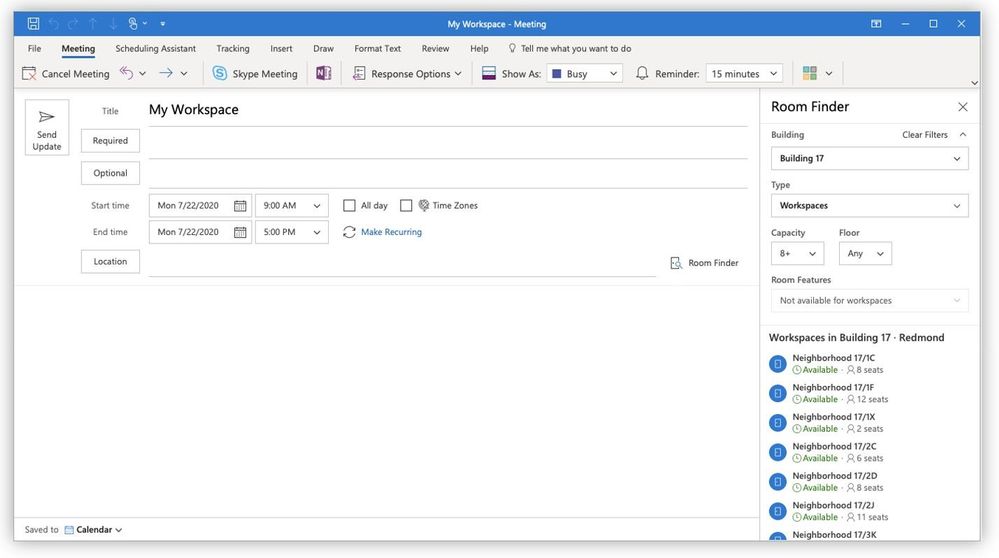
Imagine you could book an office to work anywhere in the world. Now imagine this could be done in Outlook. Well, we have built a feature to let you do that! We have built this in Outlook for Windows, Mac and Outlook on the web users with Exchange Online mailboxes.
In the image below you can see the room finder has a new ‘type’ drop down. In the drop down you would be able to select workspace or conference room. Here’s what users can expect to see in Outlook for Windows:
 The same rich capability in Outlook on the web:
 And for those cool kids with a Mac, the same great experience. No matter what client your users choose, they can use this feature just the same:

What is a workspace?
A workspace is a physical location where employees can work from. It can be made up of many desks or can be a single desk. The way you book a workspace is very similar to how you book a conference room in Outlook. The same policies that can apply for a conference room can also apply for a workspace.
The main difference with workspaces is that they have a capacity and a minimum booking duration requirement. Workspaces can be booked by the number of people that the capacity was set for. Capacity refers to the total capacity of the workspace. For example, if a workspace has 10 desks but has been already booked to 50% capacity, only 5 people can book that workspace for a specific time period. If the 11th person tries to book the same workspace, it will be shown as unavailable and they will receive an automatic decline.
How do your users book a workspace?
- Open the Outlook calendar and create a “new event”. A minimum duration of 3 hours is needed for workspace booking. We recommend booking a workspace as an all-day event.
- Set the “Show as” status to “Free” so the invite doesn’t block your calendar.
- Open the “Room finder” by selecting the location input and then “Browse with Room Finder”.
- Select your building from the drop-down and “Workspace” option from the “Type” drop-down. If you don’t see a workspace option, then your building may not have workspaces (or they have not been defined yet – see below for how to do that).
- Browse available workspaces. Availability is shown based on if there is at least one available space for the duration of this booking.
- Save the event and then the user will get the auto-generated email confirming the booking:

Note: Additional attendees can be added to an invite and a seat will be reserved for them if available. If the number of additional attendees added to the invite exceeds the number of available seats, then the booking will be rejected.
How do you create a workspace?
Configuring a workspace is very similar to how you would configure a conference room. The key to defining a room mailbox as the workspace is adding the word ‘space’ into the Custom Attribute 11 for the room.
Step 1: Create a new mailbox as a space using New-Mailbox
New-Mailbox {alias} -Room -CustomAttribute11 “space”
Step 2: Add required metadata using Set-Place. For tenants who chose to create rooms on-prem and sync to the cloud (Hybrid) you will want to use set-user and set-mailbox for the properties you can set, some of which follow:
- Capacity
- Street
- City
- State
- Postal code
- CountryOrRegion
- GeoCoordinates
- Floor
Step 3: Add workspace to an appropriate roomlist (distribution group) so the workspace shows up in a particular building, for example:
Add-DistributionGroupMember -Identity “Building 32” -Member wkspace3223@contoso.com
Note: Today, the capacity is configurable by the tenant admin. The minimum booking duration is not configurable and is currently set to 180 mins or 3 hours. In the future, we will make this policy configurable. Also, distribution groups or lists cannot be added to the booking request. Individual people can be added, and workspace bookings will count the capacity of all attendees on the request. Please note it may take up to 24 hours for workspaces and new room list to appear in the room finder.
Summary
The Outlook on the web feature is starting to roll out to all Office 365 commercial customers now. Outlook for Windows will start rolling out in the next couple of weeks and will follow the room finder roll out staging noted in this link. Outlook for Mac will be available to all Insider Fast users using the new Outlook for Mac.
We would love to know if these features help your users plan and manage their meetings and if finding the right rooms is now easier for them.
Please, tell us what you think in the comments below, in our UserVoice channel or using the in-product smile feature.
Thank you!
Victoria Rodriguez
by Scott Muniz | Jul 20, 2020 | Uncategorized
This article is contributed. See the original author and article here.
In this post I will demonstrate how to install the PowerShell Core 7.0.3 on Windows Terminal.
I am assuming that you already have Windows Terminal and a Linux distribution installed. Please check the following posts in case you need more details about how to install Windows Terminal and a Linux distro:
Using WSL2 in a Docker Linux container on Windows to run a Minecraft Java Edition
https://techcommunity.microsoft.com/t5/windows-dev-appconsult/using-wsl2-in-a-docker-linux-container-on-windows-to-run-a/ba-p/1482133

Installing .NET Core 3.1 on Windows 10
Please skip this session in case you already have .NET Core 3.1 SDK installed on Windows 10.
As PowerShell Core is developed in .NET Core 3.1, it is necessary to install .NET Core SDK available at:
https://dotnet.microsoft.com/download/dotnet-core/3.1
You need to choose an version according with your processor architecture:

I am using the x64 version:
https://dotnet.microsoft.com/download/dotnet-core/thank-you/sdk-3.1.302-windows-x64-installer

The next step is to install the PowerShell Core on Windows.
Installing PowerShell Core 7.0.3 on Windows 10
Now that .NET Core 3.1 SDK is installed, the next step is to install PowerShell Core 7.0.3 available for download at:
https://github.com/PowerShell/PowerShell/releases/tag/v7.0.3
Please selected a version according to your operating system and processor architecture:

I am using the PowerShell-7.0.3-win-x64.msi to install on Windows 10:

Once installed, open a new version of Windows Terminal and observe that PowerShell Core is installed:

Initial prompt:

Installing .NET Core 3.1 on WSL
Please skip this session in case you already have .NET Core 3.1 installed on WSL.
As PowerShell Core is developed in .NET Core 3.1, it is necessary to install .NET Core SDK available at:
https://dotnet.microsoft.com/download/dotnet-core/3.1
As I am using a 64-bit machine and the Ubuntu distro, I will install the x64 version available at:
https://dotnet.microsoft.com/download/dotnet-core/thank-you/sdk-3.1.301-linux-x64-binaries
Run the following commands to download and to extract the package :
wget https://dotnet.microsoft.com/download/dotnet-core/thank-you/sdk-3.1.301-linux-x64-binaries
sudo dpkg -i packages-microsoft-prod.deb

Run the following commands to install .NET Core SDK:
mkdir -p $HOME/dotnet && tar zxf dotnet-sdk-3.1.301-linux-x64.tar.gz -C $HOME/dotnet
export DOTNET_ROOT=$HOME/dotnet
export PATH=$PATH:$HOME/dotnet
Run dotnet to double-check if .NET Core SDK was successfully installed:

More details at:
https://dotnet.microsoft.com/download/dotnet-core/thank-you/sdk-3.1.302-linux-x64-binaries
Installing PowerShell 7.0.3 on WSL
Now that .NET Core 3.1 SDK is installed on WSL, the next step is to install PowerShell 7.0.3 whose installers are available for download at:
https://github.com/PowerShell/PowerShell/releases/tag/v7.0.3

I will install the powershell_7.0.3-1.ubuntu.18.04_amd64.deb, as I am using the Ubuntu distro.
Run the following command to download the package. Please make sure that you are using the file associated to you Linux distro.
wget https://github.com/PowerShell/PowerShell/releases/download/v7.0.3/powershell_7.0.3-1.ubuntu.18.04_amd64.deb

Once you have the package, run the following command to install it:
sudo dpkg -i powershell_7.0.3-1.ubuntu.18.04_amd64.deb
Follows the expected result:

Run the following command to launch PowerShell Core on Linux:
pwsh

Done. Now you have PowerShell Core installed on Windows and WSL.
I hope you liked!!!!
by Scott Muniz | Jul 20, 2020 | Alerts, Microsoft, Technology, Uncategorized
This article is contributed. See the original author and article here.
This post is authored by @Mimi Gentz, Senior Product Manager at Microsoft.
You may have heard that Microsoft has a free learning platform that offers interactive material to help you up-level your skills. But did you know Azure HDInsight has a whole learning path, with over three hours of material available for you to learn how Azure HDInsight can meet your businesses growing need for analytics?
Whether you’re new to cloud scale analytics, interested in migrating your on-premises analytics to the cloud, or even if you’ve gone in depth with one of the open source technologies Azure HDInsight integrates with, this course will show you the benefits of using each of the cluster types available on Azure HDInsight, what scenarios work best with each technology, and how to integrate those technologies with visualization tools such as Power BI and Jupyter Notebooks.
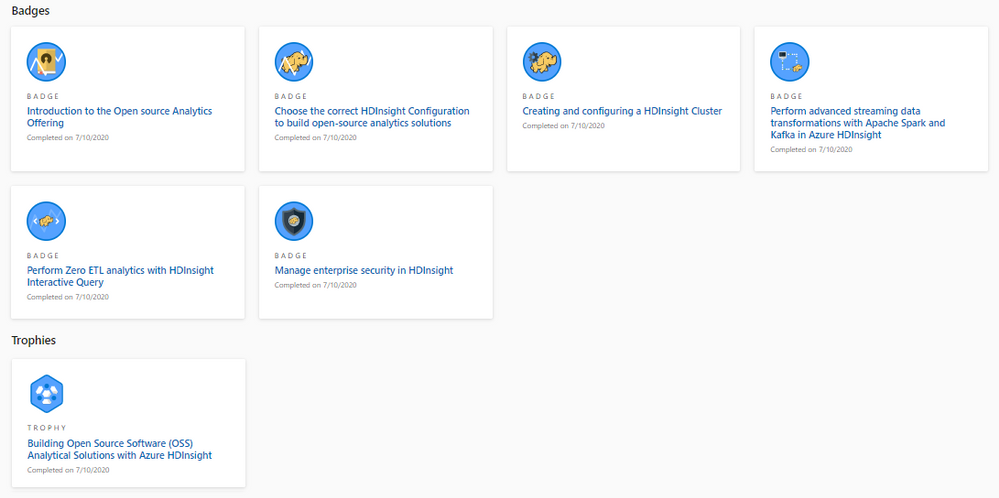
There are currently six modules in the Building Open Source Software (OSS) Analytical Solutions with Azure HDInsight learning path (with more to come), and in this blog we’ll take a look at what you’ll learn in each one. Think of a module as a chapter in a book, and the learning path as the whole book. Throughout each module you’ll complete tutorials, read, and fill in short quizzes to check your learning.
Keep in mind that you can complete these modules at your own pace. Once you create a Learn profile and sign-in, your progress will be automatically tracked by the Learn site, and you’ll earn XP (experience points) as you go. As you complete modules and learning paths, you’ll earn badges and a trophy that you can share on social media to impress all your friends!

What will you learn in each module?
- In the Introduction module, you’ll learn how analytics (using open-source frameworks such as Hadoop, Apache Spark, Apache Hive, Interactive Query, and Apache Kafka) is implemented within Azure HDInsight, how storage and processing are decoupled (to save you money), and how Azure HDInsight, unlike its competitors, has a unique ability to support business processes that require multiple workloads.
- In the Choose the correct HDInsight Configuration to build open-source analytics solutions module, you’ll learn which HDInsight cluster type to select to best support your scenario and which processing and analysis business requirements Azure HDInsight supports. Additionally, you’ll walk through a sample case study to determine the best HDInsight cluster configuration to choose, and you’ll learn about some of the cost saving measures HDInsight provides.
- In the Creating and configuring a HDInsight cluster module, you’ll create an Azure HDInsight cluster in the Azure portal, create a Jupyter notebook that is linked to that cluster, run some queries on the data to create visual representations, monitor your cluster, and learn how to troubleshoot common issues.
- In the Perform advanced streaming data transformations with Apache Spark and Kafka in Azure HDInsight module, you’ll learn about common scenarios where Kafka and Spark can be used for real-time analytics and structured streaming, you’ll create a VNet and add a Spark and Kafka cluster to it, then you’ll create a Kafka producer and stream the data into a Jupyter notebook.
- In the Perform Zero ETL analytics with HDInsight Interactive Query module, you’ll learn how Interactive Query is great for ad-hoc analytics with minimal transformations, you’ll create an Interactive Query cluster in the Azure Portal, upload data using Data Analytics Studio, explore Hive tables using a Zeppelin notebook, and create a Power BI dashboard for evaluating real estate trends in the sample data.
- In the Manage enterprise security in HDInsight module, you’ll learn about the shared responsibility model, Network Security Groups (NSGs), HDInsight Service Tags, VNets, operating system security, authentication with AAD and MFA, authorization of specific actions and operations, data access security, Transport Layer Security (TLS) 1.2, virtual network service endpoints, and customer-managed keys.

Get started by going to Building Open Source Software (OSS) Analytical Solutions with Azure HDInsight and starting your learning path today. Feel free to post your feedback, issues, or requests about HDInsight learning content to this page or via the Feedback channel.
Thanks,
Mimi
Azure HDInsight Twitter | Documentation | Service Updates
Mimi Gentz Twitter | Linked In | Docs Achievements and Trophies

Recent Comments