by Contributed | Oct 5, 2020 | Uncategorized
This article is contributed. See the original author and article here.
Microsoft Information Protection is a built-in, intelligent, unified, and extensible solution to protect sensitive data across your enterprise – in Microsoft 365 cloud services, on-premises, third-party SaaS applications, and more. Microsoft Information Protection provides a unified set of capabilities to know your data, protect your data, and prevent data loss across cloud services, devices, and on-premises file shares.
For data you have in file shares and SharePoint sites on-premises, scanner helps you discover the sensitive content and enables you to automatically label and protect it per policy you have configured in the Microsoft 365 compliance center. Every month, billions of files are scanned and protected on-premises using scanners by hundreds of different organizations to comply with internal policy and external regulations.
But customers looking to discover and protect sensitive data on premises are faced with two challenges. One is knowing where to start. This challenge is compounded by the fact that new content and new file shares are being constantly created by your end users. The second challenge is determining how to prioritize scanning among the thousands of repositories with petabytes of data. The new network discovery feature within a scanner, that is part of the latest Q3 preview, helps you tackle both these challenges. You can now use this as a step zero in your on-premises data discovery journey to map your file shares and identify the overexposed file shares to prioritize. The network discovery feature of the scanner enables you to target your IP ranges, or specific IPs, to find the shares hosted in these networks and use access information to identify overexposed file shares.
With this nee network discovery feature of the scanner it’s a matter of few hours to scan class B subnets with 65K IP addresses. Once the network discovery is finished the admins get a report of all shares, their share permissions, NTFS permissions and effective access to a standard user with access to the network. The report includes a hint on what shares are open to Everyone / Authenticated Users / Domain Users, which helps admins to identify assets that can be accessed by to anybody with physical access to your network. The next step will be triaging the discovered file repositories and adding them to a content scan job for deeper investigation.
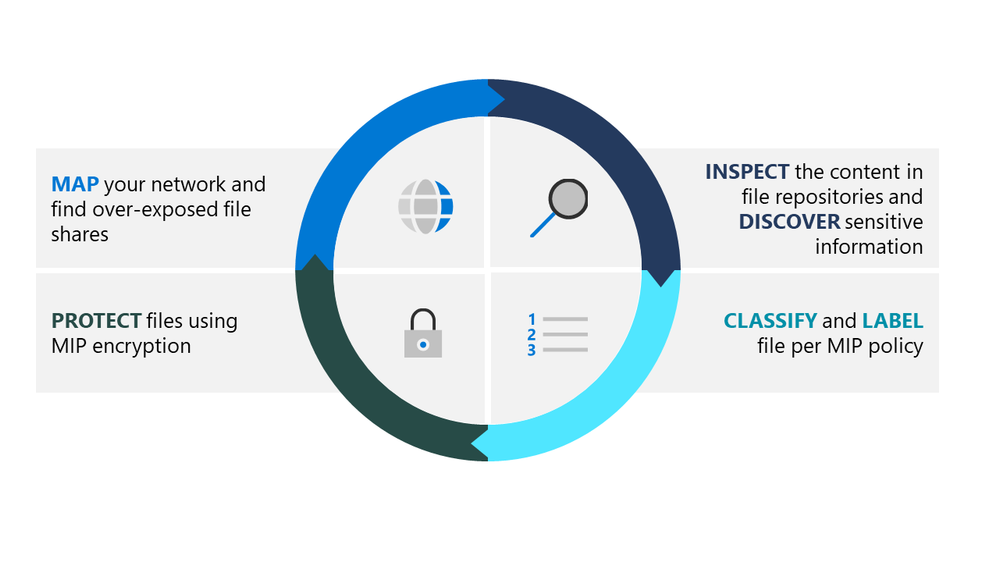
The new methodology for on-premises scanner deployment includes four steps:
- First – define the target repositories that might contain sensitive information. With the new network discovery feature that was just released you can now map your file shares by scanning IP ranges and feeding the results into deep file content inspection
- Second – inspection of files stored in the scanned file shares and SharePoint on-premises sites. The goal of this step is to discover what sensitive information is stored in these files.
- Third – apply MIP sensitivity labels on files. Labeling enables end users to be aware of file sensitivity and handle the files according to the organization’s policy, and allows other systems, for example DLP, to use sensitivity labels for data exposure mitigation.
- Last step – apply protection per MIP policy on most sensitive files that require right management enforcement.

Figure 1: Microsoft Information Protection methodology for implementation of on-premises scanner for data at rest
So, how can you start? Download the latest preview release and upgrade your existing scanner deployment or install a fresh new deployment. Once the setup is completed you use PowerShell cmdlet to create the Network Discovery service and create a new Network scan job that contains a list of the IP ranges you would like to scan.
After configuring the network scan job and allocating a scanner cluster to execute it, the scan will start according to the schedule. Once the scan is completed all the discovered file shares will be listed under Repositories blade. You can filter the discovered repositories by setting “Discovered By” filter to “Network scan”.

Figure 2: Network scan results
You can now review the results and select the repositories you would like to add to the deep scan using the Content scan job.
Similar to the existing scanner deployments you can also use Network discovery with offline configuration or in air-gap scenarios. In this case your results will be available in the Report folder under scanner account profile at %localappdata%MicrosoftMSIPScannerReports.
As always, we encourage you to download the bits, deploy and share your feedback on Yammer community to help us to build the best product to meet your security needs.
by Contributed | Oct 4, 2020 | Uncategorized
This article is contributed. See the original author and article here.
Let’s have a look at the Project Bicep and ARM Template Toolkit, and GitHub Actions for both.
Once we build an ARM template, we need to verify whether the template is written in a proper way or will be working as expected. I wrote a couple of blog posts, #1 and #2, using Pester for ARM Template validation. However, that approach required us to log in to Azure first, which was doable but less desirable. What if we can verify the template without having to log in to Azure?
In my previous post, I introduced the Project Bicep that build ARM templates way easier. Throughout this post, I’m going to discuss ARM Template Toolkit (ARM-TTK) to lint and validate the templates, and how this process can be applied to our CI/CD pipelines using the GitHub Actions workflow.
The sample Bicep code used in this post can be downloaded from this GitHub repository.
ARM Template Toolkit (ARM TTK)
ARM Template Toolkit(ARM TTK) offers consistent and standard ways of coding practices to build ARM templates with much more readability that includes:
- Validating the author’s intentions by eliminating unused parameters and variables,
- Applying security practices like outputting secrets in plain text format, and
- Using environment functions to provide constants like domain suffixes, rather than hard-coded values.
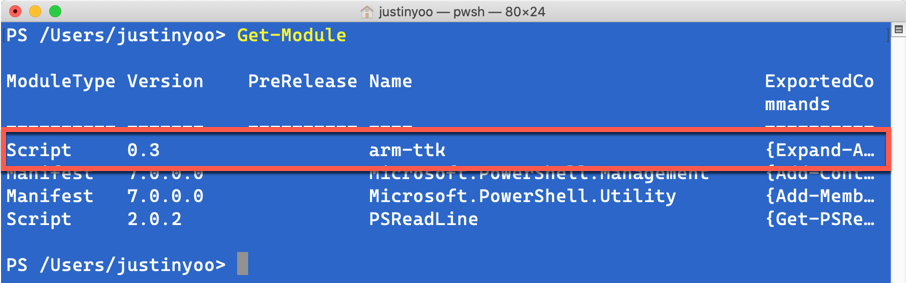
ARM TTK is written in PowerShell, as of writing this post, it’s v0.3. As PowerShell supports cross-platform, ARM TTK can also run on Windows, Mac and Linux boxes.

In order to use ARM TTK, I’d recommend cloning the GitHub repository rather than downloading the artifact linked from the official document because the repository gets regularly updated in a fast pace.
Run ARM TTK against Templates
First of all, run the bicep CLI to build the ARM template.
bicep build **/*.bicep
Then, run the following PowerShell command. Please note that, if you want to test all ARM templates in a specific directory, there MUST be either azuredeploy.json or maintemplate.json in the directory; otherwise ARM TTK will complain it.
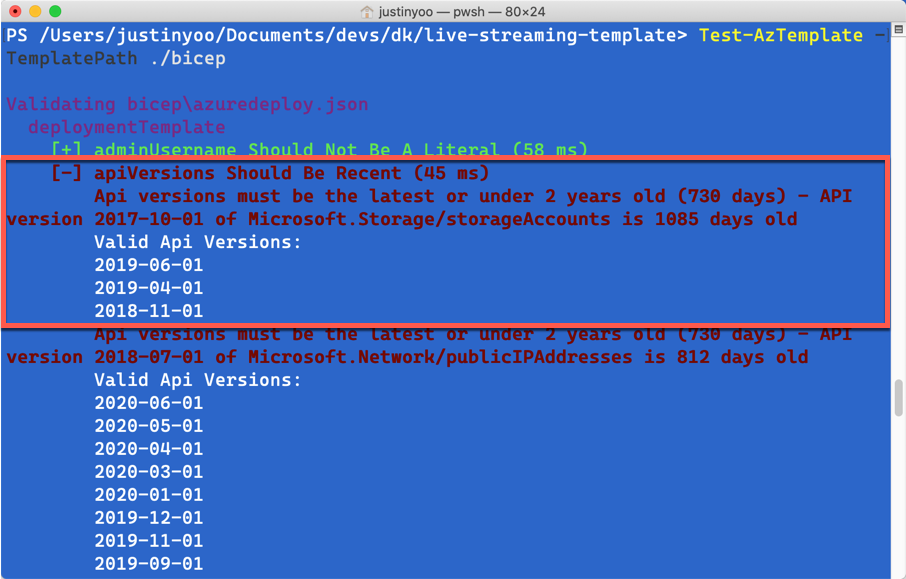
Test-AzTemplate -TemplatePath ./bicep
The result after running ARM TTK might look like below. I’ve got my template using the old API version. For example, Azure Storage Account uses the API version of 2017-10-01, which is older than two years. It complains that I SHOULD use the newest version of 2019-06-01.
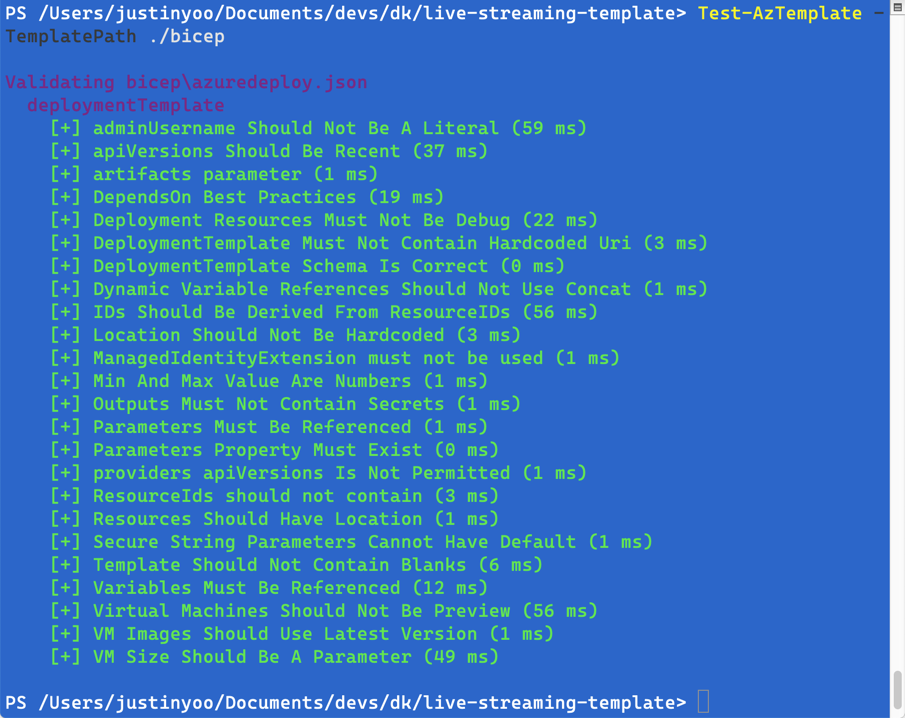
After fixing all the complaints and running ARM TTK again, it passes all the linting!
Run GitHub Actions for Bicep CLI and ARM TTK on CI/CD Pipelines
We’ve got all bicep CLI and ARM TTK working in our local machine. Let’s run both bicep CLI and ARM TTK on CI/CD pipelines. There are two GitHub Actions for both.
After applying those actions to the CI/CD pipeline, it might look like the following:
    name: ARM Template Build and Test

    on: [ push, pull_request ]

    jobs:
      build_and_test:
        name: Build and Test

        runs-on: ubuntu-latest

        steps:
        - name: Checkout the repo
          uses: actions/checkout@v2

        - name: Run Bicep build
          uses: aliencube/bicep-build-actions@v0.1
          with:
            files: '**/*.bicep'

        - name: Run ARM TTK
          uses: aliencube/arm-ttk-actions@v0.3
          id: armtest
          with:
            path: ./bicep

        - name: Show ARM TTK test result
          shell: bash
          continue-on-error: true
          run: |
            echo 'Results: ${{ toJSON(fromJSON(steps.armtest.outputs.results)) }}'
- All the
.bicep files are compiled to ARM templates through the Bicep Build action (line #15-18).
- Lint those converted ARM templates through the ARM TTK action (line #20-24).
- Display the result generated from the ARM TTK action. As the ARM TTK action returns an output as a JSON object format, we can leverage the JSON object to generate test reports (line #26-30).
Now, by following this workflow, we can easily build the .bicep files and verify them. Then only passed templates can provision resources to Azure.
But, we should make sure one thing. Before running ARM TTK, the ARM template worked perfectly fine. However, ARM TTK complained that it was not compliant. It means that ARM TTK doesn’t validate what the provisioning result will be, but do check the code quality. Therefore, to check whether the resources declared in the template will be provisioned or not, we still need other testing logic, discussed in the previous posts #1 and #2.
So far, we’ve set up the CI/CD pipeline with Bicep CLI and ARM TTK to build and verify the .bicep files. Can you play them around on your own pipelines?
This article was originally published on Dev Kimchi.
by Contributed | Oct 4, 2020 | Uncategorized
This article is contributed. See the original author and article here.
Hello folks,
Bruno Gabrielli here again.
While there are lots of good resources about writing Log Analytics queries and many blog posts have been written, today I would like to point your attention to something that I am frequently seeing on 99% of my Azure Log Analytics customers.
It is about a very simple, but most often under evaluated, aspect of writing queries: query performance also referred as query speed or query efficiency. I will give you my point of view using a series-of posts. Welcome to part 1  .
.
Let me quickly spend some words on the query language behind Azure Log Analytics. The language was first conceived when a service codenamed Kusto was first launched internally at Microsoft in 2014. This service, now available to everyone as Azure Data Explorer, introduced among its many components the Kusto Query Language (KQL). Eventually, the service kept growing and powering more and more services, including the service today known as Azure Monitor Logs (formerly known as OMS, and Azure Log Analytics). As you can imagine, this journey was not only a simple rename but also included enhancements in the number of commands, functions, operators, etc. as well as performance and scalability improvements. Nowadays, it is a very powerful query language with lots of good features and functionalities.
Among all, the 2 things I appreciate the most in this language are: the use of pipelines (like in PowerShell; see Understanding pipelines) and a set of commands that are instantly familiar to anyone who has used languages such as SQL. This means to me that if you have even a basic understanding of SQL Syntax, you start with an advantage (see SQL to Kusto query translation) . If you wish, you can read more about the query language on the Overview documentation page.
I want to stress that understanding the use of pipelines is fundamental to the creation of “efficient” queries. If you went through the pipelines article above, you are now familiar with the concept that pipelines are used to pass commands’ output, or in this case the dataset, to the next command. With that clear in mind, let me ask you a question and, at the same time, give you food for thought: what happens if you pass a big amount of data to the next command and then to the next and so on? Simple answer: the commands will be taking more time than necessary to complete because they will have to process the entire amount of data passed by the previous command(s) which include useless data.
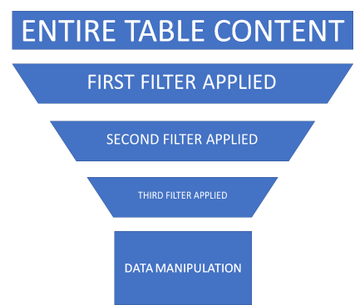
I think we definitely agree on the fact that probably there is no single correct way of writing queries, but that there are for sure some not optimized ways of doing it. For instance, what do you think about doing a search on all tables or not filtering against time as first thing in your query? I tried myself experimenting these best-practices and found out the huge benefit out of them. In particular the first query was very time consuming and ran longer than expected from a platform like Azure. But it is not Azure fault; it’s actually our fault not following them! Know your data first!!!
That means that we should avoid as much as possible production queries that:
- Use the search command to search the entire workspace.
- Do not filter enough (remember to filter against time first).
in favor of being selective with the data we need and applying filters pipeline after pipeline.
The secret is exactly in the table selection as well as in the filtering since each pipeline will pass a smaller dataset to the next, making the rest of the query more and more efficient. You got it! We can reduce the amount data upfront by selecting the right table(s) and we can reduce even more by cutting useless data by filtering.
Using the funnel approach represented below, you surely notice that by selecting the right table and by filtering out pipeline after pipeline, the effective data manipulation will happen on a smaller amount of data. This will make the query much more efficient and the underlying engine working faster as we all expect. Remember that, even if scalability is not even a point in Azure, if we all run poor-written queries we all suffer the consequences.

So, coming back to the bad examples:
- Using the search operator searching the entire workspace means that query engine will scan each and every table and column which is very bad.
- Not using good filters will make a dataset bigger than needed/expected to be passed along to the next pipeline.
If what I explained so far makes sense, you’ll discover that the gotcha is: you should know how your data looks like and should, as much as possible, never write a query for production environments using the 2 approaches above.
To prove what I am saying, I am going to give you some examples of what happens when not following the above mentioned best-practices:
- Scenario #1: Searching the entire table:
search “26401”
vs
SecurityEvent | where EventId == “26401”
to search for an event ID with number 26401. The result screenshots below show the 2 queries returning the same number of records but taking a considerable different amount of time. You can easily compare the execution time: ~18 secs compared to ~5 secs.


- Scenario #2: Always filter by time first, either by
- using the built-in Time Range picker:
Event | where EventID == 7036 | where Computer == “SC-DC01.Contoso.Local”

or using the where clause directly in the query:
Event | where TimeGenerated > ago(7d) | where EventID == 7036 | where Computer == “SC-DC01.Contoso.Local”

TIP: Time Range picker and where clause behave the same. The only advantage using the where clause is that you can define more intervals compared to the list offered by the Time Picker. The screenshots above, show the method in in action.
Instead of doing this after other filters
Event | where EventID == 7036 | where Computer == “SC-DC01.Contoso.Local” | where TimeGenerated > ago(7d)

to search for EventID 7036 received from a computer called SC-DC-01.Contoso.Local in the necessary amount of time (i.e. last 7 days).
You can easily notice they are returning the same number of records (I precisely counted them using a different query and they were 272) running for an interesting different amount of time (~0.5 secs compared to ~1.2 secs).
Considering that I am using my lab workspace which contains less than 9GB of data, would you image how much time can you save on a workspace of 1TB? And how much time can we save, and what benefit can we get altogether by running well written queries?
I leave you reflecting on this and making your calculation .
Thanks,
Bruno.
Disclaimer
The sample scripts are not supported under any Microsoft standard support program or service. The sample scripts are provided AS IS without warranty of any kind. Microsoft further disclaims all implied warranties including, without limitation, any implied warranties of merchantability or of fitness for a particular purpose. The entire risk arising out of the use or performance of the sample scripts and documentation remains with you. In no event shall Microsoft, its authors, or anyone else involved in the creation, production, or delivery of the scripts be liable for any damages whatsoever (including, without limitation, damages for loss of business profits, business interruption, loss of business information, or other pecuniary loss) arising out of the use of or inability to use the sample scripts or documentation, even if Microsoft has been advised of the possibility of such damages.

by Contributed | Oct 3, 2020 | Azure, Technology, Uncategorized
This article is contributed. See the original author and article here.
At Ignite, we announced the preview of a new deployment option for Azure Database for PostgreSQL: Flexible Server. Flexible Server is the result of a multi-year Azure engineering effort to deliver a reimagined database service to those of you who run Postgres in the cloud. Over the past several years, our Postgres engineering team has had the opportunity to learn from many of you about your challenges and expectations around the Single Server deployment option in Azure Database for PostgreSQL. Your feedback and our learnings have informed the creation of Flexible Server.
If you are looking for a technical overview of what Flexible Server is in Azure Database for PostgreSQL—and what the key capabilities are, let’s dive in.

Flexible server is architected to meet requirements for modern apps
Our Flexible Server deployment option for Postgres is hosted on the same platform as Azure Database for PostgreSQL – Hyperscale (Citus), our deployment option that scales out Postgres horizontally (by leveraging the Citus open source extension to Postgres).
Flexible Server is hosted in a single-tenant Virtual Machine (VM) on Azure, on a Linux based operating system that aligns naturally with the Postgres engine architecture. Your Postgres applications and clients can connect directly to Flexible Server, eliminating the need for redirection through a gateway. The direct connection also eliminates the need for an @ sign in your username on Flexible Server. Additionally, you can now place Flexible Server’s compute and storage—as well as your application—in the same Azure Availability Zone, resulting in lower latency to run your workloads. For storage, our Flexible Server option for Postgres uses Azure Premium Managed Disk. In the future, we will provide an option to use Azure Ultra SSD Managed Disk. The database and WAL archive (WAL stands for write ahead log) are stored in zone redundant storage.
 Flexible Server Architecture showing PostgreSQL engine hosted in a VM with zone redundant storage for data/log backups and client, database compute and storage in the same Availability Zone
There are numerous benefits of using a managed Postgres service, and many of you are already using Azure Database for PostgreSQL to simplify or eliminate operational complexities. With Flexible Server, we’re improving the developer experience even further, as well as providing options for scenarios where you want more control of your database.
A developer-friendly managed Postgres service
For many of you, your primary focus is your application (and your application’s customers.) If your application needs a database backend, the experience to provision and connect to the database should be intuitive and cost-effective. We have simplified your developer experience with Flexible Server on Azure Database for PostgreSQL, in few key ways.
-
Intuitive and simplified provisioning experience. To provision Flexible Server, some of the fields are automatically filled based on your profile. For example, Admin username and password use defaults but you can always overwrite them.
-
Simplified CLI experience. For example, it’s now possible to provision Flexible Server inside a virtual network in one command, and the number of keystrokes for the command can be reduced by using local context. For more details, see Flexible server CLI reference.
 CLI command to provision the Flexible Server
-
Connection string requirement. The requirement to include @servername suffix in the username has been removed. This allows you to connect to Flexible Server just like you would to any other PostgreSQL engine running on-premise or on a virtual machine.
-
Connection management: Pgbouncer is now natively integrated to simplify PostgreSQL connection pooling.
-
Burstable compute: You can optimize cost with lower-cost, burstable compute SKUs that let you pay for performance only when you need it.
-
Stop/start: Reduce costs with the ability to stop/start the Flexible Server when needed, to stop a running service or to start a stopped Service. This is ideal for development or test scenarios where it’s not necessary to run your database 24×7. When Flexible Server is stopped, you only pay for storage, and you can easily start it back up with just a click in the Azure portal.
 Screenshot from the Azure Portal showing how to stop compute in your Azure Database for PostgreSQL flexible server when you don’t need it to be operational.
 Screenshot from the Azure Portal depicting how to start compute for your Azure Database for PostgreSQL flexible server, when you’re ready to restart work.
Maximum database control
Flexible Server brings more flexibility and control to your managed Postgres database, with key capabilities to help you meet the needs of your application.
-
Scheduled maintenance: Enterprise applications must be available all the time, and any interruptions during peak business hours can be disruptive. Similarly, if you’re a DBA who is running a long transaction—such as a large data load or index create/rebuild operations—any disruption will abort your transaction prematurely. Some of you have asked for the ability to control Azure maintenance windows to meet your business SLAs. Flexible Server will schedule one maintenance window every 30 days at the time of your choosing. For many customers, the system-managed schedule is fine, but the option to control is helpful for some mission-critical workloads.
 Screenshot from the maintenance settings for Azure Database for PostgreSQL flexible server in the Azure Portal, showing where you can select the day of week and start time for your maintenance schedule.
-
Configuration parameters: Postgres offers a wide range of server parameters to fine tune the database engine performance, and some of you want similar control in a managed service as well. For example, there is sometimes a need to mimic the configuration you had on-premises or in a VM. Flexible Server has enabled control over additional server parameters, such as Max_Connections, and we will add even more by Flexible Server GA.
-
Lower Latency: To provide low latency for applications, some of you have asked for the ability to co-locate Azure Database for PostgreSQL and your application in physical proximity (i.e. the same Availability Zone). Flexible Server provides the ability to co-locate the client, database, and storage for lower latency and improved out-of-the-box performance. Based on our internal testing and customer testimonials, we are seeing much better out-of-the-box performance.
-
Network Isolation: Some of you need the ability to provision servers with your own VNet or subnet, to ensure complete lock down from any outside access. With Flexible Server private endpoints, you can completely isolate the network by preventing any public endpoint to exist for the database workload. All connections to the server on public or private endpoints are secured and encrypted by default with SSL/TLS v1.2.
Zone-redundant high availability
With the new Flexible Server option for Azure Database for PostgreSQL, you can choose to turn on zone redundant high availability (HA). If you do, our managed Postgres service will spin up a hot standby with the exact same configuration, for both compute and storage, in a different Availability Zone. This allows you to achieve fast failover and application availability should the Availability Zone of the primary server become unavailable.
Any failure on the primary server is automatically detected, and it will fail over to the standby which becomes the new primary. Your application can connect to this new primary with no changes to the connection string.
Zone redundancy can help with business continuity during planned or unplanned downtime events, protecting your mission-critical databases. Given that the zone redundant configuration provides a full standby replica server, there are cost implications, and zone redundancy can be enabled or disabled at any time.
 Screenshot from the Azure Portal depicting an Azure Database for PostgreSQL flexible server in a zone-redundant HA configuration, with the primary server in Availability Zone 1 and the standby server in Availability Zone 2.
Get started with Flexible Server today!
We can’t wait to see how you will use our new Flexible Server deployment option that is now in preview in Azure Database for PostgreSQL. If you’re ready to try things out, here are some quickstarts to get you started:
Azure Database for PostgreSQL Single Server remains the enterprise ready database platform of choice for your mission-critical workloads, until Flexible Server reaches GA. For those of you who want to migrate over to Flexible Server, we are also working to provide you a simplified migration experience from Single Server to Flexible Server with minimal downtime.
If you want to dive deeper, the new Flexible Server docs are a great place to roll up your sleeves, and visit our website to learn more about our Azure Database for PostgreSQL managed service. We are always eager to hear your feedback so please reach out via email using Ask Azure DB for PostgreSQL.
Sunil Agarwal
Twitter: @s_u_n_e_e_l
by Contributed | Oct 2, 2020 | Uncategorized
This article is contributed. See the original author and article here.
Update 2010 for the Technical Preview Branch of Microsoft Endpoint Configuration Manager has been released.
To assist you when creating scripts and queries in the Configuration Manager console, you’ll now see syntax highlighting. Supported languages for syntax highlighting include PowerShell, JavaScript/JScript, VBScript, and SQL/WQL.
 Syntax highlighting in ConfigMgr
Learn more about syntax highlighting for scripting languages.
This preview release also includes:
Desktop Analytics support for Windows 10 Enterprise LTSC – For customers who want to shift from long term servicing channel (LTSC) to the semi-annual servicing channel, to have access to new features, services, and other major changes. Starting in this release, you can now enroll LTSC devices to Desktop Analytics to evaluate in your deployment plans.
Improvements to scenario health – Technical preview version 2008 added the ability to monitor scenario health, which initially focused on SQL Server Service Broker. In this release, you can now monitor the health of the fast channel used for client actions. If your environment is tenant attached with devices uploaded, this feature helps you see potential issues with client actions from the Microsoft Endpoint Manager admin center. You can also use this feature for on-premises client actions. For example, CMPivot, run scripts, and device wake-up.
Expanded Windows Defender Application Control management – Windows Defender Application Control enforces an explicit list of software allowed to run on devices. In this technical preview, we’ve expanded Windows Defender Application Control policies to support devices running Windows Server 2016 or later.
Deploy a task sequence to a user – Based on your UserVoice feedback, you can now deploy a non-OS deployment task sequence to a user-based collection. Use the task sequence deployment type of an application to install or uninstall it.
Shortcuts to status messages – Based on your UserVoice feedback, you now have an easier way to view status messages for the following objects:
- Devices
- Users
- Content
- Deployments
Select one of these objects in the Configuration Manager console, and then select Show Status Messages from the ribbon. Set the viewing period, and then the status message viewer opens. The viewer filters the results to the object you selected.
Enable user proxy for software update scans – Beginning with the September 2020 cumulative update, HTTP-based WSUS servers will be secure by default. A client scanning for updates against an HTTP-based WSUS will no longer be allowed to leverage a user proxy by default. If you still require a user proxy despite the security trade-offs, a new software updates client setting is available to allow these connections.
Improvements to task sequence performance for power plans – Starting in Configuration Manager version 1910, to improve the overall speed of the task sequence, you can activate the Windows power plan for High Performance. Starting in this technical preview release, you can now use this option on devices with modern standby and other devices that don’t have that default power plan.
Update 2010 for Technical Preview Branch is available in the Microsoft Endpoint Configuration Manager Technical Preview console. For new installations, the 2007 baseline version of Microsoft Endpoint Configuration Manager Technical Preview Branch is available on the Microsoft Evaluation Center. Technical Preview Branch releases give you an opportunity to try out new Configuration Manager features in a test environment before they are made generally available.
We would love to hear your thoughts about the latest Technical Preview! Send us Feedback about product issues directly from the console and use our UserVoice page for ideas about new features.
Thanks,
The Configuration Manager team
Configuration Manager Resources:
Documentation for Configuration Manager Technical Previews
Try the Configuration Manager Technical Preview Branch
Documentation for Configuration Manager
Microsoft Endpoint Manager announcement
Microsoft Endpoint Manager vision statement
Configuration Manager Forums
Configuration Manager Support

by Contributed | Oct 2, 2020 | Uncategorized
This article is contributed. See the original author and article here.
We were recently alerted to a scenario whereby after an end user updated to iOS/iPadOS 14, they experienced the inability to import any file from an MDM-managed File Provider such as importing a file from OneDrive to another MDM-managed app, and the error: “Content Unavailable. The folder contents could not be displayed because of an unknown error. Try again” is presented. This issue can occur when the iOS/iPadOS 14 device is enrolled in Intune, and has a Device configuration policy configured with the following setting: “Viewing corporate documents in unmanaged apps” = Blocked.
Working with Apple, we discovered that this is a regression in iOS/iPadOS 14. Apple is working on a resolution and we’ll update this post when new information is available.
Here’s the steps we took to replicate this experience:
- Login to the Microsoft Endpoint Manager admin center, configure and target a device configuration policy with the above setting configured to a user account.
- Make OneDrive and Teams a “Required” or “Available” app targeting the user.
- Enroll an iOS or iPadOS 14 device with the targeted user account via the Intune Company Portal.
- Install OneDrive and Teams via the Company Portal.
- Launch OneDrive to login.
- Launch Teams to login and start a new chat.
- Tap on the paper clip button to add an attachment.
- Select “Browse” and if needed, enable OneDrive under “More Locations”.
- Select “OneDrive”.
Expected: Able to access OneDrive content.
Actual: Error above is shown.
Note: The scenario above was tested with the Microsoft Teams app and may not the only way to reproduce this issue. Any app which integrates the File Provider extension can hit this issue, including the native Mail app, Outlook, OneNote, native Files app, and more. So specific repro steps may vary based on specific app.
In the interim, here are a couple of potential workarounds:
- Open the OneDrive app, select the “…” next to the file you want to attach/import a copy of, select “Open in Another App” to get a list of apps that the file can be copied to. Users may also share a link to the file in OneDrive via the “Share” option.
Note: This workaround may differ based on the specific app. For example, Outlook can access the OneDrive backend directly, and thus attaching files from OneDrive is still possible without needing to switch to the OneDrive app.
- If you’re testing on the iOS/iPadOS 14 Beta, we’ve received reports that this has been addressed on the iOS 14.0.2 Beta and above.
Again, we’ll keep this post updated as we receive additional information.
by Contributed | Oct 2, 2020 | Uncategorized
This article is contributed. See the original author and article here.
There are many use cases in which organizations send push notifications to nudge their users to take an assessment or reply to a questionnaire. The Proactive Scenario API in Healthcare Bot service allows to initiate a scenario proactively. This documentation explains how to proactively invoke a scenario using Twilio SMS channel. Using the same principles, we will walkthrough the different steps to configure proactive messaging in Teams.
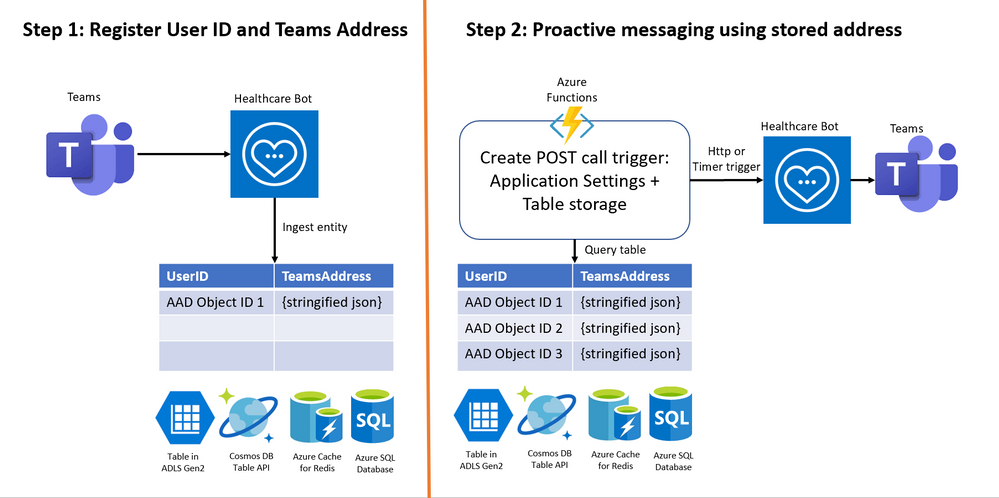
The configuration is done in 2 steps –
Step 1: Register User ID and Teams Address
Step 2: Invoke scenario programmatically for all registered users
Below is a visual of the two necessary steps:

Pre-requisites:
- Azure subscription, you will need to create additional Azure services to complete the configuration, ensure to have necessary access rights in your subscription. Login to https://portal.azure.com
- Microsoft Healthcare Bot service – Create a healthcare bot
- A good understanding of creating Azure Functions and binding with data platforms such as Azure Table storage
Step 1: Register User ID and Teams Address
1. Login to Azure portal. Create a table to store –
- User ID = Azure AD Object ID in case of Teams
- Address = Teams Address unique to each user
To save these 2 key-value pairs, there are many options available in Azure data platform including Table in Azure Data Lake storage Gen2, Cosmos DB Table API, Azure Cache for Redis and Azure SQL Database. We’ll create a Table in ADLS Gen2 with
- Partition key = Azure AD Object ID,
- Row key = <any random string> (teamsAddress as seen in screenshot below) Note: Address could not be stored in Row key because of limitation of 255 byte size
- Address = unique Teams Address
- Timestamp
This is a screenshot of a table in ADLS Gen2 viewed in Azure Storage Explorer.

2. In Healthcare Bot service, enable Teams as UI channel using this link and test the bot in Teams.
3. In Healthcare bot, create a scenario with write function to the table created in step 1 above. A sample scenario can be found at this GitHub link. Basically you need two scenario elements in the scenario as shown below:

Scenario element 1: Init Action to extract Teams Address, Azure AD Object ID and generate a Timestamp

Scenario element 2: Ingest to table storage using table’s endpoint in the form –
https://<storageaccountname>.table.core.windows.net/<tablename>?<sas-authentication-key>

4. Manually invoke by writing ‘begin registeruser’ in Teams channel or you call healthcare bot from another bot in Teams.

Step 2: Invoke scenario programmatically for all registered users
Once you have all of the user IDs and Teams addresses, an organization’s administrator can create an Azure function for Step 2 to set up a POST call trigger to send daily/regular notifications to registered users in Teams. You will need the POST call, the authorization token, and the body of the post call – all of which have to be created in an Azure function.
Note: A sample code is available in this GitHub link – this file is part of COVID-19 Back to Work solution and writes required User ID and Teams Addresses to Azure SQL database. We are using this repository for reference of Azure function. Use the code with caution and customize it to the Azure storage platform you chose in above step.
1. In this step, gather all information required for the POST request API call –
- Healthbot Trigger Call – choose based on your closest region
ii. Healthbot Tenant Name – Healthcare bot admin portal > Integration > Secrets > tenant name
iii. Healthbot API_JWT_SECRET_KEY – Integration > Secrets > API_JWT_Secret Key
iv. Healthbot ScenarioId – Scenarios > Manage page. Find the relevant scenario and copy its Scenario ID
Once you have these values handy, save them in Azure Function App’s Application Settings.
2. JWT token for authentication in POST request header (GitHub – function GetJwtToken)
3. Read Teams Address of each recipient required in POST request body from Table storage. Create a binding between Azure function and Table storage using this link
4. Execute the Http or Timer Trigger POST call in Function App (GitHub – TriggerTeamsNotification.cs)
Additional Resources
- For using Azure Functions full codebase related to proactive messaging and using Azure SQL database as data source – COVID-19 Back-to-Work solution
- For getting started on Healthcare Bot and COVID-19 templates – Quick Start
Thanks for reading and let us know how else we can help!

Nikita Pitliya, Microsoft Senior Solutions Architect
by Contributed | Oct 2, 2020 | Uncategorized
This article is contributed. See the original author and article here.
Delta is, by default, a user-scoped API to drive sync-like behavior. It scopes its results down to the set of changes which are definitely impactful to the caller. It filters out changes which it knows are irrelevant to the caller. When the API cannot definitely determine relevance cheaply, e.g. when it needs to make a full permission enumeration to verify, it will include the result, even though it might not be relevant to the caller.
Delta attempts to scope permission-based changes to those relevant to the caller. If the caller’s access wasn’t altered by the permission change, the item may not be included in the delta results.
Clients which are trying to enumerate all permission changes should make sure the follow the recommendations in aka.ms/scanguidance. Namely, there are specific authentication requirements and specific Prefer headers that need to be provided, and failure to do so will result in permission changes being scoped down.
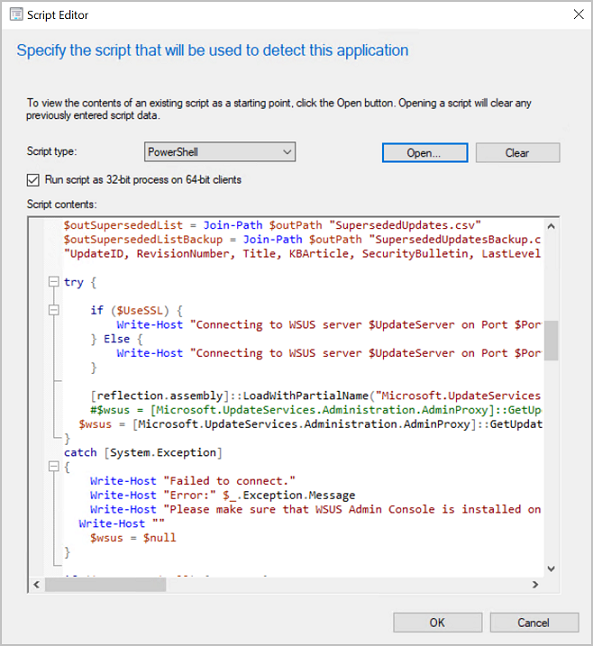
The only way to receive the complete set of changes is to use app-only authentication with the Sites.FullControl.All scope and pass header “Prefer”=”deltashowsharingchanges,hierarchicalsharing”.
Steps:
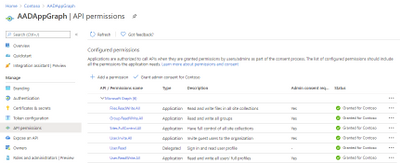
1] Create an App in AAD with Sites.FullControl.All Application permission, see screen shot below:

2] Sample powershell script to generate the Access token and the delta token link:
<#
Code Example Disclaimer:
Sample Code is provided for the purpose of illustration only and is not intended to be used in a production environment.
THIS SAMPLE CODE AND ANY RELATED INFORMATION ARE PROVIDED "AS IS" WITHOUT WARRANTY OF ANY KIND, EITHER EXPRESSED OR IMPLIED,
INCLUDING BUT NOT LIMITED TO THE IMPLIED WARRANTIES OF MERCHANTABILITY AND/OR FITNESS FOR A PARTICULAR PURPOSE.
We grant You a nonexclusive, royalty-free right to use and modify the Sample Code and to reproduce and distribute the object
code form of the Sample Code, provided that. You agree: (i) to not use Our name, logo, or trademarks to market Your software
product in which the Sample Code is embedded; (ii) to include a valid copyright notice on Your software product in which the
Sample Code is embedded; and (iii) to indemnify, hold harmless, and defend Us and Our suppliers from and against any claims or
lawsuits, including attorneys fees, that arise or result from the use or distribution of the Sample Code.
#>

cls

$host.Runspace.ThreadOptions = "ReuseThread"

Write-Host "STARTED at" (Get-Date).ToString() -f Green

$ClientID = "fa9737d5-5a3e-4fab-0000-000000000000"
$ClientSecret = "1JOe:M8HBBUz-0000000000000000000"
$scope= "https://graph.microsoft.com/.default"
$POSTURI =  "https://login.microsoftonline.com/d6f932a7-5f74-0000-0000-000000000000/oauth2/v2.0/token"

$body = @{grant_type="client_credentials";client_id=$ClientID;client_secret=$ClientSecret;scope=$scope}

$oauth = Invoke-RestMethod -Method Post -Uri $POSTURI -Body $body

$graphAccessToken = $oauth.access_token

Write-Host "Access token: $($graphAccessToken)"

$requestHeader = @{

  "Authorization" = "Bearer $graphAccessToken"
  "Content-Type" = "application/json"
  "Prefer" = "deltashowsharingchanges,hierarchicalsharing,deltatraversepermissiongaps,deltashowremovedasdeleted"
}

$Uri = "https://graph.microsoft.com/v1.0/sites/spotenant.sharepoint.com,df6ba610-b132-0000-0000-000000000000,e0dbcdc6-0637-4246-0000-000000000000/drive/root/delta?latest"

$Result = (Invoke-RestMethod -Method Get -Headers $requestheader -Uri $Uri)

$deltaUri = $Result.'@odata.deltaLink'

Write-Host $deltaUri
Write-Host "DONE at" (Get-Date).ToString() -f Green
3] Copy the Access token and the deltaUri value output from the above script and use them in the following sample powershell script to retrieve the complete set of permission changes:
<#
Code Example Disclaimer:
Sample Code is provided for the purpose of illustration only and is not intended to be used in a production environment.
THIS SAMPLE CODE AND ANY RELATED INFORMATION ARE PROVIDED "AS IS" WITHOUT WARRANTY OF ANY KIND, EITHER EXPRESSED OR IMPLIED,
INCLUDING BUT NOT LIMITED TO THE IMPLIED WARRANTIES OF MERCHANTABILITY AND/OR FITNESS FOR A PARTICULAR PURPOSE.
We grant You a nonexclusive, royalty-free right to use and modify the Sample Code and to reproduce and distribute the object
code form of the Sample Code, provided that. You agree: (i) to not use Our name, logo, or trademarks to market Your software
product in which the Sample Code is embedded; (ii) to include a valid copyright notice on Your software product in which the
Sample Code is embedded; and (iii) to indemnify, hold harmless, and defend Us and Our suppliers from and against any claims or
lawsuits, including attorneys fees, that arise or result from the use or distribution of the Sample Code.
#>

cls

$host.Runspace.ThreadOptions = "ReuseThread"

Write-Host "STARTED at" (Get-Date).ToString() -f Green

$graphAccessToken = "copied from output of above sample powershell script"

$requestHeader = @{
  "Authorization" = "Bearer $graphAccessToken"
  "Content-Type" = "application/json"
  "Prefer" = "deltashowsharingchanges,hierarchicalsharing"
}

Write-Host

$deltaUri = "copied from output of above sample powershell script" #should look like sample below:
https://graph.microsoft.com/v1.0/sites/spotenant.sharepoint.com,df6ba610-b132-4fc7-0000-000000000000,e0dbcdc6-0637-4246-0000-000000000000/drive/root/delta?token=MzslMjM0OyUyMzE7Mzs3NDlhZjc4NC0zOWU0LTRlOTEtYmJkNy0wNzI5MjAxNTNlMGY7NjM3MzM2NDU1MzMyNDcwMDAwOzMxOTY4OTE4MjslMjM7JTIzOyUyMzA"

$deltaResult = (Invoke-RestMethod -Method Get -Headers $requestheader -Uri $deltaUri)

Write-Host $deltaResult.value
Write-Host

Write-Host "DONE at" (Get-Date).ToString() -f Green
![[ANNOUNCEMENT] Productivity for Humans video series](https://www.drware.com/wp-content/uploads/2020/10/large-99)
by Contributed | Oct 2, 2020 | Uncategorized
This article is contributed. See the original author and article here.
Have you been struggling to stay productive during these challenging times? Looking for tools and solutions that will empower you to do better work while also improve your mental wellbeing? Watch our new “Productivity for Humans” video series to hear from everyday Humans of IT members about how they’re using M365 solutions to help them stay productive!
This series kicks off two extremely powerful personal stories:
-
Episode 1: Meet the Strant Family – In this episode, Megan and Loryan Strant, both MVPs and IT Professionals in Melbourne, Australia share about how their family uses M365 tools to help them stay productive while living with neurodiversity (ADHD, Asperger’s and Autism). Please click on the link to access the video.
 Episode 1: The Strant Family
-
Episode 2: Meet Jeff Stokes – In this episode, Jeff Stokes, an IT professional in Acworth, GA shares about how he uses M365 tools to stay productive despite living with permanent memory loss following a traumatic brain injury.
 Episode 2: Jeff Stokes
Want to be inspired by more Humans of IT-related video content? Be sure to keep an eye out for our new dedicated page in the Microsoft Virtual Hub (coming soon, by mid-Oct!) where you can get access to additional resources to help you navigate your personal human-centered productivity journey!
Do YOU use M365 tools and solutions to empower yourself or help your loved ones be more productive? Share your stories with us in the comments below, or apply to be a guest blogger on our Humans of IT blog!
We look forward to having you join us on a human-centered productivity journey.
#HumansofIT
#ProductivityforHumans
by Contributed | Oct 2, 2020 | Uncategorized
This article is contributed. See the original author and article here.
Pagination is important technique in SQL that enables you to return partial results of the query by specifying a range of rows that should be returned. It is commonly used when you need to get the partial results of the queries that return a large number of rows in the result in the pages with size, 10, 25, 50, or 100.
In this article you will see how to do pagination on large amount of data in Synapse SQL.
First let’s see some pagination methods in SQL language.
OFFSET/FETCH
T-SQL language has OFFSET/FETCH clause that enables you to skip some number of rows and take few of remaining (similar to TOP clause). An example of query with OFFSET/FETCH clause is shown in the following code:
SELECT *
       FROM dbo.Supplier AS data
ORDER BY data.S_SUPPKEY
OFFSET (@offset) ROWS
FETCH NEXT (@fetch) ROWS ONLY;
Unfortunately, this method is still not available in Synapse SQL.
TOP offset+fetch
To get the rows between @offset and @offset+@fetch, we can first select TOP @offset+@fetch records from query (for example TOP 110 records if the offset is 100 and fetch is 10), then get bottom @fetch records from that row set (for example rows between 100 and 110).
The query that can return rows between @offset and @offset+@fetch is shown in the following example:
SELECT *
FROM (
       SELECT TOP (@fetch) *
       FROM
              (SELECT TOP(@offset+@fetch) *
                      FROM dbo.Supplier
                      ORDER BY S_SUPPKEY ASC
              ) AS topFO
       ORDER BY S_SUPPKEY DESC
     ) AS bottomF
ORDER BY S_SUPPKEY ASC
Subquery topFO is a set of rows that contain top @offset+@fetch rows according to the desired sort criterion. Now we need to get @fetch bottom records by reverting the order of this rowset and getting TOP @fetch rows as bottomF subquery. Note that we don’t have BOTTOM operator in TSQL so we need to temporarily revert the sort order and get TOP rows in opposite direction. These are the rows that we need but now in the wrong sort order, so we need to change sort order again in the surrounding query.
It might be strange that you need to write a query that sorts results three times (I’m calling this Salto mortale technique), but we will not have big performance impact because second and third sort worn on the smaller amount of already sorted rows.
ROW_NUMBER window
ROW_NUMBER window function can return order number of the row in the rowset by specified sort criterion. We can use this info to return only the rows that have ROW_NUMBER in the range between @offset and @offset+@fetch:
SELECT TOP (@fetch) *
FROM
( SELECT ROW_NUMBER() OVER(ORDER BY S_SUPPKEY) AS RowNum, *
       FROM dbo.Supplier AS tr) AS data
WHERE @offset < RowNum
ORDER BY data.S_SUPPKEY
Inner sub-query will return rows with positions and outer query will filter them out.
Performance test
The important question what method we should choose to implement queries with pagination. I have created procedures that select and paginate rows from tables by specified criterion and return 10-row pages with offsets 30, 300, and 2000. I have executed these tests on dbo.Customer table from TPCH 1TB database with 150.000.000 rows. Using the following code:
declare @offset int = 10;
EXEC page_row_number 'dbo.Customer', 'C_CUSTKEY', @offset, 10
EXEC page_offset_fetch 'dbo.Customer', 'C_CUSTKEY', @offset, 10
EXEC page_salto_mortale 'dbo.Customer', 'C_CUSTKEY', @offset, 10

set @offset = 300;
EXEC page_salto_mortale 'dbo.Customer', 'C_CUSTKEY', @offset, 10
EXEC page_row_number 'dbo.Customer', 'C_CUSTKEY', @offset, 10
EXEC page_offset_fetch 'dbo.Customer', 'C_CUSTKEY', @offset, 10

set @offset = 5000;
EXEC page_offset_fetch 'dbo.Customer', 'C_CUSTKEY', @offset, 10
EXEC page_salto_mortale 'dbo.Customer', 'C_CUSTKEY', @offset, 10
EXEC page_row_number 'dbo.Customer', 'C_CUSTKEY', @offset, 10
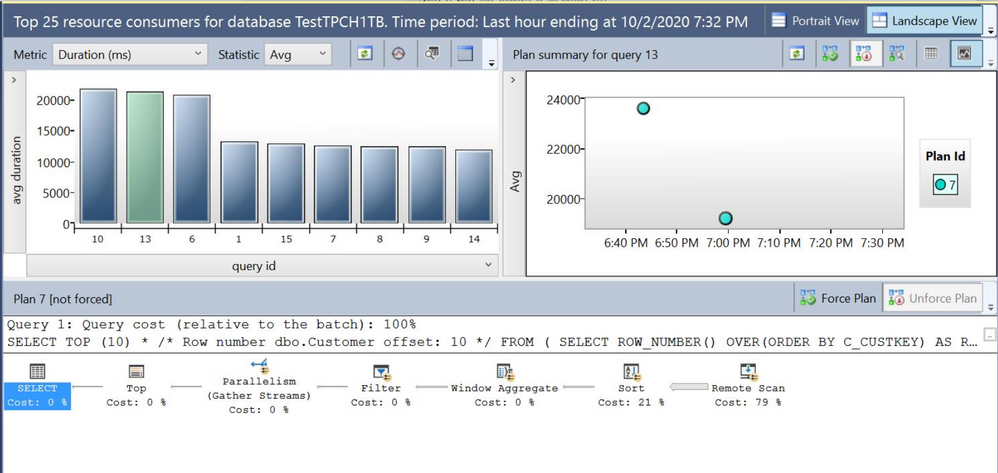
Since OFFSET/FETCH is still not available in Synapse SQL, I have run the test on Azure SQL Managed Instance and the results are displayed in the following Query Store UI:

First three results are ROW_NUMBER methods with offsets 10, 300, and 5000. It seems that this method provides worst results. Salto mortale (or TOP offset+fetch with switching order) seems providing even slightly better results than native OFFSET/FETCH but with minor perf difference.
I also double-checked the results using Query Performance Insights library and found average duration, execution count and spent CPU time for these queries:

The conclusions are:
- The best performance we are getting with TOP offset+fetch query (a.k.a. Salto mortale query), but similar perf we can expect with OFFSET/FETCH.
- Performance don’t depend on offset. Regardless of offset most of the time is probably spent on sorting entire data set to find what is the TOP offset+fetch rows in the desired sort order or position using ROW_NUMBER by desired sort order.
If you want to try this experiment, the code of the test procedures is below:
CREATE OR ALTER PROCEDURE page_row_number (@table varchar(200), @column sysname, @offset varchar(20), @fetch varchar(20))
AS BEGIN
       DECLARE @sql NVARCHAR(4000) = N'
       SELECT TOP (' + @fetch + ') * /* Row number ' + @table + ' offset: '+@offset+' */
       FROM
       ( SELECT ROW_NUMBER() OVER(ORDER BY ' + @column + ') AS RowNum, *
              FROM ' + @table + ' AS tr) AS data
       WHERE ' + @offset + ' < RowNum
       ORDER BY data.' + @column + '';

       EXEC sp_executesql @tsql = @sql;
END
GO
CREATE OR ALTER PROCEDURE page_offset_fetch (@table varchar(200), @column sysname, @offset varchar(20), @fetch varchar(20))
AS BEGIN
       DECLARE @sql NVARCHAR(4000) = N'
       SELECT * /* Offset fetch ' + @table + ' offset: '+@offset + ' */
              FROM ' + @table + ' AS data
       ORDER BY data.' + @column + '
       OFFSET ('+@offset+') ROWS
       FETCH NEXT ('+@fetch+') ROWS ONLY;';

       EXEC sp_executesql @tsql = @sql;
END
GO
CREATE OR ALTER PROCEDURE page_salto_mortale (@table varchar(200), @column sysname, @offset int, @fetch int)
AS BEGIN
       DECLARE @sql NVARCHAR(4000) = N'
       SELECT * /* Salto mortale ' + @table + ' offset: '+ CAST(@offset AS VARCHAR(20)) + '*/
       FROM (
              SELECT TOP ('+CAST(@fetch AS VARCHAR(20))+') *
              FROM
                      (SELECT TOP('+CAST( (@offset+@fetch) AS VARCHAR(20))+') *
                             FROM ' + @table + '
                             ORDER BY ' + @column + ' ASC) AS topFO
              ORDER BY ' + @column + ' DESC
       ) AS topF
       ORDER BY ' + @column + ' ASC';

       EXEC sp_executesql @tsql = @sql;
END

Recent Comments