This article is contributed. See the original author and article here.
Great Thanks to @Julian Gonzalez for working together on the playbooks templates!
In the previous article, Playbooks & Watchlists Part 1: Inform the subscription owner I have presented one scenario of using Watchlists in Playbooks. I also presented some best practices: how to query a watchlist using Azure Monitor Logs connector, and also how to use the output data.
In this blogpost I’ll present another interesting use case and some new ways to work with the Watchlists data.
Whitelisting is a strategy for allowing certain identities or sources to access sensitive resources or to exclude them from security protections. An example for such scenario can be a set of IP addresses which might trigger new alerts, but known to the SOC as coming from approved sources. In a case where a new alert consists only approved IPs as its entities, we might want to save the analysts time and auto close the incident.
Of course, more steps and actions can be taken and added to this playbook for other steps taken in this case by the SOC. Also, the same practice can be adopted for Blacklist scenarios.
Everytime a new alert of this analytic rule is created, the playbook is triggered, receiving the alert with the contained alerts as an input.
For each IP entity in this alert, the playbook queries the Watchlist includes it.
In case the IP is in the Watchlist, it will be added to “Safe IPs” array.
Else, it will be added to “Not Safe IPs” array.
A informative HTML comment will be written to the incident that contains this alert, to inform about the IPs in each category.
If all IPs were found safe, the incident will be closed with Benign Positive classification reason.
Prerequisites
A user or registered application with Azure Sentinel Contributor role to be used with the Azure Sentinel connector to Logic Apps.
Playbook steps explained
When a response to an Azure Sentinel alert is triggered
Azure Sentinel alert was created. The playbook receives the alert as the input.
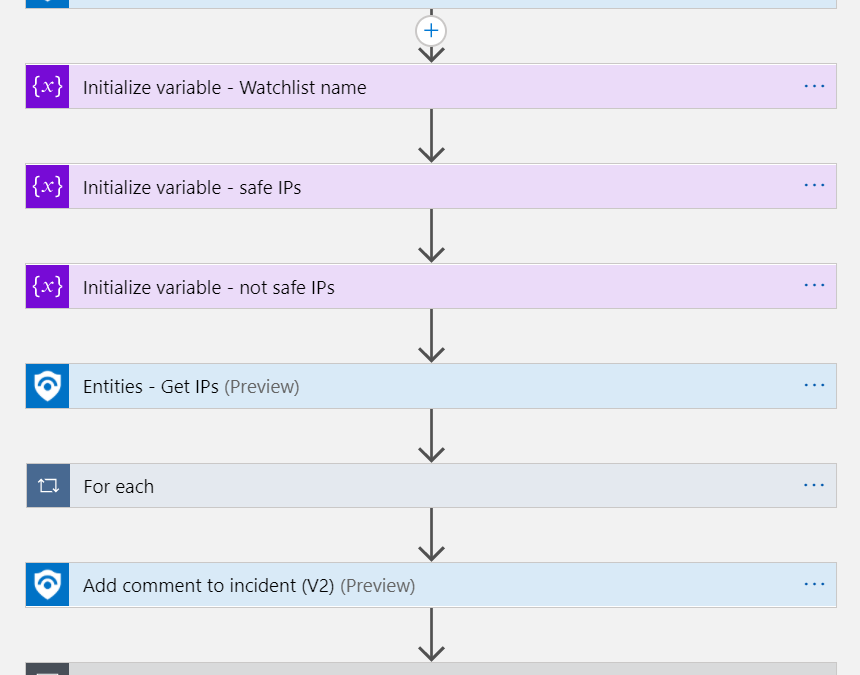
Initialize variables
This actions stores values to be used later in the playbook:
Watchlist name is a variable of type string, will be used for the Log Analytics query
Safe/not safe IPs are variables of type array, will be used to store the found IPs
Entities – Get IPs
This action takes all the entities found in the alert and parses only the IPs with their special fields ready to be used as dynamic values in later actions.
For Each IP
Iterates on the IPs found in this alert and performs the following:
Run query and list results – Get Watchlist In this step we ask Log Analytics (Azure Monitor Logs connector) to get the items of the Watchlist. Subscription, Resource Group and Resource Name are the Azure Sentinel workspace details where the watchlist is located. I used the following query: _GetWatchlist(@{variables(‘WatchlistName’)}) | extend IpAddress = tostring(parse_json(WatchlistItem).IpAddress) | where IpAddress == ”@{items(‘For_each’)?[‘Address’]}“
Condition In this step I check the length of the response array from the query, using the Logic apps expression length(collection). If it is greater then 0, we have found the IP in the watchlist. Therefor, we will add this IP to the Safe array; otherwise, to the not safe.
Add a comment to the incident In this step we audit the information collected so far: a list of safe IPs found in the Watchlist, a side to a list of unknown IPs.
Condition
Finally, we want to check if there is any IP which found as not safe. This step checks if our “not safe” array is empty. If so, we will close the incident.
Change Incident Status Closes the incident with Benign Positive classification reason.
Setup instructions
Create and Upload your watchlist
Create your input CSV table In this use case I have created a simple table, where each row represents an ip address. I created the table using Office 365 Excel, and then saved it as a CSV file (save as).
Upload your table
In Azure Sentinel, go to Watchlists.
Click on Add new
Fill in the required details. Note that the Alias will be used to query this watchlist in the playbook query step.
Add the CSV file
Review and create.
Playbook deployment instructions
Open the link to the playbook. Scroll down on the page and Click on “Deploy to Azure” or “Deploy to Azure Gov” button depending on your need.
Fill the parameters:
Basics Fill the subscription, resource group and location Sentinel workspace is under.
Settings
Playbook name – this is how you’ll find the playbook in your subscription
User name (will affect the names of the API connections resources)
Check the terms and conditions and click purchase.
The ARM template, contains the Logic App workflow (playbook) and API connections is now deploying to Azure. When finished, you will be taken to the Azure ARM Template summary page.
Click on the Logic Apps name. you will be taken to the Logic Apps resource of this playbook.
Confirm API connections
On the left menu, click on API connections. For each product being used in this playbook, click on the connection name – in our case, it is only the Azure Sentinel connection. Click on Authorize to log in with your user, and don’t forget to save.
This article is contributed. See the original author and article here.
Great thanks to @Julian Gonzalez for working together on these playbooks!
Azure Security Center alerts inform the SOC about possible security attacks occurred on resources In Azure. The SOC might not have permissions to the resources which potentially been compromised, and would need the resource owner during investigation of the alert to:
Ask if they are familiar with the detected activity that happened in their resource
Ask for taking mitigation steps on their resource.
For these reasons, SOC manually would need to find the relevant contact and reach them every time a new alert is created. This process can easily become automatic, using Azure Sentinel new Watchlists feature together with playbook.
In this blogpost we generalized the problem for simplicity reasons to Subscriptions owners level, but same solution can be implemented for any specific resource.
Note: This playbook requires Azure Sentinel Incident Trigger Private Preview. A very similar solution can be implemented by creating scheduled alerts over Azure Security Center alerts, and then use the Alert trigger which is public.
This blogpost includes:
Solution summary
Prerequisites
Azure Sentinel Flow
Playbook steps explained
Setup instructions
Create and upload your watchlist
ARM Template deployment
Playbook configurations
Set automated response
Documentation reference
Solution summary
An Azure Sentinel Watchlist maps each subscription in the organization with the owner and their contact email addresses.
Watchlists-InformSubowner-IncidentTrigger Playbook is attached to Azure Security Center Incident creation rule. Everytime a new Azure Security Center alert flows to Azure Sentinel, an Azure Sentinel incident is created. The playbook then triggered, receiving the incident with the contained alerts as an input.
The playbook queries the Watchlist and finds the relevant subscription owner details.
The subscription get a Teams message and email with all the details you want them to know about the potentially compromised resource.
A user or registered application with Azure Sentinel Contributor role to be used with the Azure Sentinel connector to Logic Apps.
Azure Security Center Incident Creation rule is enabled.
Private Preview of Azure Sentinel Incident Trigger.
A user to authenticate to Microsoft Teams.
A user to authenticate to Outlook.
Azure Sentinel flow
A new Azure Security Center flows to Azure Sentinel.
Azure Security Center Incident creation rule creates a new incident in Azure Sentinel.
Watchlists-InformSubOwnerAlert playbook is triggered
Playbook steps explained
When Azure Sentinel incident creation rule was triggered
Azure Sentinel incident was created. The playbook receives the incident as the input.
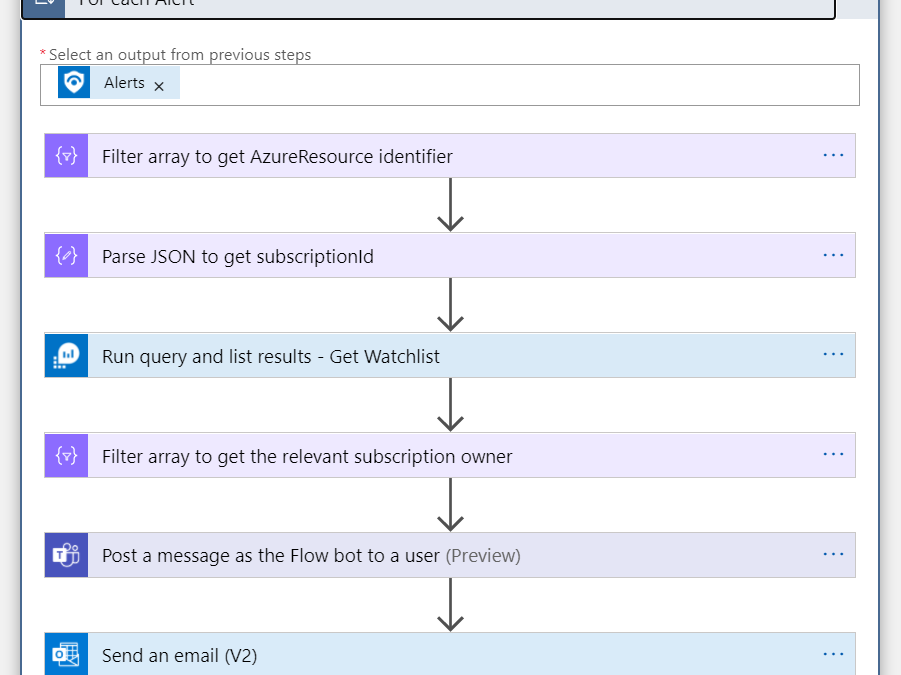
For Each Alert
Iterates on the alerts found in this incident (probably one) and performs the following:
Filter array to get AzureResource identifier
Azure Defender alert might have identifiers of two kinds:
– AzureResource (resourceid seen in LogAnalytics)
– LogAnalytics (information about the workspace storing the alerts).
This action result is an array of just the Azure Resource for later use.
Parse Json to get subscriptionId Get from the Additional Data of the ASC alert the subscription id.
Run query and list results – Get Watchlist In this step we ask Log Analytics (Azure Monitor Logs connector) to get the items of the Watchlist. Subscription, Resource Group and Resource Name are the Azure Sentinel workspace details where the watchlist is located. We specify in the project argument which fields are relevant for our use.
Filter array to get relevant subscription owners In this step we want to take the watchlists results and keep only ones that has the subscription we are looking for. The Logic Apps expression (the argument on the right) is:
Post a message as the flow bot to a user In this step we send a message in Microsoft Teams to the subscription owner with any details we want to share about the new alert.
Send an Email In this step we send a message in Office 365 Outlook to the subscription owner with any details we want to share about the new alert.
Setup instructions
Create and Upload your watchlist
Create your input CSV table In this use case I have created a simple table, where each row represents a subscription in my tenant. I have 4 columns: SubscriptionId, SubscriptionName, OwnerName, OwnerEmail. I created the table using Office 365 Excel, and then saved it as a CSV file (save as).
Upload your table
In Azure Sentinel, go to Watchlists.
Click on Add new
Fill in the required details. Note that the Alias will be used to query this watchlist in the playbook query step.
Add the CSV file
Review and create.
Playbook deployment instructions
Open the link to the playbook. Scroll down on the page and Click on “Deploy to Azure” or “Deploy to Azure Gov” button depending on your need.
Fill the parameters:
Basics Fill the subscription, resource group and location Sentinel workspace is under.
Settings
Playbook name – this is how you’ll find the playbook in your subscription
User name (will affect the names of the API connections resources)
Check the terms and conditions and click purchase.
The ARM template, contains the Logic App workflow (playbook) and API connections is now deploying to Azure. When finished, you will be taken to the Azure ARM Template summary page.
Click on the Logic Apps name. you will be taken to the Logic Apps resource of this playbook.
Confirm API connections
On the left menu, click on API connections. For each product being used in this playbook, click on the connection name. Click on Authorize to log in with your user, and don’t forget to save.
This article is contributed. See the original author and article here.
If you want to run a container, most of the customers I talk to, immediately think about Kubernetes – this is obviously a correct answer, but there are plenty of other options available on Azure. In this post I am providing a quick overview of all the options. Firstly, I start with the standalone container options followed by the container orchestration options.
Standalone Container
In this section I am going to explain the standalone container runtimes – while some of them could technically run multiple containers, the focus are mostly single instances of them.
Virtual Machine (VM)
Virtual Machines provide the greatest flexibility to run docker container. The 284 different (more are being added all the times!) combinations of CPU and RAM gives you the perfect platform to run one or more containers. On both windows and linux VMs you can install the docker runtime and you are ready – but – it’s a VM that you have to maintain and configure, I would only consider this work Dev/Test workloads simply because the operational efforts are too high.
Azure Container Instance (ACI)
Azure Container Instances are the exact opposite of the VM-based docker runtime: you provide the container; Azure will run it. If its one instance or a thousand does not really matter. The price depends on the number of vCPU and GBs of memory allocated per second – a serverless container runtime. This is ideal if you need to burst and simply do not know when the load is coming – prediction of the cost is sometimes a challenge if you can only work with estimates. You can even combine ACI with Azure Kubernetes Service to mix and match the workloads.
Azure App Service
Azure Web App for Containers – this is my personal hidden champion – you provide a container; App Service will run it. Ideal for web-based workloads because App Service is a web hosting platform. Deployment, scaling, and monitoring is already existing and can be utilized right out of the box.
Azure Batch
Batch compute and containers are a great combination – if the workload can be scaled across many batch jobs, you can put it in a container and scale it with Azure Batch. You can also leverage low priority VMs, great to reduce the cost.
Container Orchestration
Now to the more complex and sophisticated options to run a container – container orchestrators. Like a symphony, you need to coordinate multiple containers on multiple hosts to ‘play’ together – in the following I explain the options.
Azure Kubernetes Service (AKS)
The fully fledged, fully managed Kubernetes service on Azure – most of the dev teams I talk to appreciate that they can just consume the Kubernetes as a platform, but running and operating them is simply not something they want to do. So, with AKS, this is taken care of, you select the version of Kubernetes and a few minutes later you have your cluster – and then you can run your container symphony on it.
Azure Service Fabric
Azure Service Fabric is a distributed system platform and the core of Azure. It is more of the exotic ways to run a container, but it can run, scale and operate them.
Summary
If this would have been a quiz, could you name them all before reading this post? The many options make it sometimes a little harder to choose, but having flexibility and choice is always great if you have a particular problem.
This article is contributed. See the original author and article here.
September is certainly busy for the world’s serverless communities with the month beginning and ending with two distinct events to help developers maximise the power of serverless technologies.
First, the serverless communities of Auckland, Melbourne, Sydney and Perth came together to help plan and deliver Serverless Days ANZ. More than 40 speakers and 60 sessions were held on September 4 with Australian Office Apps & Business Apps MVP John Liu delivering the keynote address.
John reflected on how serverless technologies have changed the way developers code and how makers — non-professional developers — have also embraced the technology through Power Platform.
John had previously worked for two decades as an enterprise consultant, always dreaming of one day building his own SaaS product. In his talk — Building a Serverless Startup to manage Enterprise Serverless Solutions — John spoke about taking advantage of the serverless stack in his entrepreneurial endeavours.
“Today there are so many more components that we can integrate and plug into our systems,” John says. “Leveraging it all made so much sense when you need to build fast, test fast, and rebuild even faster.”
Four weeks later and it was time for Microsoft Create: Serverless. The half-day virtual event on September 30 connected experts and community members to discuss how to run code for any application without having to manage servers.
MVPs played an important role in the day, with MVP Marc Duiker co-hosting the session “Overcoming Serverless challenges with Durable Functions” and MVP Gwyneth Peña Siguenza co-hosting the day’s only workshop on the strategy needed to move an existing Express API app to serverless.
Gwenyth says the adoption and use of serverless technology in her region has been slow yet steady. Encouraging more developers to understand the advantages and manage the challenges of going serverless will require the community to partner up with providers to bring more attention to new technology, Sarah says.
“Including voices from people of all experience levels means we can provide examples of serverless solutions and challenges from all angles. Making content less about tech terminology and more about getting the idea across as concise and straightforward as possible,” she says. For more on Sarah, check out her Twitter @madebygps
The end of September and the arrival of October, however, did not mean the end of serverless community events. Azure Weekend 2020 Malaysia is a recurring weekend event from October 17 until the end of the year. Initially intended as a college tour throughout Malaysia, the event — much like everything else this year — migrated online.
Organizing team leader Shaw Chia — backed by fellow MVPs Eng Soon, Eng Teong, Marvin Heng, Kah Wai, Steve Young, Chester Chin — decided to bring the idea online as something similar to Global Azure Virtual 2020. Chia designed the program span out three months with a total of 10 sessions to cover the most trendy topics in cloud.
For more, check out the Serverless Days ANZ YouTube channel and the Microsft: Create Twitter @MicrosoftCreate
This article is contributed. See the original author and article here.
It has certainly been a busy few months for MVPs in Japan.
The Microsoft tech experts have been out in full force to support Microsoft Japan’s flagship event for developers, de:code, and bring to life supplemental events which further engage the community.
This year’s digital instalment of the annual conference consisted of 23,000 registrants, 100 on-demand technical sessions, and keynote sessions including a special message from Microsoft CEO Satya Nadella.
Additionally, the early summer conference saw plenty of support from Japanese MVPs. Six MVPs cooperated in the event as session speakers based on their deep knowledge of cutting-edge technologies like Azure Static Web Apps, Azure Sphere, and Power Platform. Meanwhile, 17 MVPs voluntarily joined as MVP Personal Sponsors to provide original sample code and tools to help conference participants better understand the session content.
AI MVP Yo**bleep**aka Seo took part in the conference as both personal sponsor and session speaker. The AI expert says the event’s liberating digital format enabled speakers like him to share their knowledge with as many participants as possible. “This experience gives me a hint for creating the appropriate content both for in-person and digital events in the future since this kind of hybrid format will be standard in the new normal,” Yo**bleep**aka says.
Windows Development MVP and conference personal sponsor Atomu Hidaka has been cooperating in this event since 2014 and says keeping others up-to-date with the latest technical updates is one of his “joys and missions” as an MVP.
Importantly, the conference was supported by an additional online community event series organized by Japanese MVPs, de:code Summer Fest. This online series shared recommendations of must-watch de:code sessions and community stories to more than 2,000 developers.
The four YouTube Live events from June to August sought to support the main conference with rich community-led content and fun learning experiences. For example, 26 speakers delivered 26 community-to-community sessions – with expertise from 14 MVPs and 12 Community Leaders – covering Azure, AI, Microsoft 365, Power Platform, Mixed Reality, and Developer Technologies. The de:code Summer Fest Committee was instrumental in developing the series to best appeal to attendees.
One of community core organizers and Azure MVP Kazumi Ohira says activating the tech community is important for the growth of all developers. One clear event highlight, Kazumi says, was the exciting developer experience offered through a live debugging of MS Tech Quiz. This enabled attendees to follow along with the workflow of event organizers as they investigated the issue and uncovered the solution to their own bug.
“We gained valuable experience during the event since I forgot to adjust our SignalR plan and debugged it live. Coincidentally, we were able to bring the quick response of our community leaders and the resourcefulness of Azure to the live event, and I hope we were able to deliver an interesting experience for attendees as well,” Kazumi says.
MVP Speaker and MS Quiz live debugger at de:code Summer Fest Tatsuro Shibamura says he enjoyed being able to show his skills in front of a virtual audience. “It was truly impressive in my community career that I shared my technical knowledge together with the famous Azure MVP/RD!” The feeling was mutual for Regional Director and Azure MVP Keiji Kamebuchi. “Even troubles that happened during the live event were enjoyable as we successfully demonstrated how to solve them by ourselves in the event,” he says.
Meanwhile, fellow community core organizer and Azure MVP Kazuyuki Miyake says he “fully enjoyed the fruitful online discussions with various Azure specialists who have different technical expertise.” Fellow community core organizers included Biz Apps MVP Ryota Nakamura and Windows Development MVP Shingo Mori.
This is a guest post by Obinna Ekwuno, software engineer at Gatsby and Marcy Sutton, freelance web developer and accessibility specialist. Read more about Obinna and Marcy at the end of this article. Accessibility has become a buzz word for making sure that disabled users get a fair experience when interfacing with platforms on the web or on mobile.
Use Microsoft Graph Toolkit to build a solution for Microsoft Teams that will track daily calendar, tasks and e-mails in a Teams Tab as one productivity hub. – OfficeDev/M365Bootcamp-TeamsOneProductivityHub
Mobile app development is both a huge opportunity and a constant challenge. In this talk we’ll look at the mobile development landscape – from native apps to multi-platform development and mobile web. We’ll talk about design challenges and personalizing user experiences to match diverse contexts. And we’ll look at emerging paradigms in dual-screen and multi-posture devices (e.g., Surface Duo) and talk about how we can leverage these technological advances to rethink the modern mobile app.
What is infrastructure as code? Microsoft Azure provides you with a number of options to deploy your infrastructure. In the One Dev Question series, Cloud Developer Advocate Abel Wang explains how Azure DevOps provides developer services to support teams to plan work…
Mark Simos, lead Cyber security architect for Microsoft, explored the lessons learned from protecting both Microsoft’s own technology environments and the responsibility we have to our customers, and shares the top 10 (+1!) recommendations for Azure security best practices.
The Azure Hybrid Benefit can help you save move when you are running your workloads within Azure by leveraging your on prem licenses, find out more in this blog post.
The Roguelike Celebration conference has been running for five years, but two weeks ago marks our fir… Tagged with streaming, events, conferences, twitch.
This post shows how to generate an SSL certificate through Let’s Encrypt API and bind the certificate to the custom APEX domain on Azure Functions app.
Lots to share in the world of Microsoft services this week. News includes Microsoft 365 Apps Admin Center’s new inventory & monthly servicing feature currently in preview, Azure Cognitive Services has achieved human parity in image captioning, Azure Site Recovery TLS Certificate Changes, Static Web App PR Workflow for Azure App Service using Azure DevOps, and of course the Microsoft Learn Module of the week.
You might have heard of Microsoft Teams, Outlook, or SharePoint. But did you know that next to being some of the most popular applications from Microsoft, they are a part of a highly extensible development platform with a rich partner ecosystem?
In this part, we will talk about ‘slow’ migrations.
Firstly, you should be aware that migration jobs to Exchange Online (which is a shared multi-tenancy environment) have a lower priority on our servers and are sometimes throttled to protect the health of the datacenter resources (server performance, disks, databases). Workloads like client connectivity and mail flow have a higher priority as they have direct impact on user functionality. Mailbox migration is not considered as vital because things like mailbox moves are online moves (functionality is not impacted and access to mailboxes is mostly uninterrupted). Please go through this article for more info.
Knowing all that, it is perfectly normal to sometimes see stalls on the Office 365 side during migrations.
The migration side that stalls could be called ‘stall side’ and it can be different for onboarding vs. offboarding migration. Quick refresher on this:
Onboarding: migrate from Exchange on-premises (source) to Exchange Online (target)
Offboarding: migrate from Exchange Online (source) to Exchange on-premises (target)
Migration directionality
Stall side
Stall message
Stalling environment
Onboarding
Source
StalledDueToSource_Reason
On-premises
Offboarding
Source
StalledDueToSource_Reason
Exchange Online
Onboarding
Target
StalledDueToTarget_Reason
Exchange Online
Offboarding
Target
StalledDueToTarget_Reason
On-premises
Here are some most frequent stalls is Office 365 with their explanations; the examples are for an onboarding move, where target is Exchange Online environment.
StalledDueToTarget_MdbAvailability: the move monitors replay queue of transactions logs into remote copies of databases. Migration stalls when the queue gets too big and will last until it drains.
StalledDueToTarget_MdbReplication: the move monitors the copy queue of transactions logs to other DAG member servers.
StalledDueToTarget_DiskLatency: happens when the disk latency is at a level where adding additional I/O might impact user experience on the disk where the target mailbox database (MDB) is located. Because of this, writes to the MDB are affected.
StalledDueToTarget_Processor: happens when CPU utilization gets too high on target MRS servers involved in the move.
StalledDueToTarget_BigFunnel: when content indexing operations experience a temporary interruption and are actively recovering.
Later on in this article, I will make you aware of two more interesting stalls: StalledDueToSource_UnknownReason and StalledDueToTarget_MailboxLock (these happen more often on the on-premises side) and the common causes for those stalls.
Are you saying that Exchange Online stalls are normal?
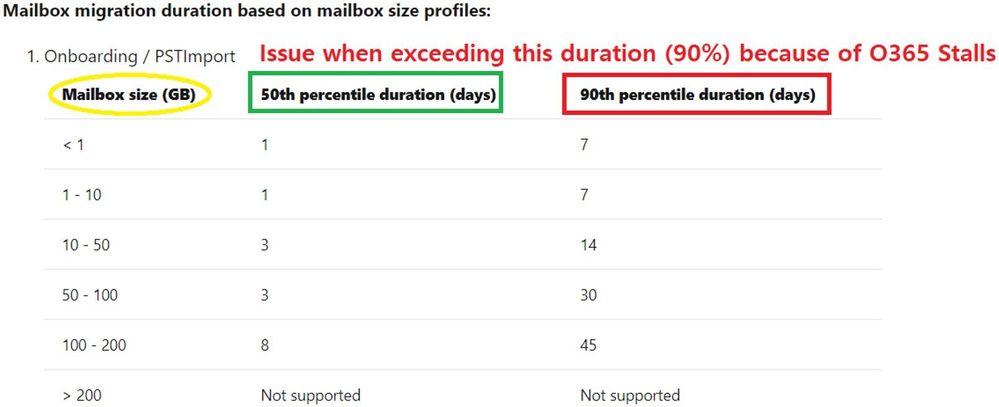
We consider stalls normal to some extent. We consider this being a problem only when you would exceed the 90th percentile from the Estimated Migration Times table and the major amount of stall time is spent waiting for the Office 365 side.
Consulting the table further, if an 45 GB on-premises mailbox hasn’t been migrated to Office 365 within 14 days since starting the migration, and the time is spent in StalledDueToTarget* (Office 365 being the target server in an onboarding scenario), then we will investigate and consider this a problem on our side because we have exceeded the estimated migration time.
Check the DiagnosticInfo section in that article in order to understand how to measure the stalls (on both sides).
You should also be aware that there are no throttling policies that can be adjusted for our Exchange hybrid customers to speed up hybrid migrations. Not for the tenant admin, and not for the Microsoft support. We simply do not have adjustable throttling policies for this type of migrations.
In contrast, for EWS migrations (these would be migrations using 3rd party tools), there is throttling in place on the Office 365 side (and this can be temporarily lifted for migration if necessary, by going to the the Need Help widget in the Microsoft 365 portal.) Native migration tools to Exchange Online do not use EWS.
I want to be perfectly clear on this:changing EWS throttling settings has nothing to do with hybrid (MRS based) migrations.
More information on the types of throttling for Exchange Online migrations, can be found here.
DiagnosticInfo switch when troubleshooting slow migrations
DiagnosticInfo can be useful in slow migrations scenarios because we would see duration, stalls and where the most time was spent. To check diagnostic information of a move, you would run commands in Exchange Online PowerShell:
Then, you would check the diagnostic information with this command:
$stats.DiagnosticInfo
In the output, check the XML tag called <Durations>
Here is a marked up screenshot from a move report for a completed move request:
This is for you to get a quick overview on these durations and how we are breaking down the duration:
Overall move: almost 10 days (9.23:54) – note that this particular move request has been completed 5 days ago and Get-MoveRequestStatistics does not actually count this time against the progress of the move.
Waiting: 8h, 29min
Stalled due to Target: ~7h, 30 min
Stalled due to MRS: 1h
InProgress: 4 days, 4h, 36 min
Initializing move: 2 days, 15h
Initial seeding: 1 day, 13h
Completed: 5 days, 10 h, 48 min
Injecting: a couple of seconds
In this example, stalls themselves are roughly 8-9 hours in total (which is not much) but ‘in progress duration’ is 4 days. Likely there were some issues and we don’t yet know what it was by just looking at the duration section. However, from a slowness perspective, the entire actual move didn’t take more than ~4 and a half days total. So even if the mailbox size was 1GB or less, it still didn’t exceed the minimum estimated time (remember the table from before?) In other words, this wouldn’t be a situation where you would need to ask us to investigate why the move is ‘slow’.
If checking the duration directly in PowerShell is difficult for you, you can copy-paste the duration XML tree to a Notepad++ file and set the language to XML. This way, you can get a better view and collapse the child elements as needed.
Here is another example:
Collapsing durations:
Expanding StalledDueToSource to get the highest stalled duration on source side:
Sometimes, the reason of a source stall is not explicit: StalledDueToSource_UnknownReason but DiagnosticInfo taken with verbose switch can be helpful to understand the actual reason of stall.
We sometimes get support cases with hybrid migrations in onboarding scenario which are stuck in completing or not progressing (they are stalled) because of some unknown reason on the source side (StalledDueToSource_UnknownReason). Most of those seem to be due to content indexing issues on the on-premises servers but there can also be other reasons as well. By just looking at “StalledDueToSource_UnknownReason” status, we know the stall is on the source side (in an onboarding move request, the source side is the on-premises environment), but unfortunately not all source versions pass stall information correctly to cloud MRS service. This is why it might not be mapped to a known resource and we might know which on-premises resource is causing the stall.
We can help narrow down the issue but cannot guarantee that Office 365 support can find the cause of the on-premises stall. If you have a support ticket on this, our colleagues from Exchange on-premises support team would likely be consulted to help.
From my experience, the most common reasons for these “unknown” stalls are:
Content Indexing health
CPU
High Availability Replication Health (not as common for onboarding)
From Exchange Online Powershell, you can store the move request statistics for the affected user in a powershell variable or export to an XML file (preferred way as you can send it to us as well):
You can then do the following in order to narrow down the issue:
import the xml from the path you saved it: $stats = import-clixml <path to MoveReqStatsUserX.xml>
look at the duration of stall with command: $stats |FL overall*, *total*, status*, *percent*, workload*
In the screenshot below we can see 7 days (D.mm:hh:ss) of stall due to unknown reason (ReadUnknown) out of the overall duration of almost 8 days:
Next, look at the diagnosticInfo and see if you find the root cause of the unknown stall, for example for a content Indexing issue, this looks like this:
$stats.diagnosticinfo […] <MessageStr>The remote server is unhealthy due to ‘Resource ‘CiAgeOfLastNotification(Mailbox Database 0365770178)’ is unhealthy and shouldn’t be accessed.’.</MessageStr> […]
Then on the on-premises servers, you can cross-check if there are issues with content indexing (CI) on mailbox databases (start with the mailbox database hosting the on-premises mailbox that is being migrated to EXO). In EMS, you could run Get-MailboxDatabaseCopyStatus cmdlet:
If the status for CI shows ‘not healthy’, you would need to fix the CI issue or move the on-premises mailboxes to a new database / different database where you wouldn’t have issues with CI. You can also try to reseed the catalog index.
If instead there are CPU issues, you would see something like this in DiagnosticInfo:
<MessageStr>The remote server is unhealthy due to ‘Resource ‘Processor’ is unhealthy and shouldn’t be accesssed’. </MessageStr>
A solution to this issue would be to add more CPU or bring in more migration servers. However, if the servers in question are only responsible for migrations, it may be safe to disable processor throttling for MRS. Note that if you have production mailboxes on this server, it is not recommended to disable processor throttling:
New-SettingOverride -Name DisableProcessorThrottling -Component WorkloadManagement -Section Processor -Parameters “Enabled&process:MSExchangeMailboxReplication=false” -Server <migration server name> -Reason “Disable Processor throttling for MRS migration”
NOTE: This workaround allows migration to use all the CPU it can. If you need CPU for other things, you should keep a close eye on CPU to ensure you don’t have an outage of some kind.
Another common type of stall encountered in the source on-premises environment is StalledDueToSource_MailboxLock. As you can read here, the mailbox lock is usually the consequence of a transient communication error between cloud MRS and on-premises MRSproxy (for example a network device in front of the Exchange server that times out). Exchange Online MRS will retry connection to on-premises to re-attempt migration for that specific user but since Exchange on-premises MRSProxy is unaware of the network interruption that just happened, it will not allow another move request for the same mailbox. This is the actual lock done by the MRSProxy on-premises and by default is 2 hours long (Windows Server setting). In this case, the recommendation is to reduce the default TCP Keep Alive time to 5 minutes to recover from those errors faster or fix the network / communication issue (especially if they are frequent).
Here is a quick visual of this:
There are 2 behaviors encountered when we deal with mailbox locks:
Leaked MRS proxy sessions (this is rare) – cause extended mailbox locked errors for more than the normal TCP keep-alive of 2 hours, often until MRS (Exchange 2013 or later) or the source mailbox store service (IS on Exchange 2010) is restarted. This error is not helped by modifying TCP keep-alive. You will just need to restart those Exchange on-premises services depending on the mailbox server version hosting the mailbox.
Ways to understand you are dealing with a leaked MRSProxy session:
You wait over 2 hours (assuming you have the default TCPKeepAliveTime on the Windows Server)
You remove the move request and you cannot re-inject the move or the move request fails immediately with the error “SourceMailboxAlreadyBeingMovedTransientException”
This would be the only error you would see in the recreated migration report (failures or internal failures) and no further advancement on the move.
$stats = Get-MoveRequestStatistics <user> -IncludeReport $stats.Report.InternalFailures | group FailureType $stats.Report.Failures | group FailureType
Transient errors during a move causing mailbox locked errors (very common) – during a move if there are transient failures (like timeouts or communication errors) the mailbox will remain locked for around the same time as the TCP keep-alive.
For this issue (frequent mailbox locks), lowering TCP keepalive time to 5 minutes is a known general recommendation and does in most cases allow you to recover from transient errors faster. Note that the TCP keep-alive setting doesn’t fix the timeout issue, if you see many of these timeouts or communication failures, priority is to eliminate these first.
Some general recommendations that can help with the timeout/communication errors:
Bypass network devices like load balancers, IDS, and reverse proxies in front of the Exchange MRSProxy Servers
Decrease MaxConcurrent* on the hybrid remote move migration endpoint(s), more on the migration concurrency settings you can find here
Improve server-side performance
Increase network bandwidth
Hybrid migration performance factors
The following list summarizes main performance factors impacting hybrid migrations:
Network performance
MRSProxy moves are dependent on the bandwidth available. We recommend piloting the MRS migration for an initial batch of production mailboxes (with real data in them) so that you can have an accurate estimation on how long the migration of a real end-user data will take. Keep in mind that for testing migration performance, you don’t really need to onboard these initial production mailboxes to Exchange Online if you don’t want to – you can just do the initial sync and choose manual completion of the batch without switching the mailboxes over to Office 365. We do recommend completing the migration for some users so that you can make sure the switchover is fine: the user is able to connect from both Outlook and OWA after migration or that the user objects have been converted successfully (on-premises mailbox converted to remote mailbox object and corresponding mail user in cloud converted to a mailbox). A small note here on the batch completion is that if you decide to complete migration for a subset of users from the batch and not all the users from the batch, you can do this by creating a new migration batch, reference here.
This script can help you understand what kind of throughput you can expect. You can also check the move request statistics Report.Entries for at least one hour span where we have a continuous copying activity (without failures / reconnections) and look at “Copy Progress” entry lines where we have the transfer size. For example, a 1 GB/ hour transfer rate is considered very good.
MRS can achieve a significant throughput boost by running multiple concurrent moves. For hybrid migrations, observed average throughput per hour was approximate 10-14 GB (20 concurrency). Note that these are averages.
If you are performing a hybrid migration through migration batches / migration endpoints, the maximum concurrent migrations at the tenant level is 300 by default (Office 365 multi-tenant environment) – you can see this property / value in Get-MigrationConfig in Exchange Online PowerShell. If you have published multiple MRSProxy endpoints, or if there are multiple MRS Proxy servers behind each endpoint, you can make a request to our support to increase the number of concurrent migrations based on the number of endpoints specified. This limit can be increased from default 300 up to 1000 (for example if you have 10 endpoints with default 100 migration concurrency). For more info on the migration concurrency topic (and why the higher value does not guarantee better migration throughput) read this.
A word of caution: when setting higher concurrent connections on Exchange Online migration endpoints, if your on-premises servers can’t support even the default migration concurrency (300) – you will get errors in the migrations reports that your on-premises servers are overloaded.
Also note that increasing migration concurrency in Exchange Online higher than our default limit (300) requires a valid business justification and understanding from your side that this action might generate excessive load on your Exchange migration (mailbox) servers and affect your production environment. This is not a ‘limitation’ of Exchange Online resource throttling, but a way that we try to ensure to protect our customers from overloading their servers inadvertently when migrating to Office 365.
The most common factor in the end-to-end network performance (from the data source to Exchange Online frontend servers) is on-premises network appliances that can affect migration performance significantly. For example, misconfigured load balancers like mentioned here or firewalls that don’t allow all Exchange Online IP connections will cause timeouts and communications errors during the move. These transient network failures add delays to the migration but can also cause extended mailbox locks and slow down the move considerably. Also, there are network devices that add delays through traffic inspection or connection throttling.
A large number of folders in the source mailbox, especially with a source latency higher than 300ms, will cause slow finalization. This means it can lock the migration user’s mailbox in the Final Sync stage for a (much) longer period than a couple of minutes. When MRS locks the source mailbox, it is inaccessible to the end-user being migrated. That is why most administrators prefer to complete the migrations and switch over from on-premises to cloud outside of working hours. When this happens, user will see in OWA a MailboxInTransit Exception and admin will see Test-MapiConnectivity failed for that user in Exchange shell. However, in most cases, the migration can be seamless for the end-user; they can experience a short disconnection in OWA during completion of the migration and Outlook will eventually prompt them to restart due to changes made.
In the finalization phase, the majority of the time that a mailbox is locked is spent in content verification to ensure that all data on the source really is on the target. This is a defense-in-depth check to guard against issues and, for most mailboxes, is pretty quick. Total lock time of onboarding mailboxes at 90th percentile is ~2 mins. However, the verification scales linearly with folder count and on a high latency connection (~0.5s for a ping round trip) a mailbox with 10,000 folders will be locked for roughly 2 hours.
So, if you can see a high ping latency and you know the mailbox has thousands of folders, one option is to turn off this content verification. The chances of data loss are actually small (but this is a protection against issues and an extra step to ensure things are ok). The recommended way is to reduce network latency on the source side, reduce the number of folders or you can try skipping the mailbox content verification process in the final sync stage.
Get the mailbox folder counts in the on-premises EMS:
Note that for Exchange 2010 source servers, the parameter NonIpmRoot is not available, with FolderScope All, you would still get only the IPM Root folders. However, most of the time this might be enough to get an estimate of the number of folders present in the mailbox. You can also use MFCMAPI to get an overview of the NonIPMRoot folders present in the Exchange 2010 mailbox.
$stats = Get-MoveRequestStatistics <user> -IncludeReport $stats.Report.SessionStatistics.SourceLatencyInfo.Average (recommended maximum 300ms)
As already mentioned, we recommend the following action with care (best under guidance of our support team):
Best would be to fix the source network latency which is commonly caused by on-premised network devices in front of the Exchange servers. You can try to temporarily bypass your reverse proxy or load balancer and see if you still have high final sync times that can lock the source mailbox for long periods of time. If this is not feasible, you can then try to skip the content verification above, as a quick workaround.
On-premises server performance
As data is being pulled from current mailbox servers (migration servers), if those servers are exhibiting performance problems independent of the mailbox moves (like CPU or disk performance issues) – the result is not going to be good. Placing more load on already overloaded servers is not a Good Thing!
Source mailbox content
The mix of items in the source mailbox will have an effect on migration performance. Item count is very important. A mailbox with a few large items will move faster than a mailbox with a large number of small items. For example, a 4 GB mailbox with 400 items, each with 10 MB attachments, will migrate faster than a 4 GB mailbox with 100,000 smaller items (even if total size might be similar). Therefore, at least in migration performance, the item count can matter more than the the size of items.
As already mentioned, a high count of folders in the source mailbox (for example 2,000 mailbox folders) can be a problem when we deal with high source network latency.
Stalls on the Exchange on-premises side vs. Exchange Online side
Other than the stalls discussed in the beginning of this blog post (stalls related to Content Indexing, CPU etc.), another relatively frequently seen stall is StalledDueToSource_EndpointCapacityExceeded (seen in onboarding scenario). This can happen when the cloud migration endpoint’s MaxConcurrentMigrations and MaxConcurrentIncrementalSyncs are set by default to a lower number (for example, MaxConcurrentMigrations 20 and MaxConcurrentIncrementalSyncs 10) when compared to the MRSProxy Maximum Connections allowed on-premises (for example 100) and you are migrating, for example, 130 mailboxes simultaneously.
Note that a lower value on MaxConcurrent* is not actually a bad thing, This is designed to not overwhelm your migration server and is something that gives you complete control over the concurrency to tune your migration performance.
To adjust the migration endpoint max concurrency (in Exchange Online PowerShell) for the example mentioned above:
Additionally, please check this Migration Performance Analyzer and make note of the results. Performance issues can happen due to a wide variety of factors discussed above, like network latency or on-premises servers performance.
This concludes Part 4 of this blog post series. We will talk about ‘Completed with warnings’ next!
Special thanks to my favorite ‘Migration People’ that helped with reviewing this: Angus Leeming, William Rall, Brad Hughes, Chris Boonham, Ben Winzenz, Cristian Dimofte, Nicu Simion, Nino Bilic, Timothy Heeney.
This article is contributed. See the original author and article here.
Quantum computing is one of our bleeding-edge technologies.
Governments and private investors all around the world are pouring billions of dollars into quantum research and development, leading commentators to believe we may now be on the brink of a second quantum revolution as humans attempt to harness even more of the power of the quantum world.
It is an exciting, heady topic – and thankfully there are MVPs at the fore in making sure developers around the world have a better understanding of the powers of quantum computing and how it can change the way we solve problems.
Developer Technologies MVP Dr. Sarah Kaiser has spent much of her career developing new quantum hardware in the lab, from satellites to hacking quantum cryptography hardware.
Communicating what is so exciting about quantum is her passion, Sarah says, and she loves finding new demos and tools to help enable the quantum community to grow.
“From the academic side of quantum computing, there is also a lot of gatekeeping of ‘you must have this degree’ to be able to participate in projects,” Sarah says. “While I’m privileged enough to have a PhD in quantum computing, I want to bring folks together to show them that quantum computing is likely not as hard as they thought it to be, and help connect and support people working on open source projects so they can learn and grow together.”
Sarah, an avid author and Twitch streamer, says her journey as a developer was nurtured by participating in user groups like PyLadies and RLadies, where she could listen to talks by people who looked like her. So, Sarah looks to create that same environment for other developers who want to get into quantum computing through Twitch content like #QuantumDevelopWithMe.
Leading conversations on quantum computing and supporting the community through resources is a similar passion for Data Platform MVP Andy Leonard. Andy is co-host of the podcast Data Driven along with Microsoft FTE Frank La Vigne. The pair decided in August, however, that the rapid development of quantum computing deserved its own, additional podcast: Impact Quantum: A Podcast For Engineers.
“The QC field is new and growing,” Andy says. “Breakthroughs are happening regularly, but reporting of breakthroughs is inconsistent and often performed by people who are fantastic at delivering news but inexperienced with technology.”
The evolution of quantum will only be accelerated by this ongoing pandemic, Andy says, noting that it is important to share resources on the topic with developers today to thrive tomorrow.
“Almost everything I know today I learned from others. I read books, articles, and blog posts. I have paid for training and I have attended free training. I love learning, and I love sharing knowledge to help others learn,” he says.
“A part of the digital transformation that will occur over the next decade will, no doubt, include quantum computing. Quantum computing will open up opportunities and job roles that we cannot yet even imagine.”
This article is contributed. See the original author and article here.
Oftentimes data scientists and other users working on smaller data sets in Azure Databricks explore data and build machine learning (ML) models using single-machine python and R libraries. This exploration and modeling doesn’t always require the distributed computing power of the Delta Engine and Apache Spark offered in Azure Databricks. Doing this type of work on a traditional multi-node cluster often results in wasted/underutilized compute resources on worker machines which results in unnecessary cost.
Single Node clusters is a new cluster mode that allows users to use their favorite libraries like Pandas, Scikit-learn, PyTorch, etc. without wasting unnecessary compute/cost associated with traditional multi-node clusters. Single Node clusters also support running Spark operations if needed, where the single node will host both the driver and executors spread across the available cores on the node. This provides the ability to load and save data using the efficient Spark APIs (with security features such as User Credential Passthrough) and also doing efficient exploration and ML using the most popular single-machine libraries.
If/when a data scientist wants to use distributed compute to do things like hyperparameter tuning and AutoML or work with larger datasets, they can simply switch over to a standard cluster with more nodes.
When the Single Node capability is combined with other capabilities like:
This article is contributed. See the original author and article here.
When API Management is with internal Virtual Network, the connection to this API Management will be blocked from outside.To be able to call the API or visit the developer portal of such API Management, Application Gateway will be a good choice for you.
By using Application Gateway, the request sent to API Management will be automatically routed. And the Application Gateway can also help user to monitor whether the API Management is still in a healthy status.
Pre-requirements:
Before starting, you must setup the environment at first.
To set up a local development environment, you need to have:
Configure the API Management instance with internal Virtual Network. If you don’t know how, please follow this tutorial.
A usable domain name
Some SSL certificates of above domain name. It’s no matter self-signed or not. If we need to self-sign one, please use following scripts in PowerShell command line and remember to replace the domain name and output path as you want.
An Application Gateway with Tier WAF or Standard. Please follow this documentto create.
The Network Security Group added on the subnet where API Management is. Follow this postto create this Network Security Group and add the security rule as mentioned here.
Some points to explain before starting:
The custom domain setting in API Management can be customized by yourself. In this example, the used domain names are as following:
apimnewportal.minalinsky.top for new developer portal endpoint
apimlegacyportal.minalinsky.top for legacy developer portal endpoint
apimmanagement.minalinsky.top for management endpoint
apimgateway.minalinsky.top for proxy endpoint
In this example, the purpose is to build an environment for visiting the developer portal and calling API from outside of Virtual Network. If you also want to do this from the inside of Virtual Network, here are two options:
Follow this document to build an custom DNS zone to resolve the API Management custom domain
Follow this document to create a Azure Virtual Machine with Windows Server 2019 as operation system and follow this article to configure custom DNS server by yourself. Then modify the custom DNS setting in Virtual Network page in Azure Portal with the private IP address of the created Virtual Machine.
Steps to implement:
Once you are done with the above preparations, you can follow these steps to link the API Management with Application Gateway. Please remember that if you want to be able to visit the new developer portal of the API Management, you’ll also need to enable the new developer portal endpoint and management endpoint at the same time. This is due to the design of the new developer portal. (In this example, we’reusing HTTPS protocol because the HTTP protocol setting is almost the same only without some certificate configuration.)
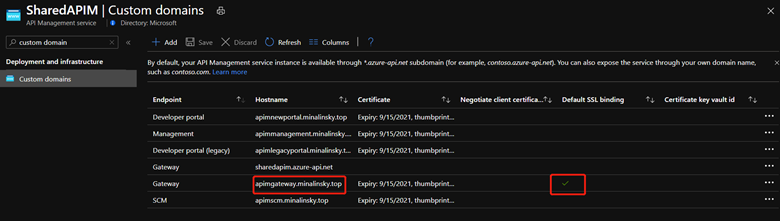
Follow this tutorialto configure the custom domain of the endpoints which you want to visit from outside of Virtual Network. And pay attention to which endpoint is marked as Default SSL binding. This is important in the later steps. It’s normally recommended to use the gateway endpoint as theDefault SSL binding one.
API Management custom domain setting
For the Network Security Group which is used on the subnet where Application Gateway is deployed, add an inbound security rule with following parameters:
Port: 443, 65503-65534 (If with HTTP protocol, also open 80 port here)
Protocol: Any
Source: Internet
Destination: VirtualNetwork
Action: Allow
In Application Gateway, create a new backend pool. And in the backend targets part, create a new backend target with the private IP address of our API Management.
API Management overview page – private IPApplication Gateway page – Backend pool labelApplication Gateway backend pool setting
4. Then, create one Health probe for each API Management endpoint which you want to visit. Put your own custom domain name in the Host part, fill the Path part as following table and configure the other configuration as you want. The detailed information about how Application Gateway health probe is working can be found in our official document.
Gateway endpoint: /status-0123456789abcdef
New developer portal endpoint: /signin
Legacy developer portal endpoint: /signin
Management endpoint: /servicestatus
The following is an example health probe of legacy developer portal endpoint.
Application Gateway page – Health Probe labelApplication Gateway Health Probe setting
Next step is to create one listener for every API Management endpoint. With HTTPS protocol, you’ll be requiredto upload the certificate. The certificate here must match the certificate used in API Management custom domain configuration of the same endpoint. If we are creating a listener for the management endpoint, we cannot upload the certificate of the other three endpoints.
In Additional settings, choose Multi site as listener type and input your own custom domain URL configured in API Management.
The detailed information about how Application Gateway listener is working can be found in our official document.
Here is an example listener configuration of legacy developer portal endpoint.
6. It’s time to configure the most important thing, the HTTP settings. In Application Gateway, you’ll also need to create one HTTP setting for each endpoint of API Management. For HTTPS protocol, you’ll be asked to upload the certificate again as the previous step. But here, please upload the certificate used in the custom domain configuration of API Management of the Default SSL Binding one. For the HTTP settings of all endpoints, the uploaded and used certificate will be always the same one! In the Host name part, select Override with specific domain name and input your own custom domain. Then select the health probe which you created in step 4 for Custom probe option. Here is an example HTTP setting of the gateway endpoint. About how the HTTP setting is working in Application Gateway, we can learn more from here.
Application Gateway page – Http Settings label
Application Gateway Http Settings page
Application Gateway Http Setting page 2
7. When you’ve finished above steps, you need to create one Rule in Application Gateway for each API Management endpoint. It’s quite easy. You only need to select the created Listener, Backend pool and HTTP setting together. Here is an example rule of my new developer portal endpoint:
Application Gateway page – Rules label
Application Gateway Rules page
Application Gateway Rules page 2
8. Here we need to take a break and check whether the previous steps are good. If everything is going well, when we click the Backend Health blade in Azure Portal, we’ll be able to see that the backend server is healthy as:
Application Gateway page – Backend Health label
Application Gateway Backend Health page
9. Finally, the last step is to make a CNAME record in your own domain DNS setting. In the overview page of Application Gateway, you’ll be able to find a domain name like somethinglikeid.cloudapp.net. Please create a CNAME record of the custom domain which you configured in API Management custom domain part and in Application Gateway to this domain name ending with cloudapp.net. Once it’s active, we should be able to visit our API Management from outside of Virtual Network. Here is the example DNS setting:
Custom domain DNS setting
Common problems when using Application Gateway with API Management:
When you use the Application Gateway with API Management, you maybe will meet some common issues like being unable to visit developer portal or the request sent to API Management or developer portal returns error code such as 502, 503 etc.Here is a summary of the common problems and possible solution. If this cannot resolve the issue, please create support ticket and our technical support engineer will be glad to assist.
When trying to call API or visit developer portal, 502 error code is returned.
For this scenario, there are 4 possible common reasons:
a. The backend health status is not healthy in Application Gateway Backend Health page (step 8 in previous part).
Solution:
1. Check the Network Security Group configuration to make sure that all necessary ports are open.
2. Create a Virtual Machine in the same Virtual Network and visit the developer portal or call API from Virtual Machine to verify the API Management corresponding endpoint is healthy.
b. The certificate uploaded in HTTP settings in Application Gateway doesn’t match the certificate used in the custom domain configuration in API Management.
Solution:
Upload the correct matching certificate in HTTP settings in Application Gateway. (Step 6 in previous part)
c. The timeout setting of HTTP settings in Application Gateway is too short.
Solution:
Reset the timeout setting of HTTP settings in Application Gateway (Step 6 in previous part)
d. The certificate used in Application Gateway or API Management expires.
Solution:
Update both the timeout setting in API Management and Application Gateway
2. When trying to call API or visit developer portal, 503 error code is returned.
For this scenario, there is 1 possible common reason:
The custom domain name used in Application Gateway configuration and API Management custom domain configuration doesn’t match.
Solution:
Reconfigure the setting to make sure that the 2 custom domain names are the same one.
3. When trying to visit new developer portal from Azure Portal “Overview” blade, the developer portal doesn’t open and show following message:
Unable to start the portal
Check if the settings specified in the configuration file config.design.json are correct or refer to the frequently asked questions
For this scenario, there is 1 possible common reason but we need one more step to verify whether it’s this situation:
Follow this document to capture the browser trace when opening developer portal and check whether there is a failed call to https://<management-endpoint-hostman>/subscriptions/xxx/resourceGroups/xxx/providers/Microsoft.ApiManagement/service/xxx/contentTypes/document/contentItems/configuration?api-version=2018-06-01-preview
If it’s true that there is such a failed call, then the reason is that user only enables the new developer portal endpoint in Application Gateway but doesn’t enable the management endpoint.
Solution:
Follow this blog to enable the management endpoint in Application Gateway.
4. When trying to visit new developer portal, the developer portal doesn’t open and show following message:
Oops, something went wrong. We are unable to complete your operation this time. Please try again later.
For this scenario, there is 1 possible common reason but we need one more step to verify whether it’s this situation:
Follow this document to capture the browser trace when opening developer portal and check whether there is a failed call to https://<management-endpoint-hostman>/subscriptions/xxx/resourceGroups/xxx/providers/Microsoft.ApiManagement/service/xxx/contentTypes/document/contentItems?$orderby=en_us/title&$filter=en_us/permalink%20eq%20%27/%27&api-version=2018-06-01-preview with 403 error code
If it’s true that there is such a failed call, then the reason is that the Application Gateway Web Application Firewall is enabled in Prevention mode and this WAF blocked the requests.
Solution:
Change the configuration of Application Gateway WAF to disable the following rules:


Recent Comments