by Contributed | Feb 11, 2021 | Technology
This article is contributed. See the original author and article here.
Hello Folks!
Not so long ago I was working on an internal project that required me to deploy Linux VMs that were hosting a workload that saved a copy of any number of video live feeds to blob storage for safeguard and for future replays. I also needed it to be mounted automatically when the VM was created.
I know that are several ways to map storage in a VM. You can:
- How to mount an NFS file share
- Use Azure Files with Linux over SMB
- How to mount Blob storage as a file system with blobfuse
- Mount Blob storage by using the Network File System (NFS) 3.0 protocol (preview)
I decided to give the NFS path a try.
Why NFS you may ask?
I’m not sure… Could be because NFSv3 provides compatibility for existing applications, could be because of the scale it can support or maybe just because it’s cost effective and easy to setup.
In any case, I followed the documentation here to create the virtual network, service endpoint to ensure that the storage account can only be accessed from the appropriate vnet and subnet, and the storage account.
To automate this at the time of deployment I added the following few lines to the Custom Script Extention script i use to deploy the workload on a new VM at deployment time.
apt update
apt install nfs-common -y
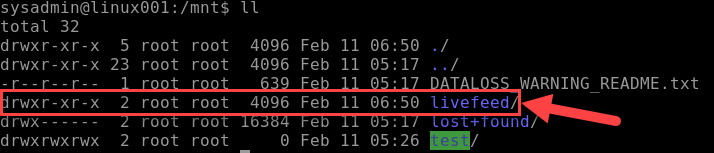
mkdir -p /mnt/livefeed
mount -o sec=sys,vers=3,nolock,proto=tcp <storage-account-name>.blob.core.windows.net:/<storage-account-name>/<container-name> /mnt/livefeed
This worked great!
Except that the workload on the VM could not write to the blob storage. I realized that when the custom Script extension creates the folder livefeed in /mnt it’s done by the Azure Agent user context (Root) and therefore the permissions on that folder
Only provide read write to Root. For my test I added the following line to the end of my script, and it worked like a charme.
chmod 777 /mnt/livefeed

I do Not promote giving all rights to all users in a production environment.
My next step is to create a group that include the user context which the workload in running under and change the permissions so only the account needed have write access.
I really believe in the Least-Privilege Administrative Models when it comes to any environments (On-Prem, Hybrid and cloud native).
In any case, I hope this may give you some ideas on how you can leverage Azure services to address problems in your environment.
Cheers!
Pierre
by Contributed | Feb 10, 2021 | Technology
This article is contributed. See the original author and article here.
First published on TECHNET on Mar 18, 2019
Authored by Brandon McMillan
Hello everyone! My name is Brandon McMillan and I am a Microsoft Endpoint Configuration Manager (ConfigMgr) CE. I have found that Status Message Queries can be one of the more underappreciated features of ConfigMgr. The information you can gather in a quick and easy query can be very powerful in helping you determine the root cause analysis of an issue. I hope this blog will provide you with additional Status Message Queries and how you can quickly export/import some examples into your environment.
First let’s break down the different Status Message Types:
ID
|
Status Message Type
|
Description
|
256
|
Milestones
|
Use this type at the end of an operation to indicate the operation’s success or failure. If the operation was successful, use the Milestone type in an informational message. If the operation failed, use a milestone message type in a warning or error message.
|
512
|
Details
|
Use this type to illustrate the steps in a complex operation. Often, detail messages are meaningful only within the context of the sequence of status messages representing a complex operation.
|
768
|
Audits
|
Use this type for informational messages that provides a trail of actions taken by the Configuration Manager administrator. An audit message also depicts an operation that results in objects being added, modified, or deleted. You do not need to create audit messages; the provider automatically generates these messages for you.
|
1024
|
NT Events
|
|
Reference: SMS_StatusMessage WMI Class
Here is a quick overview of Status Message Queries:
Status Message Queries
|
Use this node to query status messages for specific events and related details. You can use status message queries to find the status messages related to specific events.
You can often use status message queries to identify when a specific component, operation, or Configuration Manager object was modified, and the account that was used to make the modification. For example, you can run the built-in query for Collections Created, Modified, or Deleted to identify when a specific collection was created, and the user account used to create the collection.
|
Reference: Use Alerts and the Status System
Enumerating Status Message Strings
How can we obtain a full listing of Status Message ID’s? If you are unsure what Status Message ID’s to use to create a specific Status Message Query, you can export all the Status Messages ConfigMgr provides by using a PowerShell script from an article by SaudM . The script and an example of an excel output from a ConfigMgr 2012 R2 environment can be found here: Enumerate Status Messages.
Here’s an example of how you can leverage the script and export the Status Messages based on type: Client, Provider, or Server Messages.
Client Messages
.Export-StatusMessages.ps1 -stringPathToDLL "<InstallDrive>:Program FilesMicrosoft Configuration ManagerbinX64system32smsmsgsclimsgs.dll" -stringOutputCSV ExportClientMsgs.csv
Provider Messages
.Export-StatusMessages.ps1 -stringPathToDLL "<InstallDrive>:Program FilesMicrosoft Configuration ManagerbinX64system32smsmsgsprovmsgs.dll" -stringOutputCSV ExportProviderMsgs.csv
Server Messages
.Export-StatusMessages.ps1 -stringPathToDLL "<InstallDrive>:Program FilesMicrosoft Configuration ManagerbinX64system32smsmsgssrvmsgs.dll" -stringOutputCSV ExportServerMsgs.csv
Default Status Message Queries
We provide many out of box queries that are delivered with the product; however, there are many Message ID’s that you can leverage which could help you build your own specific queries for your environment. Some of the default Status Message Queries you may already be familiar with are below:
Query Title |
Query Details |
All Audit Status Messages for a Specific User |
Message Type: 768
Message Attribute ID: 403 |
All Audit Status Messages from a Specific Site |
Message Type: 768 |
Boundaries Created, Modified, or Deleted |
Message IDs: 40600-40602 |
Client Component Configuration Changes |
Message IDs: 30042-30047 |
Collections Created, Modified, or Deleted |
Message IDs: 30015-30017 |
Collection Member Resources Manually Deleted |
Message IDs: 30066-30067 |
Deployments Created, Modified, or Deleted |
Message IDs: 30006-30008 |
Packages Created, Modified, or Deleted |
Includes Package Conversion Status
Message IDs: 30000-30002 |
Programs Created, Modified, or Deleted |
Includes Package Conversion Status
Message IDs: 30003-30005 |
Queries Created, Modified, or Deleted |
Message IDs: 30063-30065 |
Remote Control Activity at a Specific Site, User, or System (4 Total) |
Message IDs: 30069-30087 |
Security Scopes Created, Modified, Deleted, or Imported |
Message IDs: 31200-31202 / 31220-31222 / 31207 |
Server Component Configuration Changes |
Message IDs: 30033-30035 / 30039-30041
Site Control Changes |
Site Addresses Created, Modified, or Deleted |
Message IDs: 30018-30020 |
Enhanced Audit Status Message Queries
Now what if you need something more specific? The following list may help you quickly determine what specific activities are occurring within your environment. You can download the XML file and script resources here on GitHub: Enhanced Audit Status Message Queries.
Query Title |
Query Details |
Audit – All Alert Actions |
Includes DRS Alerts
Message IDs: 30240-30244 |
Audit – All Application Actions |
Message IDs: 30226-30228 / 49003-49005 / 52300 |
Audit – All Application Catalog Actions |
Message IDs: 30800-30805 / 50000-50004 |
Audit – All Asset Intelligence Actions |
Message IDs: 30208-30209 / 31001 |
Audit – All Azure and Co-Management Actions |
Message IDs: 53001-53005 / 53401-53403 / 53501-53503 |
Audit – All Boundary Group Actions |
Message IDs: 40500-40505 |
Audit – All Client and Collection Miscellaneous Actions |
Includes Update Membership, Device Imports, Clear PXE Deployments
Message IDs: 30104 / 30213 / 42021 |
Audit – All Client Configuration Requests (CCRs) |
Client Push actions.
Message IDs: 30106-30111 |
Audit – All Client Operations Actions |
Includes “Right Click” actions.
Message IDs: 40800-40804 |
Audit – All Client Settings Actions |
Includes Antimalware Policies.
Message IDs: 40300-40305 |
Audit – All CMPivot and Script Actions |
Message IDs: 40805-40806 / 52500-52505 |
Audit – All Conditional Access Actions |
Includes Exchange Online, SharePoint Online, and On-Prem Exchange actions.
Message IDs: 30340-30341 |
Audit – All ConfigMgr Actions in Console |
Checks components: Microsoft.ConfigurationManagement.exe / AdminUI.PS.Provider.dll |
Audit – All Configuration Baseline Actions |
Message IDs: 30168 / 30193-30198 |
Audit – All Configuration Items |
Includes Compliance Settings and Endpoint Protection policy actions.
Message IDs: 30152-30167 |
Audit – All Content Library Actions |
Includes Content Library changes
Message IDs: 30080 / 30189-30191 |
Audit – All Distribution Point Actions |
Message IDs: 30009-30011 / 30068 / 30109 / 30125 / 30500-30503 / 40409-40410 |
Audit – All Distribution Point Changes |
Message IDs: 40400-40409 / 40506 |
Audit – All Folder Actions |
Message IDs: 30113-30117 |
Audit – All Messages |
|
Audit – All Messages (Specified Message ID) |
|
Audit – All Messages (Specified Timeline) |
|
Audit – All Migration Actions |
Message IDs: 30900-30907 |
Audit – All Mobile Device Management Actions |
Message IDs: 40200-40206 / 45000-45004 / 47000-47002 / 48000-48003 / 49003-49005 / 51000-51006 / 52000-52020 |
Audit – All Phased Deployment Actions |
Message IDs: 53601-53603 |
Audit – All Query Actions |
Message IDs: 30063-30065 / 30302-30303 |
Audit – All Report Actions |
Message IDs: 30091-30093 / 31000-31002 |
Audit – All Search Folder Actions |
Message IDs: 30700-30702 |
Audit – All Secondary Site Actions |
Message IDs: 30012-30014 / 30021-30023 |
Audit – All Site Server Boundary Actions |
Message IDs: 30054-30056 |
Audit – All Site Server Definition Actions |
Message IDs: 30030-30032 |
Audit – All Site Server Property Actions |
Message IDs: 30024-30029 |
Audit – All Site Server Role Actions |
Message IDs: 30036-30038 |
Audit – All Site Server Security Actions |
Message IDs: 30057-30062 / 30210-30212 / 31200-31242 / 31203-31249 |
Audit – All Site Server SQL Actions |
Includes Site Maintenance Tasks
Message IDs: 30048-30053 |
Audit – All Software Metering Rules Actions |
Message IDs: 30094-30095 / 30105 |
Audit – All Software Update Actions |
Message IDs: 30112 / 30118-30124 / 30135-30137 / 30172 / 30183-30188 / 30196-30198 / 30219-30221 / 30229-30231 / 30506-30507 / 42031-42033 / 4900-49002 |
Audit – All User Object Actions |
Message IDs: 30600-30606 |
Script to Import Status Message Queries
The script below can be download here on GitHub: Import-CMStatusMessageQueries.ps1.
param(
    [Parameter(Mandatory=$True)]
    [string]$XMLPath
)

# Imports ConfigMgr Module
Import-Module "$env:SMS_ADMIN_UI_PATH..ConfigurationManager.psd1"

# Get SiteCode
$SiteCode = Get-PSDrive -PSProvider CMSITE
Set-location $SiteCode":"

# Imports XML
try
{
    $CMStatusMsgs = Import-Clixml $XMLPath
}
catch
{
    Write-Host -ForegroundColor Red "Invalid file path or file type.  Please try again."
    Exit
}

foreach ($Query in $CMStatusMsgs)
{
    try
    {
        $StatusQuery = @{
            Name = $Query.Name
            Expression = $Query.Expression
            Comments = $Query.Comments
        }
        New-CMStatusMessageQuery @StatusQuery
        Write-Host -ForegroundColor Green $Query.Name "was created successfully."
    }
    catch
    {
        Write-Host -ForegroundColor Red $Query.Name "already exists."
    }
}
Export Status Message Queries to XML
What if you wish to export your own Status Message Queries to another environment? You can leverage the ConfigMgr PowerShell cmdlets: Get-CMStatusMessageQuery and Export-Clixml.
NOTE: Requires the ConfigMgr PowerShell Module
Export all Queries
Get-CMStatusMessageQuery | Export-Clixml <path>StatusMsgQueries.xml
Export only Queries beginning with the name “Audit”
Get-CMStatusMessageQuery -Name Audit* | Export-Clixml <path>Audit_StatusMsgQueries.xml
References: Get-CMStatusMessageQuery, Export-Clixml
I hope this information will help you in becoming a true detective within your environment. Very special thanks for SaudM on the “Enumerating Status Message Strings” script along with Kevin Kasalonis on his assistance with the content of this blog.
Thank you again for reading!
Brandon McMillan, Customer Engineer
Disclaimer: The information on this site is provided “AS IS” with no warranties, confers no rights, and is not supported by the authors or Microsoft Corporation. Use of any included script samples are subject to the terms specified in the Terms of Use.
by Contributed | Feb 10, 2021 | Technology
This article is contributed. See the original author and article here.
A few months ago, I published a blog post announcing the availability of guidance for deploying Magento in Azure Kubernetes Service (AKS). Today, I’m pleased to announce the release of an Azure Resource Manager (ARM) template, with variables for all scalability settings, designed to help deploy Azure resources for Magento.
Note: For details about the solution architecture for running Magento on Azure, see this reference architecture.
Performance tuning
Initially, our goal was to identify the parameter settings required to reach 300+ orders per minute. For performance testing, we leveraged the Magento Performance Toolkit, which uses Apache JMeter to simulate customer behaviors such as signing in, browsing products, and checking out. At the beginning of the process, we discovered a few bottlenecks, such as serving static files, storing user sessions, using full-text search, and some issues related to networking. These factors contributed to a starting point of about 140 orders per minute. After we resolved all bottlenecks, we were able to achieve 340 orders per minute by using a 10–node AKS cluster with 16 core MySQL.
Template parameters
To ensure a great starting point for all customers, the ARM template we’ve released uses default values for each variable. This ensures that you can avoid unnecessary initial costs when working on a proof of concept that requires deploying a performant architecture. In all likelihood, you’ll want to update these values to ensure that they address your specific scenario and scalability requirements.
The following table lists parameters in the template that determine how much the cluster can scale. It provides detail about the default values included in the template, along with the parameters we used to achieve 340 orders per minute for comparison.
Parameter
|
Default value
|
Value for 340 orders/min
|
aksNodePoolSize
|
3
|
10
|
aksNodePoolVMSize
|
Standard_DS2_v2
|
Standard_F8s_v2
|
mySQLSkuName
|
MO_Gen5_4
|
MO_Gen5_16
|
mySQLSkuTier
|
MemoryOptimized
|
MemoryOptimized
|
mySQLSkuFamily
|
Gen5
|
Gen5
|
mySQLSkuCapacity
|
4
|
16
|
mySQLStorageSize
|
128000
|
512000
|
fileShareQuota
|
512
|
16384
|
Keep in mind that while higher values generally provide better performance, they also tend to result in increased costs.
Guidance
If you have plans to deploy Magento on Azure, download the template, and review its contents. Use the Magento Performance Toolkit to help determine the most appropriate values based on your own cost and considerations.
I hope you’ll find this template useful. If you have questions or feedback about the template, feel free to reach out to the Ask Azure DB for MySQL alias for additional assistance!
by Contributed | Feb 10, 2021 | Technology
This article is contributed. See the original author and article here.
Kubernetes was built for the needs of IT operations, not developers. Wouldn’t it be nice if you can write code and push to source control, then have your application up and running in minutes?
Azure Red Hat OpenShift runs Kubernetes at its core and includes everything you need to manage your development lifecycle, such as standardized workflows, support for multiple environments, continuous integration, release management, and more.
In this blog post, we’ll explore some of the features that make Azure Red Hat OpenShift a turnkey container platform with a significantly improved developer and operator experience.
Web Console – developer perspective
The developer perspective in the OpenShift Web Console provides an alternative view that is focused on developer use cases. The enhanced UI for application topology and application builds in the Web Console make it easier for developers to build, deploy, configure, and visualize containerized applications and cluster resources. You can use the developer perspective to view the application topology, deploy applications, setup and review application health monitoring and logging, and configure build pipelines.
Video sequence showing application topology view in the developer console
Source-to-image (S2I)
Bring your code from Git, or push it from your development machine to build reproducible container images, using several built-in builder images for Perl, PHP, .NET Core, Go, Ruby, Python, Java and Node.js. You can even create your own builder images. Source-to-image automatically injects your application’s source or binary artifacts into a base image and assembles the artifacts with any required dependencies to create a new, ready-to-run image containing your application.
 Video sequence showing creating an application from Git using source-to-image
OpenShift Do
When creating applications to be deployed using containers, there are a lot of common build and deployment tasks that make up the inner development cycle. As a developer, you may need to write a Dockerfile, build containers locally, push them to a container registry, write lots of YAML and use kubectl apply before you can see your code running on the cluster. Odo (short for OpenShift Do) is a fast, iterative and straightforward CLI tool for developers who write, build and deploy applications on Kubernetes and OpenShift. Odo streamlines that inner loop to let you focus on your application’s source code. Its syntax and design uses concepts familiar to developers, such as projects, applications, and components. Odo can deploy applications in several development languages and frameworks. Deployment creation, build configurations and routes are automated and it is designed for quick iterations, as it detects changes to local code and deploys the updates to the cluster automatically.
 Video sequence showing creating an application using odo
OpenShift Serverless
Build portable event driven apps that scale with demand. Based on the open source Knative project, OpenShift Serverless simplifies the process of delivering code from development into production while abstracting away the underlying infrastructure. The serverless functionality will start the application containers when they are called by an event, such as an HTTP request and other triggers from a variety of event sources. The containers can also scale to zero, eliminating resource consumption when not in use.
 Video sequence showing deploying an application to OpenShift Serverless
Next steps
Adopting a container platform lets you keep up with application scale and complexity requirements. Azure Red Hat OpenShift is designed to make deploying and managing applications easier. It provides commercial support for the languages, databases, and tooling you already use, while providing easy access to Azure services such as Azure Database for PostgreSQL and Azure Cosmos DB, to enable you create resilient and scalable cloud native applications. If you’re interested to see how this all works together, watch this short video to see how to deploy a multi-tier Java application from containers, from source code and through CI/CD into Azure Red Hat OpenShift.
Try Azure Red Hat OpenShift now. Start with the Azure Red Hat OpenShift documentation and continue your learning experience on the Azure video center. Connect with Microsoft and community experts to share feedback, learn from others, and find answers to your technical questions on the Azure Red Hat OpenShift topic on the Microsoft Q&A site.

by Contributed | Feb 10, 2021 | Technology
This article is contributed. See the original author and article here.
Artificial Intelligence (AI) is such a heady topic that it is hard for beginners to know where to start.
After all, it is an incredibly broad field that in 2020 alone took major leaps forward in everything from producing high-quality text to discovering new drugs and forecasting heat waves. While these are impressive advances, they can be daunting to newcomers without an idea of where to start in their journey toward a career in AI.
Uniting scattered educational resources and presenting a holistic overview of the topic to the next generation is exactly what AI MVPs Eva Pardi, of Denmark, and Håkan Silfvernagel, of Norway, are looking to do with AI42. The AI and Machine Learning academy aims to spread the word on all things data science between professionals and school students.
“We are starting with mathematics, statistics and probability theory and continue with languages for machine learning such as Python, R and Scala,” the duo says.
“Then, we build up the knowledge bit by bit and go gradually from an introduction to machine learning and data science through to deep learning and up to more advanced topics such as Reinforcement learning and Explainable AI.”
AI42, with the “42” referring to AI as the answer to all questions, provides live lectures held by experts, some of whom are Microsoft employees, every second week on Wednesday at 5 PM (CET) through its social media channels on YouTube, Twitter, Facebook, and Twitch.
In addition, the academy provides workshops so that participants can put their theory into practice, with the end goal being to best prepare the AI professionals of tomorrow with the right starting point today.
“We believe that AI and ML will become more and more ingrained into the products and services that we use in everyday life and, in addition, they will also affect the way that decisions are made in various fields ranging from healthcare, insurance, education, policy-making and environmental concerns,” Eva and Håkan say.
“It is important that as many people as possible can have a general understanding of AI and ML so that they can make informed decisions and also be able to understand ethical implications of using these sorts of technologies.”
Next, the academy founders are set to launch their own website to provide a knowledge base where students can get additional resources for practising what they have learned, and gain easy access to teachers for mentorship.
“Our vision for AI42 is that it will be a lively community including both students and teachers and that we will be able to have a positive impact on people’s lives in terms of starting new careers, getting more knowledge and finding a community of people with similar interests,” the pair of MVPs say.
For more, check out Eva’s Twitter @EvePardi and Håkan’s Twitter @agrevlis
by Contributed | Feb 10, 2021 | Technology
This article is contributed. See the original author and article here.
Special thanks to Nicholas DiCola for collaborating on the solution!
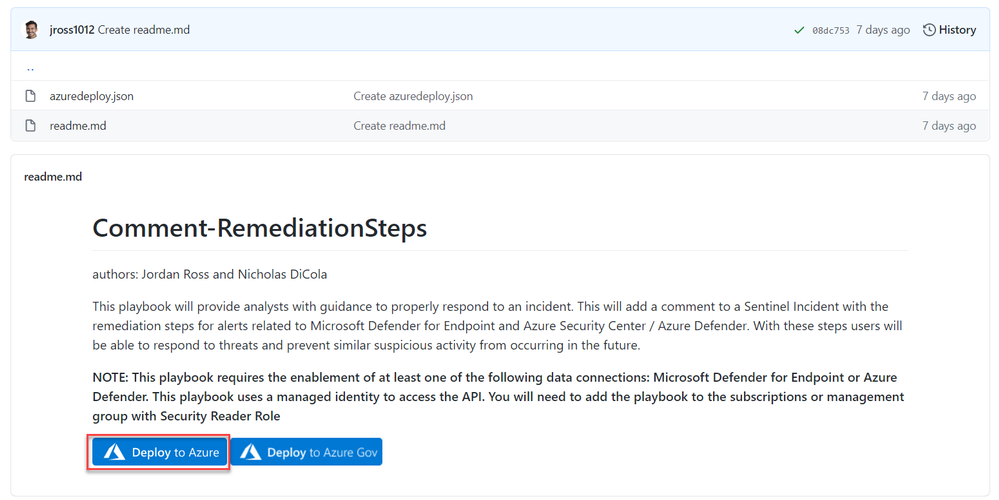
In this blog you will learn how to bring guided remediation steps into Azure Sentinel (from Azure Defender and Microsoft Defender for Endpoint) to enhance the security posture of your organization and stop attacks.
Background
Once an investigation is underway in Sentinel, SOC Analysts are then tasked with responding to true threats and preventing malicious activity from further occurring. With Sentinel’s Incidents, SOC’s have a collection of entities, events, and alerts to analyze and determine what resources need further security or remediation.
With this playbook, Azure Sentinel users that have Microsoft Defender for Endpoint or Azure Defender will experience a tighter integration of their best security tools within Azure Sentinel.
Rather than having to jump from portal to portal, this playbook identifies recommended steps to resolve a potentially malicious or suspicious event and surfaces this guidance in the form of a comment on the related Sentinel incident.
Ready, Set, Go
1. To get started, deploy the playbook to Azure using the GitHub artifact using this link: Remediation Steps Playbook
2. After you have deployed the playbook from the Sentinel GitHub and add it to your Sentinel related resource group.

3. Once the playbook has successfully deployed, navigate to the playbook’s (‘Comment_RemediationSteps’) Logic App Designer. Once in the designer, be sure to enable the connections to Azure Monitor and Sentinel. This is as simple as selecting the connection in the Logic App designer and clicking ‘Add new’ to establish your new connection as seen below:
(Note: there are three areas in the logic app where a connection to an identity or service principal is required. This is needed at the trigger “When a response to an Azure Sentinel alert is triggered”, and the two actions: “Alert – Get incident” and “Run query and list results”)

4. Once the connections have been made, hit save and you are all set to use the playbook to provide guided remediation steps to you analysts. This playbook runs off a manual trigger, so when an analyst finds an incident related to Azure Defender or Microsoft Defender for Endpoint, all the analyst needs to do is open the incident -> click ‘View Full Details’ -> Under the ‘Alerts’ tab click ‘View Playbooks’ -> and click ‘Run’ on ‘Comment_RemediationSteps’as seen in the visuals below:
a. View Full Details

b. View playbooks

c. Run playbook

5. Once the playbook “Comment_RemediationSteps” has been run, return to the related incident’s ‘comments’ tab and you will find that the remediation steps have been posted as seen below:

Using these steps an analyst can ensure that an attack does not progress, and that the organization’s security posture has been improved to prevent future intrusions.
Related Content:
How Azure Sentinel and Azure Security Center Work Together – YouTube
Connect Microsoft Defender for Endpoint data to Azure Sentinel | Microsoft Docs
Connect Azure Defender data to Azure Sentinel | Microsoft Docs
Tutorial: Run a playbook in Azure Sentinel | Microsoft Docs
Overview of the Logic App:


by Contributed | Feb 10, 2021 | Technology
This article is contributed. See the original author and article here.
The 1st Service Fabric Community Q&A call of the year will be on Feb 18th at 10am PST.
Starting in August 2020, we introduced a new framework for our monthly community sessions. In addition to our normal Q&A in each community call we will focus on topics related to various components of the Service Fabric platform, provide updates to roadmap, upcoming releases, and showcase solutions developed by our customers that benefit the community.
Agenda:
- Key Announcements since our last community call
- Upcoming Service Fabric 8.0 highlights
- Q&A
Join us to learn more about the above topics and ask us any questions related to Service Fabric etc. This month’s Q&A features one session on:
As usual, there is no need to RSVP – just navigate to the link to the call and you are in.
by Contributed | Feb 10, 2021 | Technology
This article is contributed. See the original author and article here.
Azure Cognitive Search provides developers with APIs and tools to make it easy to add a great search experience to your application. There are tools available in the portal to import data into a search index and SDKs to simplify the integration of search functionality into your code base.
However, sometimes you need something in between: simpler than code, but more powerful than the portal. In these cases, it’s common to interact directly with the REST APIs to quickly update an indexer, add a document, or perform other standard tasks. Tools like Postman are great for this but building out API calls from scratch can quickly become tedious. You wouldn’t write an API call from scratch to add a document to Azure Storage—you’d use Azure Storage Explorer—and we don’t want you to have to do that for search either.
With this in mind, we created the Visual Studio Code Extension for Azure Cognitive Search (Preview). The Visual Studio Code extension makes it easy to work with your search service using the full capabilities of the REST APIs while providing rich IntelliSense and snippets to help you. With the extension, you can create and update indexes and other components, add documents, search, and more. You’ll never need to struggle with remembering the correct syntax again.
Extension Functionality
The extension covers all the major REST API operations for Cognitive Search. Check out the examples below to see some of what’s possible and feel free to request additional functionality here.
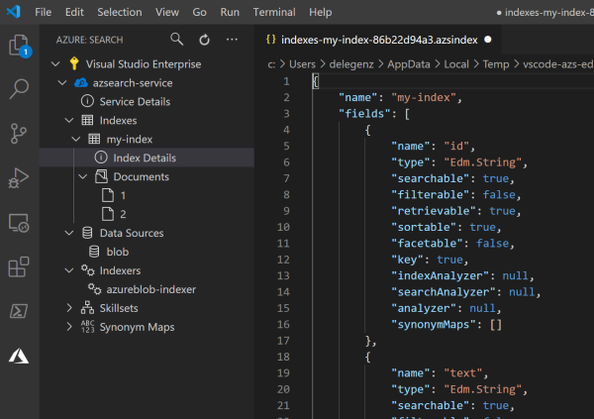
Browse all your Azure Cognitive Search services
Get access to all your search services in one place. You can quickly see all your indexes, indexers, and other components.
Create new indexes, indexers, data sources, skillsets, and synonym maps
You can create a new index or other component just by editing the JSON and saving the file. You can then read, update, or delete these components at any time.

Take advantage of rich IntelliSense
The extension also includes IntelliSense to guide you as you’re building out your JSON. Instead of referencing external docs each time, you can see what parameters exist and what their allowed values are as you type.

In addition to IntelliSense, the extension provides snippets or templates for building more complex objects, such as data sources and skillsets, so that you have a good starting point.
Add or update documents in the search index
Adding or updating documents is something that’s not possible in the portal today. With the extension, you can quickly add a document, and it will even save you some time by creating a JSON template for you based on your index definition.

You can view or update existing documents too.
Query your search indexes
Finally, once you’ve added documents to your search service, you can also query from within the extension and view the results side by side. You can even add multiple queries or save the queries to a file to refer to them later.

Key use cases
If your security requirements mandate the use of Private Endpoints or IP Firewalls, you’ll find that some functionality is no longer available in the portal. For these cases, the extension is a great alternative to the portal for interacting with your indexes and the other components of your search service.
In other cases, if you find yourself constantly recreating indexes or making small tweaks to them or other search components, the extension can make it incredibly easy to make small updates such as adding a field to an index.
Get Started
Regardless of how you’re trying to use Cognitive Search, this extension will likely make your life easier. To get started today, download the extension, and follow the related quickstart. You’ll see just how quickly and easily you can get up and running with Cognitive Search using the Visual Studio Code Extension.
If you run into any issues or have any questions, please feel free to reach out to us at azuresearch_contact@microsoft.com or raise an issue on the extension’s GitHub repo.
by Contributed | Feb 10, 2021 | Technology
This article is contributed. See the original author and article here.
Azure Cognitive Search provides developers with APIs and tools to make it easy to add a great search experience to your application. There are tools available in the portal to import data into a search index and SDKs to simplify the integration of search functionality into your code base.
However, sometimes you need something in between: simpler than code, but more powerful than the portal. In these cases, it’s common to interact directly with the REST APIs to quickly update an indexer, add a document, or perform other standard tasks. Tools like Postman are great for this but building out API calls from scratch can quickly become tedious. You wouldn’t write an API call from scratch to add a document to Azure Storage—you’d use Azure Storage Explorer—and we don’t want you to have to do that for search either.
With this in mind, we created the VS Code Extension for Azure Cognitive Search (Preview). The VS Code extension makes it easy to work with your search service using the full capabilities of the REST APIs while providing rich IntelliSense and snippets to help you. With the extension, you can create and update indexes and other components, add documents, search, and more. You’ll never need to struggle with remembering the correct syntax again.
Extension Functionality
The extension covers all the major REST API operations for Cognitive Search. Check out the examples below to see some of what’s possible and feel free to request additional functionality here.
Browse all your Azure Cognitive Search services
Get access to all your search services in one place. You can quickly see all your indexes, indexers, and other components.
Create new indexes, indexers, data sources, skillsets, and synonym maps
You can create a new index or other component just by editing the JSON and saving the file. You can then read, update, or delete these components at any time.
Take advantage of rich IntelliSense
The extension also includes IntelliSense to guide you as you’re building out your JSON. Instead of referencing external docs each time, you can see what parameters exist and what their allowed values are as you type.
In addition to IntelliSense, the extension provides snippets or templates for building more complex objects, such as data sources and skillsets, so that you have a good starting point.
Add or update documents in the search index
Adding or updating documents is something that’s not possible in the portal today. With the extension, you can quickly add a document, and it will even save you some time by creating a JSON template for you based on your index definition.
You can view or update existing documents too.
Query your search indexes
Finally, once you’ve added documents to your search service, you can also query from within the extension and view the results side by side. You can even add multiple queries or save the queries to a file to refer to them later.
Key use cases
If your security requirements mandate the use of Private Endpoints or IP Firewalls, you’ll find that some functionality is no longer available in the portal. For these cases, the extension is a great alternative to the portal for interacting with your indexes and the other components of your search service.
In other cases, if you find yourself constantly recreating indexes or making small tweaks to them or other search components, the extension can make it incredibly easy to make small updates such as adding a field to an index.
Get Started
Regardless of how you’re trying to use Cognitive Search, this extension will likely make your life easier. To get started today, download the extension, and follow the related quickstart. You’ll see just how quickly and easily you can get up and running with Cognitive Search using the VS Code Extension.
If you run into any issues or have any questions, please feel free to reach out to us at azuresearch_contact@microsoft.com or raise an issue on the extension’s GitHub repo.
by Contributed | Feb 10, 2021 | Technology
This article is contributed. See the original author and article here.
permalink: https://aka.ms/FTAISVLogging
reference links permalink: https://aka.ms/LoggingReference
Microsoft Azure Monitor includes many logging and monitoring features that can help an independent software vendor (ISV) with gaining metrics to monitor their solution on Azure or on Prem. In this set of three video presentations, I present your options and features.
Although these are not talking about any ISV-only features, they are ISV-focused – so while this content would certainly be helpful for you if you’re not an ISV, you should be aware that is the lens through which I am presenting the content.
These videos include a English closed-caption-file reference, and are best viewed full-screen.
Please let us know in the comments what you think, and if you have questions! If you have an ISV-specific topic that you feel would be good for a 15-20 minute video or a small set of them, let us know!
Session 1: Overview – What is Azure Monitor
Sorry, your browser doesn’t appear to support embedded videos.
Session 2: Levels of Monitoring – App, Platform, Infrastructure
Sorry, your browser doesn’t appear to support embedded videos.
Session 3: Visualizations and Alerts
Sorry, your browser doesn’t appear to support embedded videos.

Recent Comments