by Contributed | Mar 2, 2021 | Technology
This article is contributed. See the original author and article here.
1. Hotnews : Updates to SAP on Azure Documentation
SAP introduced a new feature called HANA data volume partitioning with HANA 2.0 Support Pack Stack 3.
This feature places multiple Hana datafiles onto multiple disks, thereby avoiding the requirement to aggregate disks using LVM. Some Linux Administrators prefer simpler disk structures.
Example: Rather than aggregating 4 x P30 in LVM and placing one large datafile, multiple datafiles can be placed onto 4 separate disks.
Microsoft has updated the SAP Hana on Azure documentation to reflect the usage of this new feature. Customers should test scenarios such as Backup/Restore and DB integrity check.
SAP HANA Azure virtual machine storage configurations – Azure Virtual Machines | Microsoft Docs
SAP HANA Azure virtual machine ANF configuration – Azure Virtual Machines | Microsoft Docs
SAP HANA – Partitioning Data Volumes | SAP Blogs
Other recent documentation updates for Azure NetApp Files include:
Azure Virtual Machines Oracle DBMS deployment for SAP workload
HA for SAP HANA scale-up with ANF on RHEL
SAP HANA scale-out HSR with Pacemaker on Azure VMs on RHEL
SAP HANA scale-out with standby node on Azure VMs with ANF on SLES
SAP HANA scale-out with standby node on Azure VMs with ANF on RHEL
NFS v4.1 volumes on Azure NetApp Files for SAP HANA
Azure Storage Configuration page is frequently updated. It is recommended to review recent changes in:
SAP HANA Azure virtual machine storage configurations. Recently the disk performance table has been updated to include Azure Premium Disk Burst functionality
More information on Disk Performance Tiers can be found here: Performance tiers for Azure managed disks – Azure Virtual Machines | Microsoft Docs
Recent price reductions and performance improvements are announced here More IOPS at no additional cost for Azure Files premium tier | Azure updates | Microsoft Azure
The main SAP on Azure site https://azure.microsoft.com/en-us/solutions/sap/
SAP on Azure Resources https://azure.microsoft.com/en-us/solutions/sap/resources/
SAP on Azure Updates on the main Azure site https://azure.microsoft.com/en-us/updates/?query=sap
SAP on Azure Documentation “Getting Started” https://docs.microsoft.com/en-us/azure/virtual-machines/workloads/sap/get-started
2. New Azure Monitoring Agent
A new Azure Monitoring Agent is currently in preview and will become Generally Available in due course.
Azure Monitor agent overview – Azure Monitor | Microsoft Docs
The new Azure Monitoring Agent (AMA) has advantages over the current monitoring framework
AMA fully supports Multi-homed Linux VMs and control over version upgrades
AMA is still in Public Preview, but when released AMA will become the default agent installed when a new VM is created. The previous Log Analytics solution will still be available for manual installation.
AMA can also monitor non-Azure servers using ARC Azure Arc – Azure Management | Microsoft Azure
To join the AMA Preview https://aka.ms/AMAgent
Supported Operating Systems include popular Windows, Suse and Redhat releases used by SAP customers Overview of the Azure monitoring agents – Azure Monitor | Microsoft Docs
3. Tuning for SIOS LifeKeeper on Oracle Linux
A significant number of SAP on Azure customers run on Oracle database. Microsoft is continuing to improve and optimize the Azure platform for SAP on Oracle customers. In recent time we have published guidance for deploying Oracle 19.8 on Oracle Linux 8.2 with Automatic Storage Management (ASM). In the future we will publish blogs on Oracle DataGuard and SnapShot Backup of ASM systems.
Oracle customers are often using SIOS LifeKeeper cluster software for the ASCS cluster. Testing has shown the following configuration is optimal for DB, ASCS and SAP Application servers
- Increase SIOS cluster timeout to 45 sec (5 sec heartbeats x 9 failures)
- Set /proc/sys/net/ipv4/tcp_retries2 = 9 (originally set to 15) on cluster VMs
- Set ASCS/SCS for ENSA1 profile parameter to: enque/encni/set_so_keepalive = true restart SAP ASCS/SCS to enable settings
- Set net.ipv4.tcp_keepalive_time = 300 (originally set to 7200) on ALL VMs
Thanks for Goran for contributing this item
SIOS Lifekeeper: Linux High Availabillity Cluster Software | SIOS
4. Recommended Blogs for SAP on Azure Customers & Consultants
Many new useful blogs have been created by Microsoft for SAP customers
Part 1: Application Gateway WAF v2 setup for Internet facing SAP Fiori Apps
The blog provides details to configure Application Gateway WAF v2 which acts a first line of defense for Internet facing SAP Fiori Apps in Azure.
NOTE: There is a difference in the end-to-end SSL setup process with respect to the version of application gateway used (v1 or v2). As this blog highlights configuration using application gateway SKU v2, you will find a difference in setup process if you configure application gateway v1.
Part 2: Single Sign On Configuration using SAML and Azure Active Directory for Public and Internal URLs
We already have an official tutorial that describes Azure Active Directory Single Sign On (SSO) integration with SAP Fiori, but this blog extend the use on achieving SAML based SSO for two different URLs (Public and Internal).
Thanks to Bartosz Jarkowski for contributing this blog on SQL Server TDE with Azure Key Vault
https://blogs.sap.com/2021/01/19/your-sap-on-azure-part-25-sql-server-transparent-data-encryption-with-azure-key-vault/
Thanks to Philipp Leitenbauer for releasing this useful tool – version 2.0 of the Hana on Azure Quality Check tool
SAP-on-Azure-Scripts-and-Utilities/QualityCheck at main · Azure/SAP-on-Azure-Scripts-and-Utilities · GitHub
Thanks to Vamshi Polasa for releasing this whitepaper on migrating Oracle workloads to Azure
https://techcommunity.microsoft.com/t5/running-sap-applications-on-the/migrating-sap-on-oracle-workloads-to-azure/ba-p/2109839
Thanks to Anjan for providing a procedure to replication Linux Pacemaker ASCS clusters with ASR
SAP ASCS HA Cluster (in Linux OS) failover to DR region using Azure Site Recovery – Microsoft Tech Community
Another major customer is moving from SAP ECC on Azure to S4 running on Hana Enterprise Cloud running on Azure.
Zespri selects SAP cloud solutions in multi-year deal – SAP Australia & New Zealand News Center
Thanks to Ralf Klahr for this video about CONA (Coca Cola North America)
https://tv.netapp.com/detail/video/6230415190001
Thanks to Goran Condric and others for these blogs on automating system shutdown & startup
Optimize your Azure Costs by Automating SAP System Start – Stop – Microsoft Tech Community
Hey, SAP Systems! My PowerApp says Snooze! But only if you’re ready yet | SAP Blogs
5. SQL Server 2019 CU8 Distributed Network Name
A new feature has been added in SQL Server 2019 CU8 that eliminates the requirement to have a Internal Load Balancer for the SQL Server AlwaysOn Listener. This new feature simplifies the setup, configuration and operations of SQL Server AlwaysOn. Customers may also notice that failover times are faster with a DNN.
A Distributed Network Name (DNN) Listener can be retrofitted to an existing configuration that has a conventional ILB. Documentation on the setup and configuration of a DNN can be found here https://docs.microsoft.com/en-us/azure/azure-sql/virtual-machines/windows/availability-group-distributed-network-name-dnn-listener-configure
It is recommended to set MultiSubnetFailover=True and review https://docs.microsoft.com/en-us/azure/azure-sql/virtual-machines/windows/availability-group-dnn-interoperability
Note: this feature is exclusively available only as of SQL Server 2019 with CU8 or higher and Windows 2016 or higher.
The default.pfl and Windows environment variables should be updated. A sample ENV can be seen below. The TCP port number specified in the powershell command must be added to both the ENV and default.pfl. The format should be <listenername>,<port>. A comma and not a “.” or “:” must be used
MSSQL_CONNOPTS=MultiSubnetFailover=yes
MSSQL_DBNAME=P01
MSSQL_SCHEMA=p01
MSSQL_SERVER=dnnp01lsnr,6789
The latest SQL Server Service Pack and CU is always supported by SAP and can be downloaded from here https://techcommunity.microsoft.com/t5/sql-server/bg-p/SQLServer/label-name/SQLReleases
SQL Server 2019 CU8 Availability Groups Supports DNNs (microsoft.com)
6. Running Oracle on Azure NetApp Files
It is now supported to run Oracle 19.8 DBMS on Oracle Linux 8.2 connection over NFS to Azure NetApp Files. NetApp features such as Snapshot backup can be used for near instant Backup & Restore
Note: VM skus with very high network quota may be needed
7. SUSE Linux 15 Service Pack 2 – Remove Mount Option NOBARRIER
SUSE Linux Enterprise Server 15 (SLES 15) or SUSE Linux Enterprise Server 15 for SAP Applications (SLES for SAP 15) is now certified and supported for both NetWeaver and Hana. The /etc/fstab option NOBARRIER has been depreciated for some time. Suse 15.2 uses a Linux 5.0 kernel. The option NOBARRIER will now cause an error and should be removed. On most modern Linux distributions the NOBARRIER option will be ignored.
The correct IO Scheduler options are documented here SAP HANA Azure virtual machine storage configurations – Azure Virtual Machines | Microsoft Docs
Azure Site Recovery and Azure Hana Backup are both supported on Suse 15 Service Pack 2 (Linux Kernel 5.0)
List of SUSE Linux Enterprise Server kernel (version and release date) | Support | SUSE
8. Update on Support Matrix for SAP on Azure
In recent months many new features have become available for SAP customers. The list below is a very brief overview of recommended features and updated documentation
- Azure Disk Encryption is now supported for Gen2 Windows VMs. Gen2 Linux VM support is in progress
- Redhat 8.2 is now certified for Netweaver and Hana.
- Suse 15.2 is now certified for Netweaver and Hana
- Azure Site Recovery now works with Linux Pacemaker clusters and the procedure for protecting and recovering Pacemaker clusters after an ASR failover is documented here https://techcommunity.microsoft.com/t5/blogs/blogworkflowpage/blog-id/SAPApplications/article-id/722
- Azure Site Recovery Portal support for PPG is now live https://docs.microsoft.com/en-us/azure/site-recovery/how-to-enable-replication-proximity-placement-groups
- Azure Backup for Hana now supports incremental backups Azure Backup for SAP HANA databases now supports Incremental backups – Public preview | Azure updates | Microsoft Azure
- Azure backup increased SAP HANA soft limit from 2 TB to 8 TB volume
- Customers with a requirement for Immutable Storage for legal or compliance reasons and/or to prevent modification of objects such as backups can use https://docs.microsoft.com/en-us/azure/storage/blobs/storage-blob-immutable-storage
- Customers are recommended to review “Azure Monitor for SAP” which is in preview – https://docs.microsoft.com/en-us/azure/virtual-machines/workloads/sap/azure-monitor-providers
The Azure platform offers ADE and additional encryption solutions. These will be discussed in an upcoming blog:
- Double Encryption https://docs.microsoft.com/en-us/azure/virtual-machines/disks-enable-double-encryption-at-rest-portal
- Encyption at Host https://docs.microsoft.com/en-us/azure/virtual-machines/disks-enable-host-based-encryption-portal
9. New Azure Monitor Counters – Guest VM Throttling
Customers and Partners should setup Azure Monitor and leverage new performance counters to ensure SAP on Azure solutions are correctly sized for optimal cost savings and performance.
Over-sizing VMs leads to excessive costs. Undersizing VMs can lead to performance and stability problems.
Each Azure VM is assigned a specific quota of CPU, RAM, Disk & Network. If these quotas are saturated for extended periods performance and stability problems may occur. It is recommended to size VMs such that there are only momentary spikes to 100% for brief periods, typically no more than tens of seconds
Forunately the Azure platform comes with Azure Monitor – a very powerful and useful tool. https://docs.microsoft.com/en-us/azure/azure-monitor/overview
Azure Monitor Quickstarts for Linux and Windows can be found here https://docs.microsoft.com/en-us/azure/azure-monitor/learn/quick-monitor-azure-vm
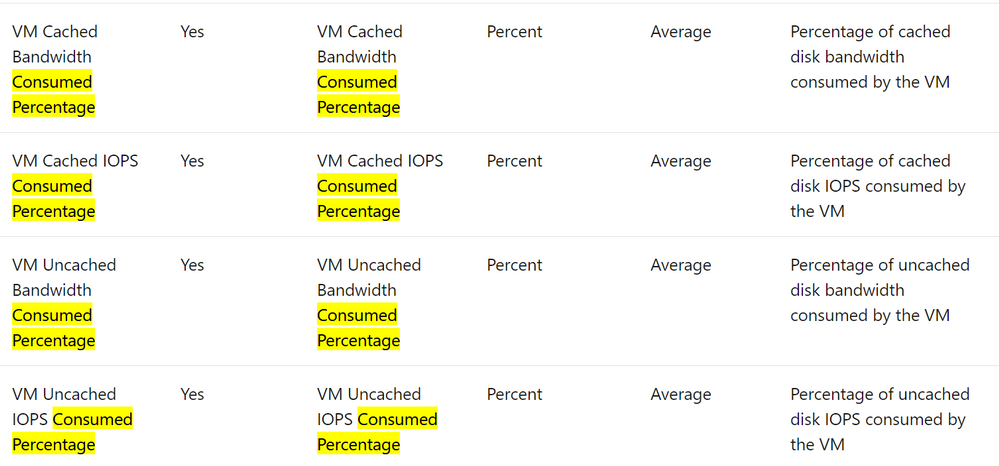
A list of all the Azure Monitor metrics can be found here
https://docs.microsoft.com/en-us/azure/azure-monitor/platform/metrics-supported but the more useful counters for SAP IaaS VMs can be found here Azure Monitor supported metrics by resource type – Azure Monitor | Microsoft Docs
The counters that monitor disk quota consumption are labelled “Consumed Percentage”. In addition to the below monitoring the network throughput may also be useful.


The quotas of typical VMs used for SAP systems can be found in this link below.
Edv4 and Edsv4-series – Azure Virtual Machines | Microsoft Docs
Additional Links & Notes
The new Azure Portal Application is faster and has useful features – available for download
https://portal.azure.com/App/Download
Redhat support cycle and support dates Red Hat Enterprise Linux Life Cycle – Red Hat Customer Portal
Azure Files NFS 4.1 is now in Preview https://azure.microsoft.com/en-us/updates/azure-files-support-for-nfs-v41-is-now-in-preview/ Azure Files NFS removes the need for a highly available NFS VM infrastructure
Azure Certification and Training courses
Collections – MicrosoftAzuretrainingandcertifications | Microsoft Docs
SAP on Azure Free Online Training Course. Exam AZ-120: Planning and Administering Microsoft Azure for SAP Workloads
https://docs.microsoft.com/en-us/learn/certifications/exams/az-120
A free Certification Exam offer is here https://docs.microsoft.com/en-us/learn/certifications/microsoft-build-cloud-skills-challenge-2020-free-certification-exam-offer
This Red Hat article How to in-place upgrade SAP environments from RHEL 7 to RHEL 8 – Red Hat Customer Portal describes the supported combinations. For HANA, according to the article the in-place upgrade is only supported on non-cloud systems: “The in-place upgrade of RHEL 7 with SAP HANA can be performed from RHEL 7.7 to RHEL 8.2 only, on x86_64 only, and on non-cloud systems only. A SAP HANA system running on RHEL 7.6 or earlier must be updated to RHEL 7.7 “
by Contributed | Mar 1, 2021 | Technology
This article is contributed. See the original author and article here.
Since Ignite last September, we’ve been focused on delivering enhancements to Azure Disk Storage to help our customers migrate their mission-critical workloads to Azure. Today, at Microsoft Ignite 2021, we are excited to share a new set of innovations for Azure Disk Storage across key elements, including reliability, scale & performance, security, data protection, and cloud native applications.
This blog post gives you an overview of these new capabilities which will help you run your business-critical applications on Azure.
Reliability
Increase availability for your applications with Zone redundant storage (ZRS) on Premium and Standard SSDs, in preview
- Provide synchronous replication of data across zones in a region, enabling disks to tolerate zonal failures which may occur due to natural disasters or hardware issues.
- Enable customers to maximize their virtual machine availability without the need for application-level replication of data across zones, not commonly supported by legacy applications such as old versions of SQL or industry-specific proprietary software. This means that if a virtual machine becomes unavailable in an affected zone, you can continue to work with the disk by mounting it to a virtual machine in a different zone.
- Can be used with shared disks to provide improved availability for clustered or distributed applications like SQL FCI, SAP ASCS/SCS or GFS2.
Sign-up for the preview.
Read the blog and documentation to learn more about ZRS for Azure managed disks.
Scale & Performance
Achieve sustained higher performance by changing tiers without disruption to your workloads, in preview
In November 2020, we announced the general availability of performance tiers on Premium SSDs, which provides you the flexibility to scale the disk performance without increasing the disk size by selecting a higher performance tier. You can also change tiers to bring the disk back to your baseline performance tier, enabling you to achieve higher performance and cost savings. Performance tiers is critical for planned events like a seasonal sales promotion or running a training environment, where you need to achieve sustained higher performance for a few hours or days and then return to the normal performance levels. Now, in preview, you can change the performance tiers of Premium SSD without any downtime to your application – even when the disk is attached to a running virtual machine.
Sign-up for the preview.
Read the documentation to learn more about performance tiers on Premium SSDs.
Boost disk performance on-demand with new disk bursting experience on Premium SSDs, in preview
We are extending disk bursting support for larger Premium SSDs (above 512 GiB) with a new enhanced experience. Unlike credit-based bursting where you can only burst your performance if you have accrued credits, on-demand bursting allows you to burst up to 6x of the provisioned limit (up to 30,000 IOPS and 1,000 MBps) whenever needed. On-demand disk bursting is most suitable for mission-critical workloads where a limit in performance cannot be tolerated even for unexpected spikes. With on-demand disk bursting, you will be charged a burst enablement fee and for any additional transactions over the provisioned limit.
Read the documentation to learn more about on-demand bursting.
Security & Data Protection
Keep your data secure with auto-key rotation of customer-managed keys, in preview
Azure managed disks provide end to end encryption of data with your keys stored in Azure Key Vault. Now, you can choose to enable automatic rotation of your keys. When you generate a new version of a key in your Key Vault, the system will automatically update all the managed disks, snapshots, and images to the new key version within an hour.
Read the documentation to learn more about auto-key rotation of customer managed keys.
Protect your critical data with per disk backup, in preview
Per disk backup provides snapshot lifecycle management by automating periodic creation of snapshots and retaining it for configured duration using a backup policy. You can easily manage disk snapshots with no additional costs and without need for custom scripting or any management overhead. This is an agent-less and crash-consistent backup solution that takes point in time backup of a managed disk using incremental snapshots with support for multiple backups per day.
Several key aspects of per disk backup include:
- Faster and more frequent backups without disruption to your applications
- Supports backup and restore for both OS and data disks (including shared disks), regardless of whether they are currently attached to a running Azure Virtual machine.
- Cost-effective solution to backup specific disks
Sign-up for the preview.
Read the documentation to learn more.
Cloud Native Applications
Deploy and protect Stateful Kubernetes applications with Azure Disk CSI Driver, generally available
Container Storage Interface (CSI) is a standard for exposing block and file storage systems to containerized workloads on Kubernetes. With the GA of the Azure Disk CSI driver, starting in Kubernetes v1.20, you can now:
- Take advantage of the latest Azure Disk functionality by updating to the new CSI driver version, without the need to wait for Kubernetes release cycles.
- Create, manage and delete disk volume snapshots via Kubernetes native API, as well as, create new disk volumes pre-populated with the data from a snapshot via Kubernetes dynamic volume provisioning – providing a singular interface for volume and snapshot management.
- Use RWX raw block volumes from multiple pods.
Azure Disk CSI driver is now available with Kubernetes v1.20 onwards with AKS Engine and will be available on AKS coming soon.
by Contributed | Mar 1, 2021 | Technology
This article is contributed. See the original author and article here.
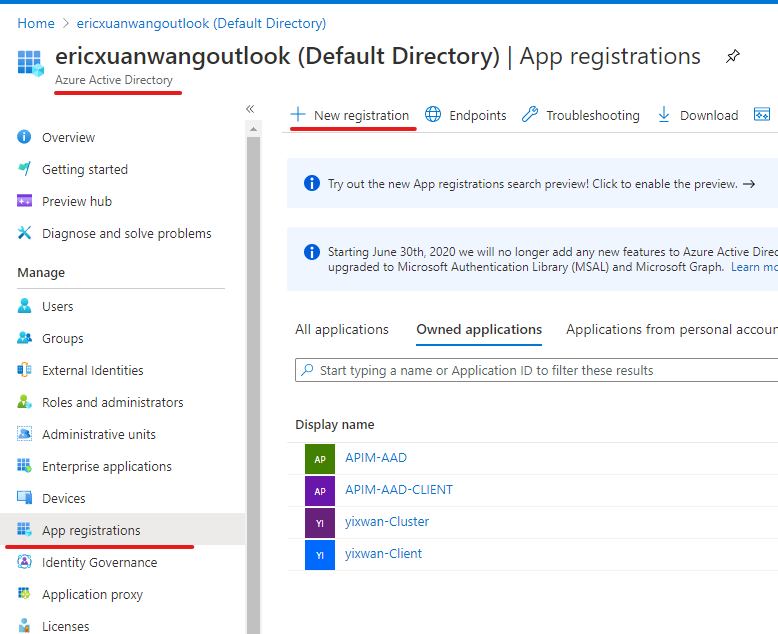
Here is our official documentation on how to use Azure AD to authenticate service fabric connection endpoint. It uses Powershell script to create two applications in the Azure AD resource.
https://docs.microsoft.com/en-us/azure/service-fabric/service-fabric-cluster-creation-setup-aad
We can also do these steps manually with UI in Azure Portal.
Abstract at the beginning of the blog
The service fabric cluster here will be treated as an AAD web app. When users access it with browser, it will pop the sign in box and navigate back to the provided reply URL after authentication just like any web OAuth process.
When user access it with client tool like SF Powershell module, the AAD client app here will sign in the user, then use the exposed API from AAD web app to validate if the user has the Admin role.
Application registration:
1) AAD web app
The first application we need to register in Azure AD is a web app, represents the cluster.
In authentication blade, we will configure like this:
Redirect URLs
Implicit grant and hybrid flows
- ID tokens (used for implicit and hybrid flows)
Supported account types:
- Accounts in this organization directory only (Single tenant)
Allow Public client flows:

User Role assignment:
We need to create an Admin App-Role for the AAD web app.

In App roles blade, we create app role with below configurations.
Display name:
Allowed member types:
Value
Description:

Then we will go to Enterprise applications blade of Azure AD. Go to overview the page of the applications we created. In Getting started section, we will see “Assign users and groups.”
We will add a user as Admin so that user can access SF connection endpoint with Azure AD.


Expose API
We need to expose the authentication API of the web app so that the client app like Powershell can use it to sign in the admin user.


Steps are done for the AAD web app here.
2) AAD client app
The second application we need to register in Azure AD is a Desktop/Native app, it represents tools like SF Powershell module. (Connect-ServiceFabricCluster)
In the authentication blade, we will configure like this:
Redirect URLs
Supported account types:
- Accounts in this organization directory only (Single tenant)
Allow Public client flows:

Add API Permission
AAD client needs this config so it can call the API we just exposed on AAD web app.
Add a permission => My APIs => your cluster web app => user_impersonation

Steps are done for the AAD client app here.
Done
Now you should be able to use AAD to connect service fabric cluster. And the browser will not prompt the certificate list for SFX.

If the process does not go as smoothly as expected, there is a troubleshooting section in the doc.
https://docs.microsoft.com/en-us/azure/service-fabric/service-fabric-cluster-creation-setup-aad#troubleshooting-help-in-setting-up-azure-active-directory
You can also read the Powershell script provided in our official documentation to understand what has been done. This is a steps-by-steps guide for users who prefer Azure Portal.
by Contributed | Mar 1, 2021 | Technology
This article is contributed. See the original author and article here.
This blog introduces troubleshooting steps for the issue that stateless/stateful services cannot be started in service fabric as well.
Customer could read this information and follow up the troubleshooting steps to identify the exception and the issue events when stateless and stateful try to start.
Stateless and Stateful Service Lifecycle
The lifecycle of a stateless service is straightforward. Here’s the order of events:
1. The service is constructed.
2. Then, in parallel, two things happen:
* StatelessService.CreateServiceInstanceListeners() is invoked and any returned listeners are opened. ICommunicationListener.OpenAsync() is called on each listener.
* The service’s StatelessService.RunAsync() method is called.
3. If present, the service’s StatelessService.OnOpenAsync() method is called. This call is an uncommon override, but it is available. Extended service initialization tasks can be started at this time.
Stateful services have a similar pattern to stateless services, with a few changes. For starting up a stateful service, the order of events is as follows:
1. The service is constructed.
2. StatefulServiceBase.OnOpenAsync() is called. This call is not commonly overridden in the service.
The following things happen in parallel:
* StatefulServiceBase.CreateServiceReplicaListeners() is invoked.
* If the service is a Primary service, all returned listeners are opened. ICommunicationListener.OpenAsync() is called on each listener.
* If the service is a Secondary service, only those listeners marked as ListenOnSecondary = true are opened. Having listeners that are open on secondaries is less common.
* If the service is currently a Primary, the service’s StatefulServiceBase.RunAsync() method is called.
3. After all the replica listener’s OpenAsync() calls finish and RunAsync() is called, StatefulServiceBase.OnChangeRoleAsync() is called. This call is not commonly overridden in the service.
Events and Cancellation Token
CreateServiceInstanceListener is to supply the communication listeners for the service instance, it is normally override in stateless service like using Kestrel , https and so on.
RunAsync() is executed in its own task. Note that in the code snippet above, we jumped right into a while loop. There is no need to schedule a separate task for your workload. Cancellation of your workload is a cooperative effort orchestrated by the provided cancellation token. The system will wait for your task to end (by successful completion, cancellation, or fault) before it moves on. It is important to honor the cancellation token, finish any work, and exit RunAsync() as quickly as possible when the system requests cancellation. It will be triggered for stateful primary replica or all stateless instances and normally override in stateful service.
Cancellation token is provided to coordinate when your service instance needs to be closed. In Service Fabric, this open/close cycle of a service instance can occur many times over the lifetime of the service as a whole. This can happen for various reasons, including:
* The system moves your service instances for resource balancing.
* Faults occur in your code
* The application or system is upgraded.
* The underlying hardware experiences an outage.
Troubleshooting
Please follow up below steps to idenify the exception method:
1. RDP to service fabric node. (primary replica node if it is stateful service)
2. Check Application event logs for any exception if no exceptions go to step 3.
3. Check if the port is occupied by the other services.
For TCP: Get-Process -Id (Get-NetTCPConnection -LocalPort YourPortNumberHere).OwningProcess
For UDP: Get-Process -Id (Get-NetUDPEndpoint -LocalPort YourPortNumberHere).OwningProcess
4. For non-prod environment, remote debug would be helpful to get more insight, please ref more details via Debug your application in Visual Studio
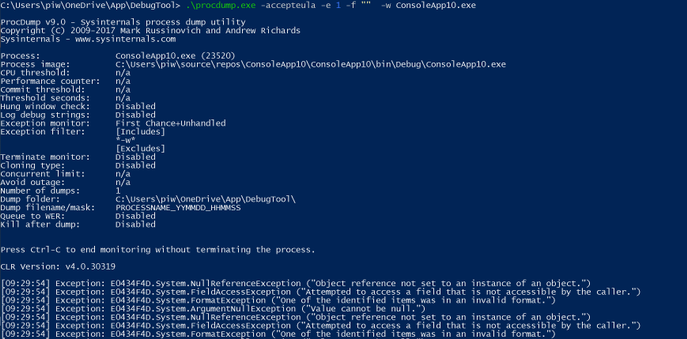
5. List underlying exceptions and capture dump via procmon
Start-bitstransfer “https://download.sysinternals.com/files/Procdump.zip“
procdump.exe -accepteula -e 1 -f “” -w “processname”
6. Then capture the dump for specific exception.
procdump.exe -ma -e 1 -f “NullReferenceException” -w “processname”
7. Use Windbg, Debugdiag to get details about exception like method call stack.

by Contributed | Mar 1, 2021 | Technology
This article is contributed. See the original author and article here.
Part I – Troubleshooting 4xx Errors
Debugging and Troubleshooting Overview
The API Management is nothing but a proxy which help to forward the request from client side to destination API service. It has the ability to modify the request or process based on the inputs from the client side before it reaches the destination. In an ideal scenario, APIs configured within an APIM service are expected to return successful responses (mostly 200 OK) along with the accurate data that is expected from the API.
In case of failures, you may see an incorrect response code along with a precise error message of what went wrong during the API call.
However, there may be scenarios where you may observe API requests failing with generic 4xx or 5xx errors without a detailed error message, and it could be difficult to narrow down or isolate the source of the error.
In such cases, the first point is to isolate whether the error code is thrown by APIM or the backend configured by the APIM. This proves to be an important method as most of the error codes are generated by the backend and APIM being a proxy forwards the response (error codes) back to the users who initiated the request. This makes the user think that the error code is thrown from the APIM.
Troubleshooting Azure APIM Failed Requests
Let’s suppose you have initiated an API request to your APIM service and the request eventually fails with a “HTTP 500 – Internal Server Error” message.
With generic error messages such as above, it becomes very difficult to isolate the cause or the source of the failed API request since there are several internal and external components that participate during an API invocation process.
- If responseCode matches backendResponseCode, then there is an issue with the backend and we should troubleshoot the backend configured with the APIM
- If responseCode does not match backendResponseCode and errorReason is empty, then we should check if their policy logic is returning the error using inspector traces.
- If errorReason is not empty, it’s a problem in APIM and the troubleshooting of error codes can help to resolve the issue.
Inspector Trace
If the issue is reproducible on demand, then your best option would be to enable tracing for your APIM API requests. Azure APIM services have the option of enabling the “Ocp-Apim-Trace” for your API requests. This generates a descriptive trace containing detailed information that helps you inspect the request processing step-by-step in detail and gives you a head-start on the source of the error.
Reference: https://docs.microsoft.com/en-us/azure/api-management/api-management-howto-api-inspector
Diagnostic Logging to Azure Monitor Log Analytics
You could also enable diagnostic logging for your APIM services. Diagnostic Logs can be archived to a storage account, streamed to an Event Hub resource, or be sent to Azure Monitor Log Analytics logs which could be further queried as per the scenario and requirement.
These logs provide rich information about operations and errors that are important for auditing as well as troubleshooting purposes. The best part about the diagnostic logs is that they provide you with granular level per-request logs for each of your API requests and assist you with further troubleshooting.
Reference Article: https://docs.microsoft.com/en-us/azure/api-management/api-management-howto-use-azure-monitor#resource-logs
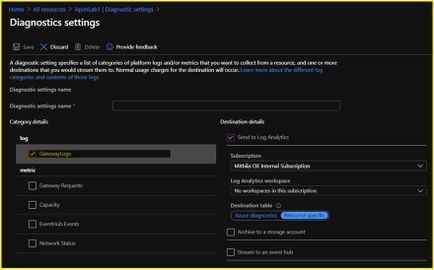
While storage accounts and event hubs work as single targeted destinations for diagnostic log collection/streaming, if you choose to enable APIM diagnostic settings with the destination as Log Analytics Workspace, you would be offered with the below 2 modes of resource log collection:
- Azure diagnostics – Data is written to the AzureDiagnostics table, which collates diagnostic information from multiple resources of different resource types.
- Resource specific – Data is written to individual table for each category of the resource. For APIM, the logs would be ported to ApiManagementGatewayLogs table
Reference Article: https://docs.microsoft.com/en-us/azure/azure-monitor/platform/resource-logs#send-to-log-analytics-workspace
If you want the resource logs to be ported to the ApiManagementGatewayLogs table, you would have to choose the option ‘Resource specific’ as highlighted in the sample screenshot below:
Below are the sample diagnostic logs generated on the Log Analytics Workspace. These logs would provide granular level details for your API requests such as the timestamp, request status, api/operation id, time taken values, caller/client IP, method, url invoked, backend url invoked, response code, backend response code, request size, response size, error source, error reason, error message, et cetera.

NOTE: Post initial configuration, it may take a couple of hours for the diagnostic logs to be streamed to the destination by the resource provider.
Depending on your mode of log collection, here are a few sample queries that could be used for querying the logs pertaining to diagnostic data for your API requests. You can also choose to filter through the logs by fine-tuning the query to retrieve data specific to an API ID or specific to a response code, et cetera.
Maneuver to Azure Portal a APIM service a Logs blade under “Diagnostic Settings” section to execute the queries
AzureDiagnostics
| where TimeGenerated > ago(24h)
| where_ResourceId == “apim-service-name”
| limit 100
ApiManagementGatewayLogs
| where TimeGenerated > ago(24h)
| limit 100
Log to Application Insights
Another option is to integrate APIM service with Application Insights for generating diagnostic log data.
Integration of APIM with Application Insights – https://docs.microsoft.com/en-us/azure/api-management/api-management-howto-app-insights
Below is a sample query that can be used for querying the “requests” table that can retrieve the diagnostic data concerned with Azure APIM API requests
Maneuver to the respective Application Insights resource a Click on Logs under “Monitoring” section.
requests
| where timestamp > ago(24h)
| limit 100
Alternatively, the error handling in APIM can be carried out using the API management error handling policy – https://docs.microsoft.com/en-us/azure/api-management/api-management-error-handling-policies
Now that we have enabled diagnostic logs in order to retrieve details about the different types of errors and errors messages for failed API requests, let’s walk through a couple of commonly observed 4xx and 5xx errors with APIM services.
This troubleshooting series focuses on
- Capturing some of the common 4xx and 5xx errors observed while making API requests using Azure APIM services.
- Providing guidance to APIM users as to how can they debug or troubleshooting API requests that fail with these errors.
- Possible solutions for fixing some of the commonly observed 4xx and 5xx errors.
Troubleshooting 4xx and 5xx errors with APIM services
The very first pivotal step with troubleshooting failed API requests is to investigate the source of the response code that is being returned.
If you have enabled diagnostic logging for your APIM service, then the columns “ResponseCode” and “BackendResponseCode” would divulge this primary information.
If the 4xx or the 5xx response being returned to the client is primarily being returned by the backend API (review “BackendResponseCode” column), then the issue has to troubleshoot more often from the backend perspective since the APIM service would then forward the same response back to the client without actually contributing to the issue.
4xx Errors:
Error code: 400
Scenario 1
Symptoms:
The API Management has been working fine during its implementation. It is now throwing a ‘400 Bad Request’ when invoked using the ‘Test’ option under the API Management in Azure portal. While accessing it using a client app or application, the desired result is yielded.
Troubleshooting:
Now, from the above scenario, we understand that the API is throwing a ‘400 Bad Request’ when invoke only from API Management under the Azure portal.

But the other method of invoking is yielding results. The error message clearly states that the endpoint could not be resolved. In case, if it was an issue with the endpoint, then the issue should occur across the invoking methods of the API. Since it is not our case, let us try verifying the endpoint. You can either try to resolve the endpoint from the same machine using command prompt or try a ping test.
Resolution:
In this kind of scenario’s, it is always recommended to check if the API Management is present within a Virtual Network and also notice that it will be configured in the internal mode.
As per the official documentation, “The Test console available on the Azure Portal will not work for Internal VNET deployed service, as the Gateway Url is not registered on the Public DNS. You should instead use the Test Console provided on the Developer portal.”
Scenario 2
Symptoms:
While invoking the API present under the API Management, we encounter ‘Error: The remote server returned an error: (400) Invalid client certificate’.
Troubleshooting:
Let us analyze the scenario,
This issue occurs when the customer has implemented mutual client certificate authentication, in this case client should pass the valid certificate as per the condition written in the policy
<policies>
<inbound>
<base />
<choose>
<when condition="@(context.Request.Certificate == null || !context.Request.Certificate.Verify() || context.Request.Certificate.Issuer.Contains("*.azure-api.net") || !context.Request.Certificate.SubjectName.Name.Contains("*.azure-api.net")
|| context.Request.Certificate.Thumbprint != "4BB206E17EE41820B36112FD76CAE3E0F7104F36") ">
<return-response>
<set-status code="403" reason="Invalid client certificate" />
</return-response>
</when>
</choose>
</inbound><backend><base />
</backend><outbound><base /></outbound><on-error>
<base /></on-error>
</policies>
To check whether the certificate is passed or not we can enable the ocp-apim-trace. The below trace shows that no client certificate received.

Resolution:
Issue resolved after adding the valid client certificate.

Similar Scenario’s:
Scenario 3
Error Reason: OperationNotFound
Error message: Unable to match incoming request to an operation.
Error Section: Backend
Resolution:
Make sure that the operation which is invoked for the API is configured or present in the API Management. If not, add the operation or modify the request accordingly.
Scenario 4
Error Reason: ExpressionValueEvaluationFailure
Error message: Expression evaluation failed. EXPECTED400: URL cannot contain query parameters. Provide root site url of your project site (Example: https://sampletenant.sharepoint.com/teams/sampleteam )
Error Section: inbound
Resolution:
Ensure that the URL contains only the query parameter defined in the API according to the configuration in the API Management. Any mismatch might lead to such error messages. For example, if the expected input value is integer and we supply a string, this scenario might lead to the error.
Error code: 401 – Unauthorized issues
Scenario 1
Symptoms: The Echo API suddenly started throwing HTTP 401 – Unauthorized error while invoking the operations under it.
Message-
HTTP/1.1 401 Unauthorized
{ “statusCode”: 401, “message”: “Access denied due to missing subscription key. Make sure to include subscription key when making requests to an API.”}
{
“statusCode”: 401,
“message”: “Access denied due to invalid subscription key. Make sure to provide a valid key for an active subscription.”
}
Troubleshooting:
- To get access to the API, developers must first subscribe to a product. When they subscribe, they get a subscription key that is sent as a part of request header that is good for any API in that product. Ocp-Apim-Subscription-Key is the request header sent for the subscription key of the product that is associated with this API. The key is filled in automatically.
- Regarding error Access denied due to invalid subscription key. Make sure to provide a valid key for an active subscription, it’s clear that you are sending a wrong value of Ocp-Apim-Subscription-Key request header while invoking Create resource and Retrieve resource operations.
- You can check your subscription key for a particular product from APIM Developer portal by navigating to Profile page after sign-in as shown below.
- Select the Show button to see the subscription keys for respective products you have subscribed to.

- If you check the headers being sent from Test tab, you notice that the value of Ocp-Apim-Subscription-Key request header is wrong. You might be wondering how come that is possible, because APIM automatically fills this request header with the right subscription key.
- Let’s check the Frontend definition of Create resource and Retrieve resource operations under Design tab. Upon careful inspection, you would notice that these operations got a wrong hard-coded value of Ocp-Apim-Subscription-Key request header added under Headers tab.
- You can remove it, this should resolve the invalid subscription key problem, but still you would get missing subscription key error.
You may get the following error message:
HTTP/1.1 401 Unauthorized
Content-Length: 152
Content-Type: application/json
Date: Sun, 29 Jul 2018 14:29:50 GMT
Vary: Origin
WWW-Authenticate: AzureApiManagementKey realm=”https://pratyay.azure-api.net/echo”,name=”Ocp-Apim-Subscription-Key”,type=”header” {
“statusCode”: 401,
“message”: “Access denied due to missing subscription key. Make sure to include subscription key when making requests to an API.”
}
- Go to the Echo API settings and check if it is associated with any of the available products. If not, then you must associate this API with a product so that you get a subscription key.
Resolution:
Developers must first subscribe to a product to get access to the API. When they subscribe, they get a subscription key that is good for any API in that product. If you created the APIM instance, you are an administrator already, so you are subscribed to every product by default.
Error code: 401 Unauthorized issues
Scenario
Symptoms:
The Echo API has enabled OAuth 2.0 user authorization in the Developer Console. Before calling the API, the Developer Console will obtain an access token on behalf of the user from Authorization header in the Request.
Message :

Troubleshooting:
- To troubleshoot the scenario, we would start with checking the APIM inspector trace. We can also find the Ocp-Apim-Trace link from the response.
- We notice the existence of a “JWT Validation Failed : Claim Mismatched” message in the traces which is unable to decode the header token provided.

- To check the scope of the “JWT Validation” policy, select the Calculate effective policy button. If you don’t see any access restriction policy implemented at any scopes, next validation step should be done at product level, by navigating to the associated product and then click on Policies option.
 <inbound>
 <base />
        <validate-jwt header-name="Authorization" failed-validation-httpcode="401" failed-validation-error-message="Unauthorized. Access token is missing or invalid.">
          <openid-config url="https://login.microsoftonline.com/common/v2.0/.well-known/openid-configuration" />
           <required-claims>
        <claim name="aud">
             <value>bf795850-70c6-4f22- </value>
        </claim></required-claims>
        </validate-jwt>
 </inbound>
Resolution:
The claim name provided in the Claim section does not match with the APP registered in the AAD.
Provide the Client app registered Application ID in the Claims section to fix the authorization error.
After providing the valid app id, the HTTP response results with HTTP/1.1 200 OK.
Error code: 403 – Forbidden issues
Symptoms:
GetSpeakers API operation fetches the details of speakers based on the value provided in the parameter. After few days of using it, The Operation started throwing HTTP 403- Forbidden error whereas the other operations are working fine as expected.
Message:
HTTP/1.1 403 Forbidden
{
“statusCode”: 403,
“message”: “Forbidden”
}
Troubleshooting:
- To troubleshoot the scenario, we would start with checking the APIM inspector trace. We can also find the Ocp-Apim-Trace link from the response

We notice the existence of a “ip-filter” policy that filters(allow/denies) call from specific IP address ranges.

- To check the scope of the ‘ip-filter’ policy, select the Calculate effective policy button. If you don’t see any access restriction policy implemented at any scopes, next validation step should be done at product level, by navigating to the associated product and then click on Policies option.
<inbound>
    <base /><choose>
      <when condition="@(context.Operation.Name.Equals("GetSpeakers"))">
            <ip-filter action="allow">
               <address-range from="13.66.140.128" to="13.66.140.143" />
           </ip-filter>
        </when></choose>
</inbound>
Resolution:
HTTP 403 – Forbidden error can be thrown when there is any access restriction policy implemented.
As we can see the IP address is not whitelisted in the error screenshot, we need to allow the IP address in the Policy to make it work.
Before:
<ip-filter action="allow">
      <address-range from="13.66.140.128" to="13.66.140.143" />
 </ip-filter>
After:
<ip-filter action="allow">
      <address>13.91.254.72</address>
      <address-range from="13.66.140.128" to="13.66.140.143" />
 </ip-filter>
Once we allow the IP address in the IP-Filter Policy we would be able to receive the response.
Error code: 404
Symptoms:
The Demo API is being invoked by either of the means below,
– Developer portal
– ‘Test’ option under API Management
– Client app like PostMan
– Using user code
The result of the call is a 404 Not Found error code.
Troubleshooting:
Make sure that the issue is existing to proceed with the troubleshooting steps.
Note: The API Management is not present in any Virtual Network which eliminates the option of Network elements causing the issue.
According to the API Management configuration, below are the settings
Name of the API – Demo API
Web Service URL – http://echoapi.cloudapp.net/api
Subscription Required – Yes
Below is the error scenario for the 404 error code using the API Management and the PostMan.
Postman:

API Management portal:

Based on the trace file, we can see that the error code is thrown from the forward-request section and we do not obtain much insights from it.
The configured web service URL is also reachable, and it displays us a visible content.
Web Service URL:

Hence, we proceed on collecting the browser trace while replicating the issue in the API Management section in Azure portal.
Steps to collect browser trace:
– Replicate the issue in the browser (chrome, steps for other browsers might differ slightly)
– Press F12 and navigate to the network tab.
– Make sure that the actions are recorded.
– Right click on any one of the actions and select the last option (Save all as HAR with content).
From the trace, we could see the below information which is show in preview state.

The Requested URL does not lead to a proper content over the mentioned Web Service URL. This is the reason that though the Web Service URL is reachable, the API was still throwing a 404 Not found error code when it was invoked.
Resolution:
Make sure that the Web Service URL leads to a valid destination which helps in the issue resolution. The best approach is to create a proper backend structure which hosts the APIs and then map it to the respective API of the API Management and not vice versa.
The following pointers are the main reason to encounter a 404 Not found error message from an API Management.
- You might hit the wrong http Method, (for example, the operation might be POST but you are calling it as GET.)
- You might be calling a wrong URL (that either has a suffix or wrong operation path).
- You might be using a wrong protocol (HTTP/HTTPS).
In our case, the error is in correspondence with the second point where the configured URL is not pointing to the destination. This has been confirmed by the Browser trace too and hence correcting the URL/path will resolve the issue.
Continue Reading 5xx Error Series

by Contributed | Mar 1, 2021 | Technology
This article is contributed. See the original author and article here.
Part II – Troubleshooting 5xx Errors
This is a continuation of troubleshooting series for 5xx errors. You can find the link of 4xx here.
In the below section, we are referring to the diagnostic logs present under the Log Analytics ApiManagementGatewayLogs when we quote “Diagnostic/Gateway Logs”
Scenario 1: Http Error code 500 with BackendResponseCode logged as 500
Symptom:
A certain API call fails with the error message “500 – Internal Server Error” as highlighted below.
The diagnostic log for this specific failure indicates 500 for the value of the column BackendResponseCode
Cause:
Under the diagnostic logs, if you observe the BackendResponseCode value logged as 500, it means that the backend API has returned a 500 response to the APIM service.
In scenarios where the backend API itself has returned a status code 500 for the incoming request, the APIM service would forward the same response back to the client
Resolution:
The issue would further have to be investigated from the backend API perspective and the backend API provider has to verify why are the backend servers returning the HTTP 500 errors.
Scenario 2: Expression Value Evaluation Failures
Symptom:
Few API requests may return a 500 response code due to failures in the evaluation of the policy expression that the API request invokes.
The error message would be logged as follows:
“ExpressionValueEvaluationFailure: Expression evaluation failed. Object reference not set to an instance of an object.”

Cause:
This error normally occurs due to a “NullReferenceException” wherein you attempt to read a parameter value that hasn’t been defined yet or is set to null.
The ErrorSource column in the diagnostic logs would indicate the name of the policy that is causing the error during the evaluation.
Resolution:
Recommendation is to revisit the policy definition for the API operation which fails evaluation during request processing and fix the null reference exception.
Scenario 3: APIM Client Connection Failure with response code 0 or response code 500
Symptom:
In the gateway logs, you may observe scenarios where the:
- Response code column contains either a 0 or 500 response
- Error Reason column contains the value “ClientConnectionFailure” logged
- Error Message column contains error messages such as “The operation was cancelled, “A task was cancelled”, et cetera.

Cause:
The term ‘Client Connection Failure’ essentially means that the client application (which initiated the API call) terminated the connection with the APIM service even before the backend API could revert with the expected response for the incoming API call and APIM could forward the same back to the client.
It basically implies that the client abandoned the request before the response could be received. APIM has no control over when or why the client decides to abandon the request.
These failures generally occur when the request is taking too long to complete so the client either gives up (a user may close the browser) or the client application may have a time out.
Here a few possible causes for such failures:
- Issues with client network
- Azure Virtual Network stability
- Issues with client application
- Low time-out value in client application
- Increased request processing time
- The Backend API takes abnormally long to respond (possibly due to large payload)
Most of the time, you can observe from the diagnostic logs that the clientTime values for these requests are quite high and contribute to most of the totalTime.
In order to explain what these fields indicate:
- totalTime – Total time for the request measured from the first byte received to last byte sent to the client. This includes backend roundrip and client ability to read.
- backendTime – Number of milliseconds spent on overall backend IO (connecting, sending, and receiving bytes). If this time is high, it means the backend is slow and the performance investigation needs to be focused there.
- clientTime – Number of milliseconds spent on overall client I/O (connecting, sending, and receiving bytes). If this time is high, the client bandwidth or processing might not allow to read response fast.
Resolution:
In most scenarios, Client Connection Failures primarily have to be investigated further from a client perspective since it is the client that essentially terminates the connection with the APIM service.
Few possible suggestions are increasing the Timeout value at the client end, decrease the response processing time, et cetera which depend from scenario to scenario.
Additionally, using the diagnostic logs, you can also find the specific process during which the client abanonds the request by looking into the ErrorSource column.
For example,
- If the column contains the value “forward-request”, it means that the client terminated the connection while the APIM service was still forwarding the request to the backend API
- If the column contains the value “transfer-response”, it means that the client terminated the connection while the APIM service had received the response from the backend API and was forwarding it back to the client.
Scenario 4: APIM Backend Connection Failures
The APIM service logging “BackendConnectionFailure” under the ErrorReason column in the diagnostic logs essentially indicates that the APIM service failed to establish a connection with the backend API.
This error could be happen due to various reasons and with multiple types of error messages.
Few of the commonly observed error messages for Backend Connection Failures are listed down below. The corresponding error message for the failure would be logged under the ErrorMessage column in the diagnostic logs.
Scenario 5: Unable to connect to the remote server
Symptom:
API requests fail with Backend Connection Failure with the below error message highlighted in the Ocp-Apim traces/diagnostic logs

Cause and Resolution:
The error “Unable to connect to the remote server” normally occurs due to the below reasons:
- APIM performance/capacity issues.
- SNAT port exhaustion on the APIM VMs
- There is an additional network device (like a firewall) that is blocking the APIM service from communicating with the backend API
- Backend API isn’t responding to the APIM requests (backend down or not responding)
- Network issues/latencies between the APIM service and the backend.
Using the Capacity dashboard on the Metrics blade of the APIM service, you can verify whether there have been any abnormal fluctuations with the average capacity which could have possibly contributed to the issue.
SNAT Port Exhaustion is a hardware specific failure.
The following document highlights that the max concurrent requests from APIM to a back-end is 1024 for the developer tier and 2048 for the other tiers.
https://docs.microsoft.com/en-us/azure/azure-resource-manager/management/azure-subscription-service-limits#api-management-limits
Let’s take the example of a Developer Tier service to understand what this means.
The Developer Tier is an APIM service where the APIM service is hosted on a single underlying VM/node/host machine.
Each VM is internally assigned 1024 SNAT ports for communication. Hence, in case of the Developer tier you cannot have more than 1024 outbound connections to the same destination at the same time (concurrent connections). If the number exceeds beyond 1024 outbound connections (possibly due to huge influx of incoming requests) the service will encounter SNAT port exhaustion issues and will fail to establish a connection with the backend server.
NOTE: You can have more than 1024 connections at the same time if the destinations are different (not concurrent).
If it has already been verified that the issue has not occurred due to either capacity issues or SNAT failures, then the issue could possibly be occurring because either the backend API was down, unavailable to establish connection with the APIM service or was terminating the connection due to network latencies between the APIM service and the backend
In order to confirm this, you would have to collect network traces from the underlying VMs/nodes hosting the APIM service while the issue is being reproduced and then analyze the traces for establishing the point of failure.
In most scenarios, you can observe from the diagnostic logs that the “BackendTime” was almost equal to or greater than 21 seconds for all the failed requests and contributed to most of the “totalTime”.
This indicates possibilities of a TCP connection failure to the backend (21 seconds is the usual TCP timeout). APIM tried to engage with the backend, but there was no response from the backend. So, the connection timed out after 21 seconds and a HTTP Status Code 500 was returned, which indicates that the backend server was down or was not responding to connection requests or was unable to maintain the connection.
Scenario 5: The underlying connection was closed: A connection that was expected to be kept alive was closed by the server.
Symptom:
API requests fail with Backend Connection Failure with the below error message highlighted under the errorMessage section in the diagnostic logs
“The underlying connection was closed: A connection that was expected to be kept alive was closed by the server.”
Cause:
This is usually caused by a known APIM issue.
APIM keeps connections to the backend open for as long as possible so it can re-use them and so that it doesn’t have to perform TCP/SSL handshakes to establish new connections every time, which has a negative impact on performance. However, if a connection doesn’t get used for a certain period of time due to low/no activity (4 minutes), the internal Azure Load Balancer silently drops the connection. When this happens, if APIM tries using the dropped connection next time, the connection fails and the above error message gets logged.
Resolution:
This can be avoided by using the retry logic in APIM.
Reference: APIM Retry Policy – https://docs.microsoft.com/en-us/azure/api-management/api-management-advanced-policies#Retry
Scenario 6: The remote name could not be resolved
Symptom:
API requests fail with Backend Connection Failure with the below error message highlighted under the errorMessage section in the diagnostic logs:
“The remote name could not be resolved”

Cause:
When one machine has to connect to another machine, it has to perform DNS name resolution.
The above error indicates that APIM wasn’t able to convert the hostname of the backend (e.g. contoso.azurewebsites.com) to an IP address and couldn’t connect to it.
The most frequent cause for this error is using an incorrect hostname while setting up the API configuration. If the service is in a VNET and is using custom DNS, it could mean that custom DNS server was unavailable or did not contain a record for the backend that APIM is attempting to connect to.
Resolution:
Accordingly, the issue has to be troubleshot from a network perspective as per the dependent scenario. The most reliable method of isolating the issue and zeroing down on the exact cause is analysis of network traces for sample failures.
Scenario 7: The underlying connection was closed: Could not establish trust relationship for the SSL/TLS secure channel
Symptom:
API requests fail with Backend Connection Failure with the below error message highlighted under the errorMessage column in the diagnostic logs:
“The underlying connection was closed: Could not establish trust relationship for the SSL/TLS secure channel”
Cause:
This error is normally encountered when the backend has been configured to use a self-signed certificate instead of using a publicly trusted root CA certificate.
APIM services are hosted in the Azure infrastructure using PaaS VMs that run on Windows OS.
Hence, every APIM instance trusts the same default Root Certificate Authorities that all windows machines trust.
The list of trusted Root CAs can be downloaded using the Microsoft Trusted Root Certificate Program Participants list – https://docs.microsoft.com/en-us/security/trusted-root/participants-list
Resolution:
There are 2 possible solutions for resolving this issue:
- Add a valid trusted root CA certificate that resolves to a Microsoft Trusted Root Participant list.
- Disable certificate chain validation in order for APIM to communicate with the backend system. To configure this, you can use the New-AzApiManagementBackend (for new back end) or Set-AzApiManagementBackend (for existing back end) PowerShell cmdlets and set the -SkipCertificateChainValidation parameter to True.
Below is the sample PowerShell command:
$context = New-AzApiManagementContext -resourcegroup 'ContosoResourceGroup' -servicename 'ContosoAPIMService'

New-AzApiManagementBackend -Context  $context -Url 'https://contoso.com/myapi' -Protocol http -SkipCertificateChainValidation $true
References for creating/updating backend entity:
Scenario 8: Unable to read data from the transport connection: The connection was closed.
Symptom:
API requests fail with Backend Connection Failure with the below error message highlighted under the errorMessage column in the diagnostic logs:
“Unable to read data from the transport connection: The connection was closed.”
Cause:
This error occurs when the APIM service is still trying to read the response from the backend, but the connection was suddenly aborted.
The process by which an APIM service transfers a response to the client is highlighted below:
APIM reads the response status code and header first. The payload will stay in network stream.
Once the header and the status code is received, then APIM will stream across the response body from the backend service to the client.
While the data stream is underway, if any exception is encountered, then the above error message is logged.
Resolution:
Users can implement the retry logic in APIM for avoiding this error:
Reference: APIM Retry Policy – https://docs.microsoft.com/en-us/azure/api-management/api-management-advanced-policies#Retry
Scenario 9: The underlying connection was closed: The connection was closed unexpectedly
Symptom:
API requests fail with Backend Connection Failure with the below error message highlighted under the errorMessage column in the diagnostic logs:
“The underlying connection was closed: The connection was closed unexpectedly”
Cause:
This error occurs when either the APIM service or the backend service abruptly terminates the connection while the communication between the APIM service and the backend was still underway.
Resolution:
In order to isolate the source of the issue and resolve the same, the scenario would require collection of network traces from the underlying VMs/nodes hosting the APIM service while the issue is being reproduced and then analyze the traces for establishing the point of failure.
Implementing retry logic may help to some extent if the frequency of the issue is highly rare.
Error Code: 501
Scenario 1: Not Implemented
Symptom:
Sometimes, you can observe API requests fail with HTTP 501 errors with either of the below error messages highlighted under the errorMessage column in the diagnostic logs:
NOTE: This is not an exhaustive list and the error message would depend on the actual cause:
- “Header BPC was not found in the request. Access denied.”
- “Unable to match incoming request to an operation.”
- “Header RegionID was not found in the request. Access denied.”
Cause:
This is not a rarely observed error with the usage of APIM services.
The above HTTP server error response code means that the server does not support the functionality required to fulfill the request.
In APIM terms, if the client makes a request to the server but the server finds the request as inappropriate since it does not support the feature/method to process the request, then it could return a 501 response to the caller.
Reference: https://www.checkupdown.com/status/E501.html
The server returning the 501 response in this scenario would be the
- Backend if the BackendResponseCode in the logs is 501. APIM would return the same response to the client.
- APIM service if the ResponseCode is 501 and BackendResponseCode is either blank or 0 in the diagnostic logs.
Resolution:
In case it’s the APIM service which returns a 501 response and not the backend, a very popular occurrence is where APIM logs the following error message – “Unable to match incoming request to an operation” for which both the API configuration within the APIM service as well as the request formation and invocation processes have to be reviewed at client-side as per the scenario.
Or there are also possibilities where the 501 error code is being returned by a policy effect that is being evaluated during request processing. If that is the case, you would find the corresponding policy name highlighted under the “ErrorSource” column in the diagnostic logs.
Resolution:
The best option in such scenarios is to collect Ocp-Apim Trace which would retrieve detailed request processing details and assist isolating the point of failure.
Error Code: 502
Scenario 1: Bad Gateway
Cause/Resolution:
APIM services forwards a 502 Bad Gateway response to the client in case of Backend Connection Failures.
Hence, the troubleshooting and debugging remain the same as the Backend Connection Failures section documented above and is dependent on the details observed under the “ErrorMessage” column in the diagnostic logs.
The most commonly found error message logged by APIM for a 502 response is “The remote name could not be resolved”
Error Code: 503
Scenario 1: Service Unavailable
Symptom:
Sometimes, you can observe API requests failing with HTTP 503 errors and the error message indicating that the Service is Unavailable.
Below is a sample error message observed on Postman while attempting to invoke an API

Cause:
503 responses are mostly returned by the backend servers amongst popular occurrences.
However, APIM services also return a 503 response to the client even before the request is forwarded to the backend in scenarios where there are certain policy effects being applied to the incoming request before forwarding it to the backend and the request is terminated due to the application/evaluation of the inbound policy effect.
Resolution:
Verify the “ErrorSource”, “ErrorReason” and “ErrorMessage” columns in such scenarios and proceed accordingly.
Error Code: 504
Scenario 1: Gateway Timeout
Cause/Resolution:
Below are some of the popular scenarios where APIM services return a 504 response to the client:
Scenario 1: The APIM service has waited too long to establish a connection with the backend server but the backend is not available or responding.
The troubleshooting performed remains the same as that of troubleshooting Backend Connection Failures highlighted above.
In the diagnostic logs, specifically look out for the sub-component time values and the columns “ErrorReason” and “ErrorMessage” in order to isolate the source of the issue.
Scenario 2: The backend service is taking too long for request processing leading to the APIM service terminating the connection. In such scenarios, you can observe under the diagnostic logs that the “BackendTime” is high when compared to the total time taken for request processing and consumes most of the total time.
There are 2 possible solutions for mitigating this issue:
Scenario 3: The timeout value configured for the APIM service within the <forward-request> policy is low.
Popular mitigation step is to Increase the timeout value of the APIM service under the <forward-request> policy section such that it is in tally with the average time taken by the backend for request processing.
NOTE: For APIM API request processing, the default timeout value imposed by APIM services is 300 seconds/5 minutes.
The default timeout value can be increased using the forward-request APIM policy – https://docs.microsoft.com/en-us/azure/api-management/api-management-advanced-policies#ForwardRequest
For “timeout”, the maximum value can be set to any valid integer, but as the above documentation states, the real maximum value is going to be around 240 seconds since values greater than 240 seconds may not be honored as the underlying network infrastructure can drop idle connections after this time.
Reference: https://docs.microsoft.com/en-us/azure/api-management/api-management-advanced-policies#attributes-1
![[UI Only] Event Trigger Renamed to Storage Event Trigger](https://www.drware.com/wp-content/uploads/2021/03/large-123-608x675.)
by Contributed | Mar 1, 2021 | Technology
This article is contributed. See the original author and article here.
As we public preview the new Custom Event Trigger, that processes and responds to Custom Topics in Event Grid, we are making one minor change to the beloved Event topic: we are renaming the trigger to Storage Event trigger, to better convey its use cases and capabilities.
Storage event trigger kick offs pipelines based on events such as the arrival or deletion of a file in your Azure Storage account. The trigger supports both Azure Data Lake Storage Gen2 and General-purpose version 2 storage accounts.
To create a Storage event trigger, in ADF UI portal, select Storage event in the trigger type drop down menu

Similarly, the monitoring tab is renamed to Storage Events under Trigger run monitoring page

3 Key points for renaming:
- The renaming only impacts UI experience: in that instead of selecting Event Trigger, customers should select Storage event trigger
- Renaming has no impact on existing triggers. Backward compatibility is guaranteed
- Renaming has no impact on JSON definitions, or SDK usage. For JSON definition, trigger type remains “BlobEventsTrigger“. SDK and JSON editing users will not be impacted by this change
by Contributed | Mar 1, 2021 | Technology
This article is contributed. See the original author and article here.
As ever more applications are built to be cloud native, services like Redis are essential to enable these applications to perform and scale under heavy loads. To allow developers to utilize the speed and flexibility of Redis without the hassle of operation, Azure offers Azure Cache for Redis, a fully managed Redis service. A third-party benchmark recently showed that Azure Cache for Redis can improve latency and throughput performance by up to 800% when added to existing Azure architectures. To build on this powerful technology, we announced an innovative collaboration with Redis Labs almost a year ago to bring their Redis Enterprise software to Azure as a part of Azure Cache for Redis. Customers both large and small have been excited to try the expanded capabilities during the preview, and developers have found novel ways to solve their application challenges with the offering. Today, we’re proud to announce the general availability of the Enterprise and Enterprise Flash tiers of Azure Cache for Redis.
What’s in the box?
The new Enterprise offerings enhance and expand the range of use cases for Redis today. Redis modules from Redis Labs, like RediSearch and RedisTimeSeries, enable new use-cases for Redis such as real-time search and IoT data ingestion. At the same time, the offering also improves your existing Redis experience by making caches larger, more resilient, and capable of being distributed around the globe. The powerful features available include:
- Active Geo-Replication (in Preview)
- Higher availability—architected for 99.99% with zone redundancy, and 99.999% with active geo-replication.
- Redis Modules, including
- RediSearch
- RedisBloom
- RedisTimeSeries
- The latest version of Redis—Redis 6.0
- Redis on Flash, using both DRAM and NVMe storage to enable cache sizes up to 13TB at a lower price per GB.
If you currently use Redis Enterprise on-prem, this offering allows you to enjoy many of your favorite features in a native Azure solution. Streamlined billing, familiar security and monitoring tools, and the ability to use your Azure spend commitment are all included. Even better, support for the Enterprise offering on Azure is backed all day, every day by the Microsoft support team, who have a direct line to the experts at Redis Labs if additional assistance is needed.
Active Geo-Replication
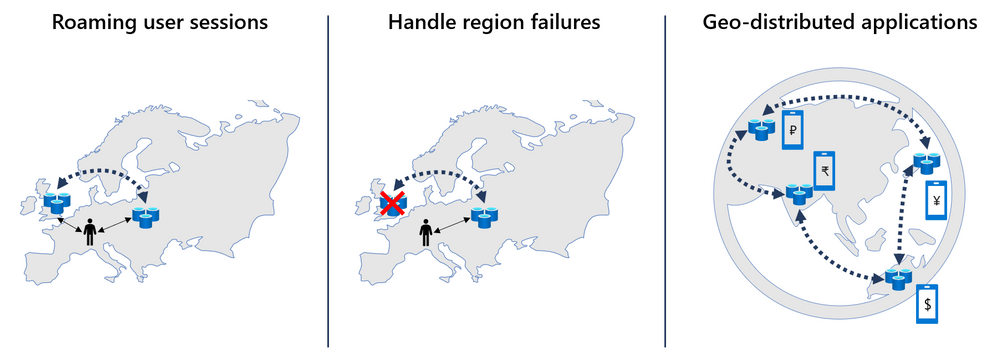
New in the Enterprise offering is a much-requested upgrade: the ability to geo-replicate data across caches in an active-active configuration. Now in preview, this feature allows data to be written locally in more than one region, with changes automatically replicated to and merged with other regions. Active geo-replication enables you to create a worldwide distributed cache with local latency access for users around the globe. This feature opens many exciting possibilities:
One key application is handling user sessions across regions. A huge advantage of Redis is the blazing-fast latencies gained from accessing data in-memory. If a user is far away from the data center holding the cache, however, this advantage is limited due to network latency. With active geo-replication, user session data can follow a user without complicated data management on the backend. The data is simply duplicated to the Redis instance in the closest data center, with all changes synchronized automatically.
Another important use case is with applications that are distributed worldwide. Active geo-replication greatly simplifies the data layer by reducing the need to manage geographies. For instance, a mobile game might have a worldwide leaderboard. Instead of developing infrastructure to share and rank scores between regions, high scores from each user can simply be written to a Redis sorted set that is distributed across regions worldwide. Through conflict-free resolution in active geo-replication, scores will be ranked seamlessly.
Increased Availability
One significant advantage of active geo-replication is that it makes a Redis deployment substantially more resilient to single-region failures. This, combined with the option to deploy Redis across multiple availability zones in a single region, provides two additional high-availability options. Deploying across availability zones gives up to 99.99% availability, while active geo-replication is designed for up to 99.999% availability—less than six minutes of downtime per year. This increased resiliency is essential to many retail and financial services customers who rely on Redis for inventory or pricing systems.

Redis Modules + Redis 6.0
The Redis Enterprise offering on Azure doesn’t just boost geographic distribution and availability, however. It also includes powerful features that enable new use cases. With the introduction of Redis 6.0, Azure Cache for Redis users gain access to the Redis Streams data type for the first time. Streams can be used to implement messaging systems, allowing Kafka-like functionality where clients can intelligently consume items from the stream. Three Redis Modules are additionally supported: RedisBloom, RediSearch, and RedisTimeSeries:

Customers like SitePro have already started using these highly-effective modules in their workflows, for example using RedisTimeSeries for IoT data ingestion:
“We are extremely excited about the added functionality in the Azure Cache for Redis, Enterprise Tiers. We know, love, and have used Redis for years as a key component in our industry leading real-time IoT control & monitoring platform. The Enterprise tiers allow us to do more with Redis by leveraging the RedisTimeSeries module to support data collection and analytics from hundreds of thousands of IoT sensors. “
-CEO and President

Learn More
Interested in learning more? Watch the session at Microsoft’s Ignite conference for a deeper dive and a demo of active geo-replication, and read the blog from Redis Labs.
Want to go ahead and give the new features a try? Read the documentation, and start your free Azure trial today.
by Contributed | Mar 1, 2021 | Technology
This article is contributed. See the original author and article here.
Update 1 of the Azure Sphere OS version 21.02 is now available for evaluation in the Retail Eval feed. This release fixes a security vulnerability discovered since the last release. This update will not restart the 21.02 evaluation period because the change will not impact any customer scenarios. The Retail feed will continue to deliver OS version 21.01 until we publish 21.02 later this week.
The evaluation release includes only an OS update; it does not include an updated SDK.
For more information on Azure Sphere OS feeds and setting up an evaluation device group, see Azure Sphere OS feeds and Set up devices for OS evaluation.
For self-help technical inquiries, please visit Microsoft Q&A or Stack Overflow. If you require technical support and have a support plan, please submit a support ticket in Microsoft Azure Support or work with your Microsoft Technical Account Manager. If you would like to purchase a support plan, please explore the Azure support plans.
by Contributed | Mar 1, 2021 | Technology
This article is contributed. See the original author and article here.
We continue to advocate for our learners to have a continuous learning mindset. This key principle is critical because cloud technologies are rapidly changing and it’s important to keep your skills current. Plus, maintaining an active certification can validate your up-to-date knowledge and your ability to perform in the job role. A couple months ago, we announced a new approach – free certification renewals – to reduce stress, complexity, and cost of keeping your certifications active.
Today, we’re proud to announce that 19 certifications are now available to renew on Microsoft Learn, with additional certifications following shortly. Within six months of your role-based or specialty certification expiring, you’re eligible to renew it by passing an online assessment – at no cost and on your own schedule. If you’re within the eligibility window, visit your Certification Dashboard to find more information about renewing your certification.
How can you prepare?
To help you prepare for the certification renewal assessment, we offer a curated collection of bite-sized learning content aligned to each assessment, and you can access it at any time – even before you’re eligible to renew your certification. Completing the collection is optional but we highly recommend it, especially if you’re not familiar with the latest technology updates. To understand what the assessment might include, you can review the skills measured section on the renewal page specific to your certification. Based on your assessment performance, we’ll also curate a personalized collection of learning content for you to save so you can learn which topics you might need to spend more time on.
When should you take the assessment?
Another key principle we’re adopting is to help learners keep their certification active with more flexibility and less friction. The eligibility window begins within six months before your certification expires, providing you the ability to complete the assessment online at a time that works best for you.
You may take the assessment as many times as you need to pass. If you don’t pass the first time, you may immediately attempt it again. After your second attempt, you must wait at least 24 hours before trying again. Keep in mind that you must pass the renewal assessment before your certification expires, otherwise the assessment will no longer be accessible and you’ll need to earn the certification again by passing the required exam (or exams). Be sure to factor this in as you plan to renew your certification. Note that the renewal assessment won’t be available to you prior to your eligibility window, but the learning collection will always be available so you can continuously learn and keep your skills up to date.
What if you have multiple certifications? To avoid renewing your certifications in the same week or month, you’ll have the flexibility to stagger your renewal assessment time frames, thanks to the six-month eligibility window. We recommend that you review the expiration dates for all certifications you currently have and plan your renewal assessment cadence accordingly. For example, if you have three certifications expiring in December, your eligibility window for all three certifications begins in June. You may decide to spread out your workload by taking one renewal assessment in June, another in August, and the third in October.
No matter when you pass the assessment, your certification will be extended by an additional year from its current expiration date. Note that if you have an expert-level certification for which an associate-level certification is a prerequisite, you only need to pass the assessment for the expert-level certification to renew it. Your associate-level certification needs to be renewed separately, and you need to follow the eligibility window based on when you earned that certification. In other words, you aren’t required to pass two renewal assessments to keep your expert-level certification active. If you choose to let your associate-level certification expire, you can keep your expert-level certification active by passing the renewal assessment for that certification only.
Exam updates and their impact on renewal
Renewal assessments are at the certification level and not for individual exams that lead up to the certification. Assessments are kept in sync with any changes made to the certification exams to help ensure that content and skills measured are aligned. If updates are made to the exam (or exams) that lead to a certification you already have, there’s no need to re-take the updated exam as changes will be reflected in the skills measured within the renewal assessment.
For example, if you earned a Microsoft Certified: Azure Administrator Associate certification by passing Exam AZ-103 initially, no action is required on your part to take the replacement Exam AZ-104. You only need to pass the certification renewal assessment to keep your certification active. If a certification retires altogether because the job role associated with it has evolved, the ability to renew the certification will no longer be available.
What about newly released certifications?
As we continue to invest in new certifications, we’ll also release associated renewal assessments and collections of learning content approximately six months after the certification has been in market. Additionally, renewal assessments will be updated periodically to reflect changes to the technology that impact the job role. To keep your certifications active, be sure to pass the assessment every year before your certification expires.
Find details on how to renew your Microsoft Certification. We’re excited to share the evolution of our certification program to help you validate your up-to-date skills with more flexibility while supporting you through your continuous learning journey.

Recent Comments