
by Contributed | Jun 30, 2021 | Technology
This article is contributed. See the original author and article here.
It’s hot in many parts of the world these days. We hit a sweltering 108° Fahrenheit here in the Pacific Northwest of the US. And the action isn’t cooling down for SharePoint and related technology in Microsoft 365. Grab a cool glass of water, June was a busy month.
Yes, June 2021 brought great new offerings: SharePoint Auto News Digest updates, SharePoint admin center updates (dashboard and new site information columns), Microsoft Lists – @mentions in comments, Power Apps can now display images from Microsoft Lists, Delete from within page details, Headspace mindfulness content comes to Microsoft Viva Insights, and more. Details and screenshots below, including our audible companion: The Intrazone Roadmap Pitstop: June 2021 podcast episode – all to help answer, “What’s rolling out now for SharePoint and related technologies into Microsoft 365?” Note: you might also hear a sea shanty tune from the OneDrive team in the mix – baton down the hatches and have ye a listen!
In the podcast episode, I chat with Rk Menon (LinkedIn), program manager on the SharePoint team focused on the SharePoint admin center experience and capabilities in Microsoft 365. We chat about the overall design goals of the SharePoint admin center, what new capabilities are rolling out for SharePoint admins, and how things align over time to ensure consistency across all admin user interfaces across Microsoft 365.
Rk Menon, program manager at Microsoft [Intrazone guest].
All features listed below began rolling out to Targeted Release customers in Microsoft 365 as of June 2021 (possibly early July 2021).
Inform and engage with dynamic employee experiences
Build your intelligent intranet on SharePoint in Microsoft 365 and get the benefits of investing in business outcomes – reducing IT and development costs, increasing business speed and agility, and up-leveling the dynamic, personalized, and welcoming nature of your intranet.
SharePoint Auto News Digest updates
Time to up your game when keeping everyone informed. This feature just keeps getting better, making it more efficient to convert news-to-views while requiring less manual effort.
You can now brand your news digest with your organization’s theme colors and logo. If your organization site is already branded, that branding will automatically be applied to automatic news digests. The news digest uses built-in Intelligent ranking so that users see the news most relevant to them. The news digest is sent on a weekly basis, displaying only published news posts. If there are no news posts that are relevant for the user then no email gets sent to the user.
 The SharePoint auto-news digest sends an automated, customized email to users about the latest news posts that are relevant to them, but that they may not have viewed yet.
If users want to opt-out of receiving the automatic digest, they can click the unsubscribe button at the bottom of the email.
- Roadmap ID: 70606
- Learn more.
- If your organization wants to turn off the feature at the tenant level, please use the following PowerShell command: Set-SPOTenant -EnableAutoNewsDigest $true | $false. To learn more about the PowerShell options, click here.
SharePoint admin center – new information columns on Active sites page
It’s time to see more information about your sites and be able to troubleshoot easier.
In the SharePoint admin center, the Active sites page will provide new informational columns. The “Created from” column will show the apps that were used to create sites. And the “Teams” column will show which sites are connected to Microsoft Teams. The “Created from” and “Teams” information will also be available in the details panel when you select an individual site.
 The ‘Created from’ and ‘Teams’ status columns provide key information for admins directly on the Active sites page.
Both new columns help narrow down troubleshooting and highlight actions admins might prescribe to their own customer base.
SharePoint admin center: new homepage insights dashboard
Take an administration-at-a-glance approach with actionable charts and insights as cards on the SharePoint admin center homepage. And it’s customizable—you can add, remove, and rearrange cards to suit your needs.
 Examine OneDrive and SharePoint usage and activity via insightful cards on the SharePoint admin home page.
As a SharePoint or Global admin, you can choose to see and use new cards such as:
- SharePoint storage usage
- SharePoint site usage
- SharePoint file activity
- OneDrive usage
- OneDrive file activity
- Search active sites
- Sensitivity labels
- Term store operations
You can also add relevant cards from the Microsoft 365 admin center, such as:
- Service health
- Message center
- Microsoft 365 active users report
Last, you’ll find recommendations tailored to each organization to guide you through improvement tasks that you may not know about – to help better manage and control your SharePoint environment in Microsoft 365 without require deep analysis or clicking to too many places to get the information.
A reminder: Prepare your SharePoint and OneDrive environment for end of support for Internet Explorer 11
Microsoft 365 apps and services will no longer support Internet Explorer 11 (IE 11) after August 17, 2021. This means SharePoint and OneDrive will not be supported on IE 11. After this date, customers will have a degraded experience or will be unable to connect to Microsoft 365 apps and services on IE 11.
While we know this change may be difficult for some, we believe that they will get the most out of Microsoft 365 apps when using the Microsoft Edge browser. Microsoft 365 users will be well served with this change through faster and more responsive web access to greater sets of features in everyday toolsets.
Teamwork updates across SharePoint team sites, OneDrive, and Microsoft Teams
Microsoft 365 is a universal toolkit for teamwork – to give you the right tools for the right task, along with common services to help you seamlessly work across applications. SharePoint is the intelligent content service that powers teamwork – to better collaborate on proposals, projects, and campaigns throughout your organization – with integration across Microsoft Teams, OneDrive, Yammer, Stream, Planner and much more.
Microsoft Lists – @mentions in comments
“Mention” people you work with while adding a new comment to a list Item. As a result, the person will receive an email notification with a direct link to the list item. It’s a terrific way to notify, share and collaborate directly from within the list itself.
 In the list item’s Comments box, type @ and a name, then pick the name you want.
Power Apps can now display images from Microsoft Lists
This is an improved experience so that images stored in Image columns in Microsoft Lists can be displayed when designing custom forms in the Power Apps design canvas. You can choose to display the images in four sizes: small, medium, large, or full.
 If you add one or more images to your list, you can show individual images directly in Power Apps – here using a Power Apps app to customize the view form.
- Roadmap ID: 81986.
- Learn more:
Delete from within page details
This is a simple one, and one that’s been met with a lot of joy from my purview – mainly due to the time-to-click ratio for performing this action. Instead of going several clicks in beyond the site contents page and into the Pages library, now you can click the Page details button at the top of the page or news article and delete in one click from within the page details pane.
 Click the Page details button at the top of the page or news article and delete in one click from within the page details pane.
Related technology
Headspace mindfulness content comes to Microsoft Viva Insights
You’ll start to see a curated set of guided meditations and focus music from Headspace. The goal is to help disconnect from work in the evening, relax your mind before a big meeting, or find focus before starting an important project. In just a few minutes a day, meditation and mindfulness with Headspace can help users lower stress, increase focus and ease teamwork.
Headspace integration with Viva Insights is rolling out default on and, unless disabled by admin, the curated set of Headspace mindfulness content will be available to any user with the Viva Insights app installed.
- Roadmap ID: 68748.
- Learn more.
- Note: To disable (admin control) the Headspace feature for select users, use the PowerShell cmdlets VivaInsightsSettings with feature name as Headspace.
Create trackable tasks from your ad hoc Teams messages
Tasks happen everywhere – in an email threads, working on files, or within team chats. And before you forget to make a note of a task, simply click in, and create tasks from Microsoft Teams messages on desktop and web. Like you’ve seen for emails in Outlook and comments in Word, Excel, and PowerPoint docs.
 Converting a Teams message into a task on desktop or web is super easy: hover over the message, select the ellipses (…) from the pop-out menu > More actions > Create task.
Note: This update is native to the Teams experience – no longer requiring custom work with Power Automate.
Microsoft Whiteboard updates within Microsoft Teams to support hybrid work
The new Whiteboard is now integrated into more areas across Microsoft 365 – now available in Teams channels and chats. Start a collaborative whiteboard for everyone in the meeting with just one click. You can also pre-prep or reuse whiteboards across multiple Teams meetings.
This update brings a lot of great user interface capabilities: improved real-time collaboration to make it easier to follow along with what others are doing, new interactive content with sticky notes, fluid components, and insert images and documents via new sharing controls connected to OneDrive. Plus, a lot more.
Ink in your ideas, together, during your next team meeting.
July 2021 teasers
Psst, still here? Still scrolling the page looking for more roadmap goodness? If so, here is a few teasers of what’s to come to production next month…
- Teaser #1: Microsoft Lists – take your lists offline plus performance improvements [Roadmap ID: 68809]
- Teaser #2: Change a SharePoint page URL [Roadmap ID: 81994]
… shhh, tell everyone.
Helpful, ongoing change management resources
- Follow me to catch news and interesting SharePoint things: @mkashman; warning, occasional bad puns may fly in a tweet or two here and there, plus my new blog on Substack: The Kashbox.
Thanks for tuning in and/or reading this episode/blog of the Intrazone Roadmap Pitstop – June 2021 (blog/podcast). We are open to your feedback in comments below to hear how both the Roadmap Pitstop podcast episodes and blogs can be improved over time.
Engage with us. Ask those questions that haunt you. Push us where you want and need to get the best information and insights. We are here to put both our and your best change management foot forward.
Stay safe out there on the road’map, and thanks for listening and reading.
Avast ye mateys,
Cap’n Mark “Arrrr” Kashman – senior product manager (SharePoint/Lists) | Microsoft)
 The Intrazone Roadmap Pitstop – June 2021 graphic showing some of the highlighted release features.
by Contributed | Jun 30, 2021 | Technology
This article is contributed. See the original author and article here.
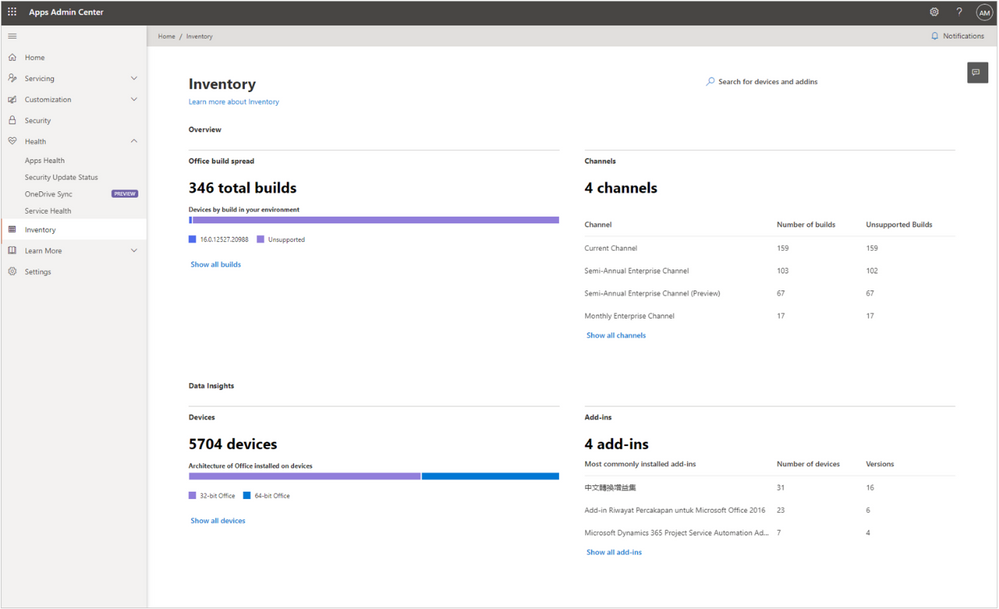
Today, we are happy to announce the General Availability (GA) of the new Inventory in the Microsoft 365 Apps admin center; a new experience specifically tailored to provide admins instant answers on the state of Microsoft 365 Apps in the enterprise environment.
Using the new dashboards, you as an admin can quickly identify potential issues. By getting a view of the build spread in your organization, you evaluate if you need to consolidate and update devices running unsupported Office app versions. You can see detailed information about add-ins installed on devices across the organization. You also have access to the raw Inventory, so you can drill through the device-level details and use filters to create views based on your requirements.
We also are happy to release the Security Update Status feature to GA. Based on inventory data, you as an IT pro can get an overview of how many devices are already running the latest security updates. You can slice and dice the data per channel or drill down to a list of devices missing security updates for the Microsoft 365 Apps. The report can be customized by setting your own goals for security currency and get a near-real time view of how close you are to these goals, such as having 90% of all devices running the latest security update within five days.
Both features are true cloud services providing you, as an admin, unparalleled insight into channels, releases, security and support status. Paired with the fact that both features span all Microsoft 365 Apps instances activated by your tenant, regardless of the management or directory domain of the device, this gives admins a more complete picture.
Overview
As mentioned, the Inventory in the Microsoft 365 Apps admin center is loaded with detailed reports and insights which are specifically built for the Microsoft 365 Apps. Onboarding is simple. Just visit Inventory on config.office.com and click, “Get started.” This enables devices to register to the service, and admins can get a full overview of their devices with Microsoft 365 Apps installed within a few hours. The landing page highlights key insights, flagging how many different releases are deployed, which update channels are in use, what the architecture split looks like, and what the most installed add-ins are:
Inventory – Providing easy overview of e.g. different releases of the Microsoft 365 Apps
Each insight has rich data behind it, which you can explore in greater detail by navigating into the different sections. You can get a full breakdown of all releases down to the device level. Or, see additional information about a given device and its Microsoft 365 Apps installation:
 Detail pane of a devices, showing device name, memory, installed version of Windows and Office and more
Maybe you are interested in getting a better understanding of which Component Object Model (COM)-based add-ins are installed in your environment or how many installs of different versions are out there:
 Add-in view in Inventory, showing a list of add-ins and version breakdown
Based on the same near-real time data from devices powering Inventory, you can also assess your security stance using the Security Update Status page:
 Security Update Status page giving an overview how many devices are running the latest updates as well as a detailed breakdown by channel
On a high level, you get an immediate insight into the share of devices which are already running the latest security update. You then can drill through this data by breaking the status down per channel or getting a full list of devices missing important security updates.
As mentioned before, this not only includes managed devices, but all devices which have a Microsoft 365 Apps installation that has been activated and used by an Azure Active Directory (AAD) user from your tenant. This way, you could also identify Bring Your Own Devices (BYOD), which would pose a risk to your tenant by missing important security updates.
From our early adopters
Since Ignite 2020, when these features were released into preview, our engineering and Microsoft 365 Apps Ranger teams have partnered with customers around the world, ranging in size from 10,000 to 300,000 seats across the enterprise and education spaces. While we shaped and improved the service during the preview phase, we consistently heard the following feedback from those early adopters:
Putting the new Inventory as well as the Security Update Status feature to work is as easy as can be. As true cloud services, there is no need to set up on-premises infrastructure, deploy software agents or policies to devices. Within minutes after the activation, admins were able to see the inventory populate automatically. Leveraging the unified integration into the Office product, it can be run side-by-side with other inventory solutions. For example, a device can report to Microsoft Endpoint Configuration Manager while the Microsoft 365 Apps installation reports its inventory directly to the Microsoft 365 Apps admin center.
The second important aspect was that Inventory, as well as the Security Update Status page, are specifically tailored to the Microsoft 365 Apps and are available in one place. Instead of having to build custom reports in a management solution which might be operated and owned by another team, the admin team owning the Microsoft 365 Apps get pre-build reports which they can access at any time.
Finally, customers valued the deep insights into which add-ins and versions are installed on devices. Often, add-ins can influence the user experience dramatically when it comes to performance and stability of the Microsoft 365 Apps. Several customers used this data to consolidate a wide version spread for an add-in or kicked off uninstall campaigns for add-ins which are out of support and should no longer be used.
Get started today
We encourage you to start evaluating the Inventory and the Security Update Status page. It only takes a few minutes to enable the new feature. It does not block other management solutions and the registration into Inventory is silent to the user. Just navigate to the Inventory overview page, enable the feature and see devices trickle in within minutes. To learn more, check out our documentation or watch the video from Ignite.
This is just the starting point
Today, there are more than 18 million devices registered into Inventory. We’ve gotten overwhelmingly positive feedback on today’s capabilities, but we’re not stopping anytime soon . We are working on even more features built on top of Inventory, like security vulnerability reporting, historical uptake trends for the Security Update Status, insights into add-in usage as well as cross-update channel comparisons, to name a few.

by Contributed | Jun 30, 2021 | Dynamics 365, Microsoft 365, Technology
This article is contributed. See the original author and article here.
Today, we’re announcing that use rights for Dynamics 365 Field Service (on-premises) will be retired on June 30, 2022. If your organization is currently using an on-premises version, this blog post gives you information to help you understand and plan for this change.
What is Dynamics 365 Field Service (on-premises)?
Dynamics 365 Field Service (on-premises) allows organizations to install and run Field Service version 7 and applications on computers located on site rather than as a service in the cloud. On-premises implementations of the Field Service application will no longer be supported after June 30, 2022.
How will this change affect my organization?
If your organization is currently using Dynamics 365 Field Service (on-premises), you’ll need to migrate to Dynamics 365 Field Service.
Are there any resources to help me move to the cloud?
Yes. The Dynamics 365 Migration Program is available to assist our customers with migrating from on-premises to the cloud. If you have questions specifically related to a Field Service migration, send us an email.
What will happen to the mobile app that works with Dynamics 365 Field Service (on-premises)?
Field Service Mobile (Xamarin) is also being retired June 30, 2022, and it will no longer be available. For more information about the Field Service mobile apps, go to the documentation.
What will happen with my organization’s Dynamics 365 Field Service (on-premises) license?
Licensing for Dynamics 365 Field Service (on-premises) is provided through dual use licenses, per the Dynamics 365 on-premises licensing guide. Organizations currently using Field Service licenses for on-premises implementations can use those same licenses for Field Service online.
When is this change taking place?
Availability of Dynamics 365 Field Service (on-premises) will end June 30, 2022.
When will the download package for the on-premises version become unavailable?
The download package to install Dynamics 365 Field Service (on-premises) will no longer be available after Dec 31, 2021.
What will happen to my Field Service (on-premises) implementation after June 30, 2022?
If you’ve already installed the on-premises version, it will still be available for your organization. However, new installations of Field Service (on-premises) will no longer be available from Microsoft. Also, the Field Service Mobile application that works with Field Service (on-premises) will be retired and no longer available after June 30, 2022.
I have a government implementation. Where is the Dynamics 365 sovereign cloud available?
The geographic regions where the Dynamics 365 sovereign cloud and Dynamics 365 Field Service are available is described in the Infrastructure and availability PDF.
Will I have to upgrade my version of Dynamics 365 Field Service when moving online?
Yes. The on-premises version will need to be updated through a proven upgrade process to the latest online version of Dynamics 365 Field Service.
Does this change also apply to other Dynamics 365 Customer Engagement (on-premises) apps?
No. This change does not apply to other Dynamics 365 on-premises apps.
Next steps
If you have any questions about this change, or need help with planning your Field Service (on-premises) migration, send us an email and we’ll connect you with the best resources to help you move forward.
Learn more about Dynamics 365 Field Service capabilities in the documentation.
The post Dynamics 365 Field Service (on-premises) use rights to retire on June 30, 2022 appeared first on Microsoft Dynamics 365 Blog.
Brought to you by Dr. Ware, Microsoft Office 365 Silver Partner, Charleston SC.
by Contributed | Jun 30, 2021 | Technology
This article is contributed. See the original author and article here.
Final Update: Wednesday, 30 June 2021 18:26 UTC
We’ve confirmed that all systems are back to normal with no customer impact as of 06/30, 17:25 UTC. Our logs show the incident started on 06/30, 15:45 UTC and that during the 1 hour and 40 minutes that it took to resolve the issue some of the customers in West Europe and East US regions might have experienced issues with delayed or missed Log Search Alerts.
- Root Cause: The failure was due to an issue in one of our backend services.
- Incident Timeline: 1 Hour & 40 minutes – 06/30, 15:45 UTC through 06/30, 17:25 UTC
We understand that customers rely on Log Analytics as a critical service and apologize for any impact this incident caused.
-Saika
Initial Update: Wednesday, 30 June 2021 17:15 UTC
We are aware of issues within Log Search Alerts and are actively investigating. Some customers may experience delayed or missed Log Search Alerts in West Europe and East US regions.
- Work Around: None
- Next Update: Before 06/30 20:30 UTC
We are working hard to resolve this issue and apologize for any inconvenience.
-Saika
by Contributed | Jun 30, 2021 | Technology
This article is contributed. See the original author and article here.
Introduction:
Traditionally, one of the most powerful techniques used to accelerate query processing in data warehouses is the pre-computation of relevant summaries or materialized views.
The initial implementation introduced in Apache Hive 3.0.0 focuses on introducing materialized views and automatic query rewriting based on those materializations in the project. Materialized views can be stored natively in Hive or in other custom storage handlers (ORC), and they can seamlessly exploit exciting new Hive features such as LLAP acceleration. Then, the optimizer relies in Apache Calcite to automatically produce full and partial rewritings for a large set of query expressions comprising projections, filters, join, and aggregation operations.
In this document, we provide details about materialized view creation and management in Hive against the source parquet tables.
Materialized views creation:
The syntax to create a materialized view in Hive is very similar to the CTAS statement syntax, supporting common features such as partition columns, custom storage handler, or passing table properties.
Standard Syntax:
CREATE MATERIALIZED VIEW [IF NOT EXISTS] [db_name.]materialized_view_name
[DISABLE REWRITE]
[COMMENT materialized_view_comment]
[PARTITIONED ON (col_name, ...)]
[CLUSTERED ON (col_name, ...) | DISTRIBUTED ON (col_name, ...) SORTED ON (col_name, ...)]
[
   [ROW FORMAT row_format]
   [STORED AS file_format]
     | STORED BY 'storage.handler.class.name' [WITH SERDEPROPERTIES (...)]
]
[LOCATION hdfs_path]
[TBLPROPERTIES (property_name=property_value, ...)]
AS
<query>;
Example wrt Parquet source tables:
Table description:
0: jdbc:hive2://zk0-hdilla.xi2kmm3bon0engqedn> desc formatted hive_parquet;
+-------------------------------+----------------------------------------------------+-----------------------------+
|           col_name           |                     data_type                     |           comment           |
+-------------------------------+----------------------------------------------------+-----------------------------+
| # col_name                   | data_type                                         | comment                     |
| clientid                     | string                                             |                             |
| querytime                     | string                                             |                            |
| market                       | string                                             |                             |
| deviceplatform               | string                                             |                             |
| devicemake                    | string                                             |                             |
| devicemodel                   | string                                             |                             |
| state                         | string                                             |                             |
| country                       | string                                             |                             |
| querydwelltime               | double                                            |                             |
| sessionid                     | bigint                                             |                             |
| sessionpagevieworder         | bigint                                            |                             |
|                               | NULL                                               | NULL                       |
| # Detailed Table Information | NULL                                               | NULL                      |
| Database:                     | default                                           | NULL                       |
| OwnerType:                   | USER                                               | NULL                       |
| Owner:                       | anonymous                                         | NULL                       |
| CreateTime:                   | Mon Jun 21 11:38:49 UTC 2021                       | NULL                       |
| LastAccessTime:              | UNKNOWN                                           | NULL                       |
| Retention:                   | 0                                                 | NULL                       |
| Location:                     | abfs://hdillap-2021-06-09t16-52-55-399z@hiverepl.dfs.core.windows.net/hive/warehouse/managed/hive_parquet | NULL                       |
| Table Type:                   | MANAGED_TABLE                                     | NULL                       |
| Table Parameters:             | NULL                                               | NULL                       |
|                               | COLUMN_STATS_ACCURATE                             | {"BASIC_STATS":"true"} |
|                               | bucketing_version                                 | 2                           |
|                               | numFiles                                           | 1                           |
|                               | numRows                                          | 59793                       |
|                               | rawDataSize                                       | 657723                     |
|                               | totalSize                                        | 1419783                     |
|                               | transactional                                     | true                       |
|                               | transactional_properties                           | insert_only                |
|                               | transient_lastDdlTime                             | 1624275529                 |
|                               | NULL                                               | NULL                       |
| # Storage Information         | NULL                                               | NULL                       |
| SerDe Library:               | org.apache.hadoop.hive.ql.io.parquet.serde.ParquetHiveSerDe | NULL                       |
| InputFormat:                  | org.apache.hadoop.hive.ql.io.parquet.MapredParquetInputFormat | NULL                       |
| OutputFormat:                 | org.apache.hadoop.hive.ql.io.parquet.MapredParquetOutputFormat | NULL                       |
| Compressed:                  | No                                                 | NULL                       |
| Num Buckets:                 | -1                                                 | NULL                       |
| Bucket Columns:               | []                                                | NULL                       |
| Sort Columns:                 | []                                                 | NULL                       |
| Storage Desc Params:         | NULL                                               | NULL                       |
|                               | serialization.format                               | 1                           |
+-------------------------------+----------------------------------------------------+-----------------------------+
Example 1: Create materialized view on parquet table with partition on country column:
CREATE MATERIALIZED VIEW hivemv1
PARTITIONED ON (country)
STORED AS ORC
AS
SELECT * FROM hive_parquet;
Example 2: Create MV parquet table with partition on country column and sort defined on one column
CREATE MATERIALIZED VIEW hivemv3
PARTITIONED ON (country)
STORED AS ORC
AS
SELECT * FROM hive_parquet order by deviceplatform;
Other operations for materialized view management:
Currently we support the following operations that aid at managing the materialized views in Hive:
-- Drops a materialized view
   DROP MATERIALIZED VIEW [db_name.]materialized_view_name;
-- Shows materialized views (with optional filters)
   SHOW MATERIALIZED VIEWS [IN database_name] ['identifier_with_wildcards’];
-- Shows information about a specific materialized view
   DESCRIBE [EXTENDED | FORMATTED] [db_name.]materialized_view_name;
Example:
0: jdbc:hive2://zk0-hdilla.xi2kmm3bon0engqedn> show materialized views;
+------------+--------------------+-----------------+
| mv_name   | rewrite_enabled   |     mode       |
+------------+--------------------+-----------------+
| # MV Name | Rewriting Enabled | Mode           |
| hivemv     | Yes               | Manual refresh |
| hivemv1   | Yes               | Manual refresh |
| hivemv2   | Yes               | Manual refresh |
|           | NULL               | NULL          |
+------------+--------------------+-----------------+
Materialized view-based query rewriting:
Once a materialized view has been created, the optimizer will be able to exploit its definition semantics to automatically rewrite incoming queries using materialized views, and hence, accelerate query execution.
The rewriting algorithm can be enabled and disabled globally using the hive.materializedview.rewriting configuration property (default value is true) and at materialized view level as below:
ALTER MATERIALIZED VIEW [db_name.]materialized_view_name ENABLE|DISABLE REWRITE;
Materialized view maintenance:
When data in the source tables used by a materialized view changes, the rebuild operation for a materialized view needs to be triggered by the user. In particular, the user should execute the following statement:
ALTER MATERIALIZED VIEW [db_name.]materialized_view_name REBUILD;
Hive supports incremental view maintenance, i.e., only refresh data that was affected by the changes in the original source tables. Incremental view maintenance will decrease the rebuild step execution time. In addition, it will preserve LLAP cache for existing data in the materialized view.
FYI, Hive will attempt to rebuild a materialized view incrementally, falling back to full rebuild if it is not possible. Current implementation only supports incremental rebuild when there were INSERT operations over the source tables, while UPDATE and DELETE operations will force a full rebuild of the materialized view.
To execute incremental maintenance, following conditions should be met:
- The materialized view should only use transactional tables, either micromanaged or ACID.
- If the materialized view definition contains a Group By clause, the materialized view should be stored in an ACID table, since it needs to support MERGE operation. For materialized view definitions consisting of Scan-Project-Filter-Join, this restriction does not exist.
A rebuild operation acquires an exclusive write lock over the materialized view, i.e., for a given materialized view, only one rebuild operation can be executed at a given time.
Materialized view lifecycle:
If the materialized view uses non-transactional tables and hence, we cannot verify whether its contents are outdated, however we still want to use the automatic rewriting. For such occasions, we can combine a rebuild operation run periodically, e.g., every 5 minutes, and define the required freshness of the materialized view data using the hive.materializedview.rewriting.time.window configuration parameter, for instance:
SET hive.materializedview.rewriting.time.window=10min;
The parameter value can be also overridden by a concrete materialized view just by setting it as a table property when the materialization is created.
Please note: By default, hive.materializedview.rewriting.time.window will be set to 0min which means auto rebuild is disabled. To enable at global level add the same with specific time interval under Ambari -> Hive config -> Custom hive-site. Also, the change will be applicable to the MVs created post this change.
Post the rewrite window, the update with MV could be validated by `desc formatted mv_name`.
....
Rewrite Enabled:                 | Yes                                               | NULL
Outdated for Rewriting:         | Yes                                               | NULL
....
Example:
CREATE MATERIALIZED VIEW hivemv3
PARTITIONED ON (country)
STORED AS ORC
TBLPROPERTIES (hive.materializedview.rewriting.time.window"="10min")
AS
SELECT * FROM hive_parquet;
Examples with outputs:
Materialized view with sort on specific column
With distributed on or sort by on roadmap, to sort the data within materialized view – create the mv with order by clause with the select query.
CREATE MATERIALIZED VIEW hivemv14
PARTITIONED ON (country)
STORED AS ORC
AS
SELECT * FROM hive_parquet ORDER BY (devicemake);
The data stored in the ORC file is sorted and could be validated with command `/usr/bin/hive –orcfiledump -d <location_of_orc_file>`.
Refer: Attached sample ORC data file.
Description on the MV created: (desc formatted hivemv1)
+----------------------------------+----------------------------------------------------+-----------------------------+
|             col_name             |                     data_type                     |           comment           |
+----------------------------------+----------------------------------------------------+-----------------------------+
| # col_name                       | data_type                                         | comment                     |
| clientid                         | string                                             |                            |
| querytime                       | string                                             |                             |
| market                           | string                                             |                            |
| deviceplatform                   | string                                             |                             |
| devicemake                       | string                                             |                             |
| devicemodel                     | string                                             |                             |
| state                           | string                                             |                             |
| querydwelltime                  | double                                             |                             |
| sessionid                       | bigint                                             |                             |
| sessionpagevieworder             | bigint                                             |                             |
|                                 | NULL                                               | NULL                       |
| # Partition Information         | NULL                                              | NULL                       |
| # col_name                       | data_type                                         | comment                     |
| country                         | string                                          |                             |
|                                 | NULL                                               | NULL                       |
| # Detailed Table Information     | NULL                                             | NULL                       |
| Database:                       | default                                           | NULL                       |
| OwnerType:                       | USER                                               | NULL                        |
| Owner:                           | anonymous                                         | NULL                       |
| CreateTime:                     | Mon Jun 21 11:44:00 UTC 2021                       | NULL                       |
| LastAccessTime:                 | UNKNOWN                                           | NULL                       |
| Retention:                       | 0                                                 | NULL                       |
| Location:                      | abfs://hdillap-2021-06-09t16-52-55-399z@hiverepl.dfs.core.windows.net/hive/warehouse/managed/hivemv1 | NULL                       |
| Table Type:                     | MATERIALIZED_VIEW                                 | NULL                        |
| Table Parameters:               | NULL                                               | NULL                       |
|                                 | COLUMN_STATS_ACCURATE                             | {"BASIC_STATS":"true"} |
|                                 | bucketing_version                                 | 2                           |
|                                 | numFiles                                           | 88                         |
|                                | numPartitions                                     | 88                         |
|                                 | numRows                                           | 59793                       |
|                                | rawDataSize                                       | 39334953                   |
|                                 | totalSize                                         | 841901                     |
|                                 | transient_lastDdlTime                             | 1624275840                 |
|                                 | NULL                                               | NULL                       |
| # Storage Information           | NULL                                              | NULL                       |
| SerDe Library:                   | org.apache.hadoop.hive.ql.io.orc.OrcSerde         | NULL                       |
| InputFormat:                     | org.apache.hadoop.hive.ql.io.orc.OrcInputFormat   | NULL                       |
| OutputFormat:                   | org.apache.hadoop.hive.ql.io.orc.OrcOutputFormat   | NULL                       |
| Compressed:                     | No                                                 | NULL                       |
| Num Buckets:                     | -1                                                 | NULL                       |
| Bucket Columns:                 | []                                                 | NULL                        |
| Sort Columns:                   | []                                                 | NULL                       |
|                                 | NULL                                               | NULL                       |
| # Materialized View Information | NULL                                               | NULL                       |
| Original Query:                 | select * from hive_parquet                         | NULL                       |
| Expanded Query:                 | SELECT `clientid`, `querytime`, `market`, `deviceplatform`, `devicemake`, `devicemodel`, `state`, `querydwelltime`, `sessionid`, `sessionpagevieworder`, `country` FROM (select `hive_parquet`.`clientid`, `hive_parquet`.`querytime`, `hive_parquet`.`market`, `hive_parquet`.`deviceplatform`, `hive_parquet`.`devicemake`, `hive_parquet`.`devicemodel`, `hive_parquet`.`state`, `hive_parquet`.`country`, `hive_parquet`.`querydwelltime`, `hive_parquet`.`sessionid`, `hive_parquet`.`sessionpagevieworder` from `default`.`hive_parquet`) `hivemv1` | NULL                       |
| Rewrite Enabled:                 | Yes                                               | NULL                       |
| Outdated for Rewriting:         | No                                                | NULL                       |
+----------------------------------+----------------------------------------------------+-----------------------------+
Data validation on materialized view:
0: jdbc:hive2://zk0-hdilla.xi2kmm3bon0engqedn> select * from hivemv1 limit 5;
INFO : Compiling command(queryId=hive_20210621163758_1a523251-bfd0-40ca-a9fd-ef463120b3d8): select * from hivemv1 limit 5
INFO : Semantic Analysis Completed (retrial = false)
INFO : Returning Hive schema: Schema(fieldSchemas:[FieldSchema(name:hivemv1.clientid, type:string, comment:null), FieldSchema(name:hivemv1.querytime, type:string, comment:null), FieldSchema(name:hivemv1.market, type:string, comment:null), FieldSchema(name:hivemv1.deviceplatform, type:string, comment:null), FieldSchema(name:hivemv1.devicemake, type:string, comment:null), FieldSchema(name:hivemv1.devicemodel, type:string, comment:null), FieldSchema(name:hivemv1.state, type:string, comment:null), FieldSchema(name:hivemv1.querydwelltime, type:double, comment:null), FieldSchema(name:hivemv1.sessionid, type:bigint, comment:null), FieldSchema(name:hivemv1.sessionpagevieworder, type:bigint, comment:null), FieldSchema(name:hivemv1.country, type:string, comment:null)], properties:null)
INFO : Completed compiling command(queryId=hive_20210621163758_1a523251-bfd0-40ca-a9fd-ef463120b3d8); Time taken: 1.111 seconds
INFO : Executing command(queryId=hive_20210621163758_1a523251-bfd0-40ca-a9fd-ef463120b3d8): select * from hivemv1 limit 5
INFO : Completed executing command(queryId=hive_20210621163758_1a523251-bfd0-40ca-a9fd-ef463120b3d8); Time taken: 0.01 seconds
INFO : OK
+-------------------+--------------------+-----------------+-------------------------+---------------------+----------------------+----------------+-------------------------+--------------------+-------------------------------+----------------------+
| hivemv1.clientid | hivemv1.querytime | hivemv1.market | hivemv1.deviceplatform | hivemv1.devicemake | hivemv1.devicemodel | hivemv1.state | hivemv1.querydwelltime | hivemv1.sessionid | hivemv1.sessionpagevieworder |   hivemv1.country   |
+-------------------+--------------------+-----------------+-------------------------+---------------------+----------------------+----------------+-------------------------+--------------------+-------------------------------+----------------------+
| 11786             | 22:33:53           | en-US           | Android                 | Motorola           | Quench XT5           | Saint John     | 7.0328606               | 0                 | 1                             | Antigua And Barbuda |
| 11786             | 22:30:29           | en-US           | Android                 | Motorola           | Quench XT5           | Saint John     | 68.3177076             | 0                 | 0                             | Antigua And Barbuda |
| 11786             | 22:35:02           | en-US          | Android                 | Motorola           | Quench XT5           | Saint John     | 8.1046491               | 0                 | 2                             | Antigua And Barbuda |
| 11786             | 22:35:25           | en-US          | Android                 | Motorola           | Quench XT5           | Saint John     | 26.3155831             | 0                 | 3                             | Antigua And Barbuda |
| 11786             | 22:36:00           | en-US           | Android                 | Motorola           | Quench XT5           | Saint John     | 3.8841237               | 0                 | 4                             | Antigua And Barbuda |
+-------------------+--------------------+-----------------+-------------------------+---------------------+----------------------+----------------+-------------------------+--------------------+-------------------------------+----------------------+
5 rows selected (1.851 seconds)
Compute statistics:
One of the key use cases of statistics is query optimization. Statistics serve as the input to the cost functions of the optimizer so that it can compare different plans and choose among them.
analyze table hivemv1 partition(country) compute statistics for columns;
Table description post stats collection:
+----------------------------------+----------------------------------------------------+----------------------------------------------------+
|             col_name             |                     data_type                    |                     comment                       |
+----------------------------------+----------------------------------------------------+----------------------------------------------------+
| # col_name                       | data_type                                         | comment                                           |
| clientid                         | string                                             |                                                   |
| querytime                        | string                                             |                                                   |
| market                           | string                                             |                                                  |
| deviceplatform                   | string                                             |                                                   |
| devicemake                       | string                                             |                                                 |
| devicemodel                     | string                                             |                                                   |
| state                           | string                                            |                                                   |
| country                         | string                                             |                                                   |
| querydwelltime                   | double                                             |                                                   |
| sessionid                       | bigint                                             |                                                  |
| sessionpagevieworder             | bigint                                             |                                                   |
|                                 | NULL                                               | NULL                                              |
| # Detailed Table Information     | NULL                                               | NULL                                               |
| Database:                       | default                                            | NULL                                               |
| OwnerType:                       | USER                                               | NULL                                               |
| Owner:                           | anonymous                                         | NULL                                               |
| CreateTime:                     | Fri Jun 18 05:48:03 UTC 2021                       | NULL                                               |
| LastAccessTime:                 | UNKNOWN                                           | NULL                                               |
| Retention:                       | 0                                                 | NULL                                              |
| Location:                       | abfs://hdillap-2021-06-09t16-52-55-399z@hiverepl.dfs.core.windows.net/hive/warehouse/managed/hivemv2 | NULL                                               |
| Table Type:                     | MATERIALIZED_VIEW                                 | NULL                                               |
| Table Parameters:               | NULL                                               | NULL                                               |
|                                  | COLUMN_STATS_ACCURATE                             | {"BASIC_STATS":"true","COLUMN_STATS":{"clientid":"true","country":"true","devicemake":"true","devicemodel":"true","deviceplatform":"true","market":"true","querydwelltime":"true","querytime":"true","sessionid":"true","sessionpagevieworder":"true","state":"true"}} |
|                                 | bucketing_version                                 | 2                                                |
|                                 | numFiles                                           | 1                                                 |
|                                 | numRows                                           | 59793                                             |
|                                 | rawDataSize                                       | 45057355                                           |
|                                 | totalSize                                          | 737187                                             |
|                                 | transient_lastDdlTime                             | 1623995315                                         |
|                                | NULL                                               | NULL                                               |
| # Storage Information           | NULL                                               | NULL                                               |
| SerDe Library:                   | org.apache.hadoop.hive.ql.io.orc.OrcSerde         | NULL                                               |
| InputFormat:                     | org.apache.hadoop.hive.ql.io.orc.OrcInputFormat   | NULL                                              |
| OutputFormat:                   | org.apache.hadoop.hive.ql.io.orc.OrcOutputFormat   | NULL                                               |
| Compressed:                     | No                                                | NULL                                               |
| Num Buckets:                     | -1                                                 | NULL                                               |
| Bucket Columns:                 | []                                                 | NULL                                              |
| Sort Columns:                   | []                                                 | NULL                                               |
|                                 | NULL                                               | NULL                                               |
| # Materialized View Information | NULL                                               | NULL                                               |
| Original Query:                 | select * from hivesampletable                     | NULL                                               |
| Expanded Query:                 | select `hivesampletable`.`clientid`, `hivesampletable`.`querytime`, `hivesampletable`.`market`, `hivesampletable`.`deviceplatform`, `hivesampletable`.`devicemake`, `hivesampletable`.`devicemodel`, `hivesampletable`.`state`, `hivesampletable`.`country`, `hivesampletable`.`querydwelltime`, `hivesampletable`.`sessionid`, `hivesampletable`.`sessionpagevieworder` from `default`.`hivesampletable` | NULL                                               |
| Rewrite Enabled:                 | Yes                                               | NULL                                               |
| Outdated for Rewriting:         | No                                               | NULL                                               |
+----------------------------------+----------------------------------------------------+----------------------------------------------------+
Known limitations:
- Support defining a CLUSTERED ON/DISTRIBUTED ON+SORTED ON specification for materialized views – HIVE-18842
- Creation on partitioned ACID materialized view. The data movement fails with error `Write id is not set in the config by open txn task for migration` – HIVE-21678
References:
https://cwiki.apache.org/confluence/display/Hive/Materialized+views
https://docs.cloudera.com/HDPDocuments/HDP3/HDP-3.1.4/materialized-view/content/hive_alter_materialized_view_rebuild.html
https://cwiki.apache.org/confluence/display/Hive/StatsDev
by Scott Muniz | Jun 30, 2021 | Security, Technology
This article is contributed. See the original author and article here.
CISA has released a new module in its Cyber Security Evaluation Tool (CSET): the Ransomware Readiness Assessment (RRA). CSET is a desktop software tool that guides network defenders through a step-by-step process to evaluate their cybersecurity practices on their networks. CSET—applicable to both information technology (IT) and industrial control system (ICS) networks—enables users to perform a comprehensive evaluation of their cybersecurity posture using many recognized government and industry standards and recommendations.
The RRA is a self-assessment based on a tiered set of practices to help organizations better assess how well they are equipped to defend and recover from a ransomware incident. CISA has tailored the RRA to varying levels of ransomware threat readiness to make it useful to all organizations regardless of their current cybersecurity maturity. The RRA:
- Helps organizations evaluate their cybersecurity posture, with respect to ransomware, against recognized standards and best practice recommendations in a systematic, disciplined, and repeatable manner.
- Guides asset owners and operators through a systematic process to evaluate their operational technology (OT) and information technology (IT) network security practices against the ransomware threat.
- Provides an analysis dashboard with graphs and tables that present the assessment results in both summary and detailed form.
CISA strongly encourages all organizations to take the CSET Ransomware Readiness Assessment, available at https://github.com/cisagov/cset/.
by Contributed | Jun 30, 2021 | Technology
This article is contributed. See the original author and article here.
The Azure Maps team is happy to announce that the Azure Maps Android SDK is now generally available. The team worked hard to ensure good alignment of the core feature set in the Azure Maps Web SDK to create a consistent developer experience. If you don’t have an Azure Maps account, sign up now for free. Some of the key improvements added to this update include:
- Data-driven style expressions
- Vector tile support
- Additional rendering layers
- And much more!
Data-driven style expressions
Azure Maps SDK’s leverage the Mapbox style specification and uses MapLibre GL based libraries as an underlying rendering engine. Data-driven style expressions allow you to add business logic to individual styling options which take into consideration the properties defined on each shape in a data source. Data-driven styles can greatly reduce the amount of code required to write and define similar business logic using if-statements and monitoring map events. Additionally, these allow the business logic to be processed at render time and offloaded to the GPU for better performance.
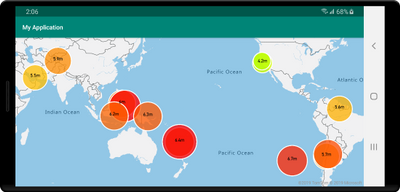
As an example, take into consideration earthquake data. Each data point has a magnitude property. To show the related magnitude of each data point on a map we might want to draw scaled circles using the BubbleLayer when the larger the magnitude of a data point, the larger the radius of the circle. The following code demonstrates how to apply data-driven style to the radius option in the BubbleLayer, which will scale the radius based on the magnitude property of each data point on a linear scale from 2 pixels, magnitude of 0 to 40 pixels, and the magnitude is 8.
BubbleLayer layer = new BubbleLayer(source,
      bubbleRadius(
             interpolate(
                   linear(),
                   get("magnitude"),
                   stop(0, 2f),
                   stop(8, 40f)
             )
      )
);
We could also apply a similar data driven style which defines the color of each circle and generate a map that looks like the following.
The Azure Maps Web SDK has similar style expression support, although in a JSON format. These JSON formatted expressions can be used with the Android SDK as well by serializing them as a string and passing them into Expression.raw method which will parse it for you. For example, the following two expressions do the same thing:
//Native Android expression class
Expression exp = Expression.get("title")

//Parsing a stringified JSON expression.
Expression exp = Expression.raw("['get','title']")
See the documentation to learn more.
Vector tile source support
Vector tiles are a newer geospatial data format that makes it fast and easy to render massive datasets on an interactive map while having full control of styling and interactions locally within the map.
Vector tile layers use the same tile pyramid system as tile layers but contain raw compressed vector data while tile layers render raster imagers. The data in a vector tile contain geographic features in the form of points, lines, and polygons. There are several advantages of using vector tile layers instead of raster tile layers:
- The file size of a vector tile is typically much smaller than an equivalent raster tile. As such, less bandwidth is used. It means lower latency, a faster map, and a better user experience.
- Since vector tiles are rendered on the client, they adapt to the resolution of the device they’re being displayed on. As a result, the rendered maps appear more well defined, with crystal clear labels.
- Changing the style of the data in the vector maps doesn’t require downloading the data again, since the new style can be applied on the client. In contrast, changing the style of a raster tile layer typically requires loading a new set tiles from the server.
- Since the data is delivered in vector form, there’s less server-side processing required to prepare the data. As a result, the newer data can be made available faster.
Azure Maps adheres to the Mapbox Vector Tile Specification, an open standard. See the documentation to learn more.
Additional rendering layers
The Azure Maps Android SDK already provides rendering layers for symbols, lines, polygons, and tile layers. With this update several additional rendering layers have been made available.
Bubble layer – easily render points as scaled circles on the map. Documentation
 Map showing points on a map
Heatmap layer – show the density and “hot spots” of a set of points on the map. Documentation
 Map showing points as a heat map
Polygon extrusion layer – vertically stretch polygons to create bar charts or buildings. Documentation
 Map with extruded polygons or state boundaries
Image layer – overlay georeferenced images as a layer on the map. Documentation
 Map with an image of overlaid on top
Additional improvements
The following are some additional improvements that have been added.
- Clustering of point data in a data source.
- Easily import GeoJSON file into a data source.
- Improved traffic incident integration based on vector tiles for better performance. Also the ability to filter traffic incidents by category and magnitude.
- UI controls for zooming, pitching, and rotating the map, as well as a control for toggling traffic overlays on and off.
- New popup class similar to Web SDK.
- Easily modify the color of the built-in marker icon.
- Improved documentation with examples in Java and Kotlin.
We want to hear from you
We are always working to grow and improve the Azure Maps platform and want to hear from you. We’re here to help and want to make sure you get the most out of the Azure Maps platform.
- Have a feature request? Having an issue getting your code to work? Have a topic you would like us to cover on the Azure blog? Ask us on the Azure Maps forums.
- Looking for code samples? There’s a plethora of them on our Azure Maps Code Sample site. Wrote a great one you want to share? Join us on GitHub.
To learn more, read the Azure Maps documentation

by Contributed | Jun 30, 2021 | Technology
This article is contributed. See the original author and article here.
Meet Kiki, a 6-year-old Southern Resident orca living in the Salish Sea. She is a member of the Southern Resident orca population which has been declining in numbers to the point of being listed as an endangered species. What are the factors contributing to this decline? Let’s use data explore this question.
Orca swimming just under the surface of the water. Image courtesy of Karoline and Gary Cullen.
Data science is an essential 21st century skill and one of the fastest growing fields. Through the Day of Data program, introduce your students to important data skills using engaging interdisciplinary subjects. With Day of Data: Orcas, coming soon on World Orca Day (July 14th), students engage with data to better understand Kiki, her family, and factors contributing to the decline of the Southern Resident orca population. These self-contained, standards-aligned lessons are suitable for in class, remote, and hybrid learning.
“We need to teach data literacy in order to prepare our students for the future workforce.”
Middle School Educator
Using the Day of Data: Orcas lessons, students will learn transferrable data literacy skills. Students conduct data-driven research and analysis while interacting with multiple sources of data including data types powered by Wolfram. Students use this information to provide evidence for explanations and to generate new questions that can be answered using data.
Today’s learners will enter a world defined by data. Analyzing and extracting key insights from data will become necessary and expected skills for the workforce of the future. Prepare your students by tapping into their creativity and curiosity with Microsoft Hacking STEM – go swimming with the orcas!

by Contributed | Jun 30, 2021 | Technology
This article is contributed. See the original author and article here.
Welcome to the monthly Healthcare and Life Sciences blog recap, June edition! Check out the highlights below:
Azure API for FHIR
- Supporting CMS Interoperability and Patient Access Final Rules: Learn how the Azure API for FHIR now has features that will help customers achieve compliance for the Interoperability and Patient Access final rule. Click here to read the post.
Power BI
- Power BI Premium Gen 2 Webinar: Learn how the Premium Gen 2 service update increases the value your organization gets from Power BI Premium. Watch the webinar here.
- Free Power BI Training: Interested in hands on Power BI learning for business users? Click here to register.
- Planning for Secure and Scalable Power BI Enterprise Architecture with Sensitive Data: Learn best practices for planning secure and scalable Power BI Enterprise Architecture with Sensitive Data at the core. Click here to learn more.
COVID-19
- COVID-19 Healthcare App Challenge: IQVIA and Microsoft have partnered on sponsoring the COVID-19 Healthcare App Challenge Hackathon. The hackathon is open to participants worldwide and provides a great opportunity to assist with the medical community by also compete for prizes. Click here to learn more.
- Vaccine Volunteer Management: Learn how to create role-based scheduling with Shifts in Teams and the Power Platform. Click here to read the post.
Microsoft Viva
- How Microsoft Viva Can Enhance Your Employee Experience: Interested in learning more about Microsoft Viva? In this webinar, learn how Viva Connections, Viva Topics, Viva Learning, and Viva Insights can enhance your employee experience. Click here to watch.
Confessions of Health Geeks
- The Future of Nursing 2020 to 2030 Health Equity: On this episode, Dr. Vickie Tiase, Director of Research at New York Presbyterian Hospital discusses how technology can help achieve the goals outlined in the 2020 to 2030 Health Equity report. Watch the episode here.
- Jaimie Fox – Top 50 Technical Visionary by Intercon: Learn how Jaimie Fox has helped a large EMR company leverage the Microsoft Clouds and how she earned the Top 50 Technical Visionary Award by Intercon. Click here to learn more.
- Meet the Microsoft Managing Director of the Health and Life Sciences Industry Team: In this episode, Kathy Van Enkevort shares her extensive health background and a few of her ideas on how to transform healthcare. Click here to watch.
MidDay Café
- PowerPoint Live in Teams, PowerPoint Recording, and More: On this episode, the MidDay Café crew breaks down some of the cool things you can do with Microsoft PowerPoint in Teams presentations. Click here to watch.
- Accessibility: Learn about Microsoft accessibility features including the Microsoft Immersive Reader, Dictation in Microsoft Outlook and Word in iOS, and accessibility settings within Microsoft Windows and Power BI. Click here to learn more.
- Operator Connect for Microsoft Teams: In this episode, learn how to connect to existing phone carriers with Microsoft Operator Connect in Teams. Click here to watch.
HLS Show Me How
- Leveraging Rich Media in Microsoft Viva Connections: Learn how to kick your next generation Intranet up a notch by adding video from Microsoft Stream and YouTube to your Microsoft Viva Connections portal. Click here to watch.
Surface Podcast Series
- The New Surface Podcast Series: Join in weekly to learn about the current state of Surface hardware and how it fits into the world of Health and Life Sciences. Click here to learn more.
January’s HLS Blog Contributors:

Michael Gannotti, Principal Technical Specialist, Microsoft Teams

Claire Bonaci, Director, Business Development, Health and Life Sciences

Vasu Sharma, Senior Customer Success Manager, Microsoft Teams

Kendra Burgess, Senior Technical Specialist, Business Applications

Linishya Vaz, Product Marketing Manager, Health and Life Sciences

Greg Beaumont, Senior Technical Specialist, Intelligence

Alfred Ojukwu, Senior Surface Specialist, Health and Life Sciences
Thanks for reading and let us know how else our Microsoft team can help!

Erin Spencer, Technical Specialist, Microsoft Teams

Recent Comments