by Scott Muniz | May 11, 2022 | Security, Technology
This article is contributed. See the original author and article here.
Google has released Chrome version 101.0.4951.64 for Windows, Mac, and Linux. This version addresses vulnerabilities that an attacker could exploit to take control of an affected system.
CISA encourages users and administrators to review the Chrome Release Note and apply the necessary update.

by Scott Muniz | May 11, 2022 | Security, Technology
This article is contributed. See the original author and article here.
Official websites use .gov
A .gov website belongs to an official government organization in the United States.

Secure .gov websites use HTTPS
A
lock ( )
) or
https:// means you’ve safely connected to the .gov website. Share sensitive information only on official, secure websites.
by Scott Muniz | May 11, 2022 | Security, Technology
This article is contributed. See the original author and article here.
CISA has added one new vulnerability to its Known Exploited Vulnerabilities Catalog, based on evidence of active exploitation. These types of vulnerabilities are a frequent attack vector for malicious cyber actors and pose significant risk to the federal enterprise. Note: to view the newly added vulnerability in the catalog, click on the arrow on the of the “Date Added to Catalog” column, which will sort by descending dates.
Binding Operational Directive (BOD) 22-01: Reducing the Significant Risk of Known Exploited Vulnerabilities established the Known Exploited Vulnerabilities Catalog as a living list of known CVEs that carry significant risk to the federal enterprise. BOD 22-01 requires FCEB agencies to remediate identified vulnerabilities by the due date to protect FCEB networks against active threats. See the BOD 22-01 Fact Sheet for more information.
Although BOD 22-01 only applies to FCEB agencies, CISA strongly urges all organizations to reduce their exposure to cyberattacks by prioritizing timely remediation of Catalog vulnerabilities as part of their vulnerability management practice. CISA will continue to add vulnerabilities to the Catalog that meet the meet the specified criteria.
by Scott Muniz | May 11, 2022 | Security
This article was originally posted by the FTC. See the original article here.
Brought to you by Dr. Ware, Microsoft Office 365 Silver Partner, Charleston SC.
by Contributed | May 10, 2022 | Technology
This article is contributed. See the original author and article here.
Microsoft has released security updates (SUs) for vulnerabilities found in:
- Exchange Server 2013
- Exchange Server 2016
- Exchange Server 2019
IMPORTANT: Starting with this release of Security Updates, we are releasing updates in a self-extracting auto-elevating .exe package (in addition to the existing Windows Installer Patch format). Please see this post for more information. Original update packages can be downloaded from Microsoft Update Catalog.
These SUs are available for the following specific builds of Exchange Server:
The SUs address vulnerabilities responsibly reported to Microsoft by security partners and found through Microsoft’s internal processes. Although we are not aware of any active exploits in the wild, our recommendation is to immediately install these updates to protect your environment.
These vulnerabilities affect Exchange Server. Exchange Online customers are already protected from the vulnerabilities addressed in these SUs and do not need to take any action other than updating any Exchange servers in their environment.
More details about specific CVEs can be found in the Security Update Guide (filter on Exchange Server under Product Family).
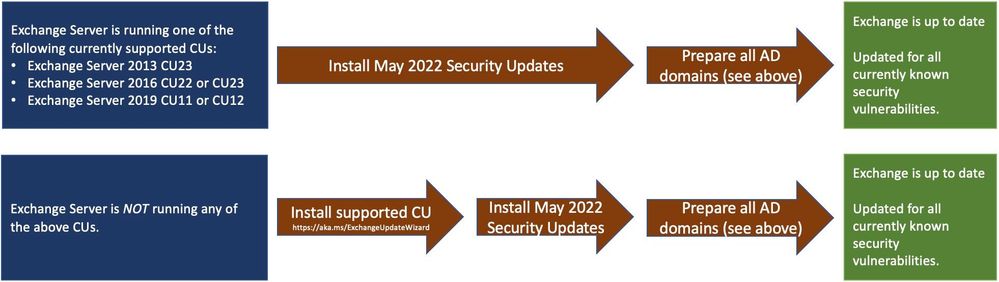
Manual run of /PrepareAllDomains is required
Because of additional security hardening work for CVE-2022-21978, the following actions should be taken in addition to application of May 2022 security updates:
Latest version of Exchange Server installed in the organization
|
Additional steps needed
|
Exchange Server 2016 CU22 or CU23, or
Exchange Server 2019 CU11 or CU12
|
Install the May 2022 SU first and then run the following Command Prompt command once using Setup.exe in your Exchange Server installation path (e.g., …Program FilesMicrosoftExchange Serverv15Bin):
“Setup.exe /IAcceptExchangeServerLicenseTerms_DiagnosticDataON /PrepareAllDomains”
Or
“Setup.exe /IAcceptExchangeServerLicenseTerms_DiagnosticDataOFF /PrepareAllDomains”
|
Exchange Server 2013 CU23
|
Install the May 2022 SU first and then run the following Command Prompt command once using Setup.exe in your Exchange Server installation path (e.g., …Program FilesMicrosoftExchange Serverv15Bin):
Setup.exe /IAcceptExchangeServerLicenseTerms /PrepareAllDomains
|
Any older version of Exchange Server not listed above
|
Update your Exchange server to the latest CU, install May 2022 SU and then follow the steps above.
|
You need to run /PrepareAllDomains only once per organization and those changes will apply to all versions of Exchange Server within the organization. When you run /PrepareAllDomains, your account needs to be a member of the Enterprise Admins security group. This might be a different account from the one you use to install the SU.
Update installation
Two update paths are available:
Inventory your Exchange Servers / determine which updates are needed
Use the Exchange Server Health Checker script (use the latest release) to inventory your servers. Running this script will tell you if any of your Exchange Servers are behind on updates (CUs and SUs).
Update to the latest Cumulative Update
Go to https://aka.ms/ExchangeUpdateWizard and choose your currently running CU and your target CU to get directions for your environment.
If you encounter errors during or after installation of Exchange Server updates
If you encounter errors during installation, see the SetupAssist script. If something does not work properly after updates, see Repair failed installations of Exchange Cumulative and Security updates.
Known issues with this release
We are not aware of any known issues with this release.
Issues resolved by this release
The following issues have been resolved in this update:
- Exchange Service Host service fails after installing March 2022 security update (KB5013118)
- New-DatabaseAvailabilityGroupNetwork and Set-DatabaseAvailabilityGroupNetwork fail with error 0xe0434352
- The UM Voicemail greetings function stops working and returns error 0xe0434352.
- Unable to send mails through EAS and Get-EmailAddressPolicy fails with Microsoft.Exchange.Diagnostics.BlockedDeserializeTypeException after installing Security Update KB5008631 for Exchange 2019
FAQs
My organization is in Hybrid mode with Exchange Online. Do I need to do anything?
While Exchange Online customers are already protected, the May 2022 SUs do need to be installed on your on-premises Exchange servers, even if they are used only for management purposes. You do not need to re-run the Hybrid Configuration Wizard (HCW) after installing updates.
Do I need to install the updates on ‘Exchange Management Tools only’ workstations?
Servers or workstations running only the Management Tools role (no Exchange services) do not need these updates. If your organization uses only an Exchange Management Tools machine, then you should install the May 2022 SU package on it and run /PrepareAllDomains as per the above instructions to update Active Directory permissions.
Instructions seem to indicate that we should /PrepareAllDomains after May 2022 SU is installed; is that correct?
Yes. The May 2022 SU package updates files in Exchange server folders when it is installed. That is why once those files are updated (SU is installed) – we ask you to go and explicitly /PrepareAllDomains using setup from v15Bin folder.
NOTE: This post might receive future updates; they will be listed here (if available).
The Exchange Server Team
by Scott Muniz | May 10, 2022 | Security, Technology
This article is contributed. See the original author and article here.
CISA and the Federal Bureau of Investigation (FBI) have updated the joint cybersecurity advisory, Strengthening Cybersecurity of SATCOM Network Providers and Customers, originally released March 17, 2022, with U.S. government attribution to Russian state-sponsored malicious cyber actors. The United States assesses Russia launched cyberattacks in late February against commercial satellite communications networks to disrupt Ukrainian command and control during the Russia invasion, and those actions had spillover impacts into other European countries.
CISA is working with both international and JCDC partners to strengthen our collective cybersecurity resilience—especially in the critical infrastructure that governments and citizens rely on—and to protect against and respond to malicious cyber activity. We continue to urge public and private sector partners to review and implement the guidance contained in U.S. government cybersecurity advisories, including Strengthening Cybersecurity of SATCOM Network Providers and Customers, the January 2022 cybersecurity advisory on Protecting VSAT Communications, and the April 2022 cybersecurity advisory on Russian State-Sponsored and Criminal Threats to Critical Infrastructure. CISA also recommends partners review the CISA Shields Up, Shields Up Technical Guidance, and Russia webpages to stay current on the preventive measures that can help guard against Russian cyber threats and tactics.
by Contributed | May 9, 2022 | Technology
This article is contributed. See the original author and article here.
Descubra vulnerabilidades e automatize a atualização de dependências com GitHub Dependabot
Dando continuidade ao artigo Como manter meu código seguro usando o GitHub nesse artigo vamos ver como o Dependabot pode nos ajudar a manter nosso código mais seguro.
Dependabot
Dependabot é um recurso que além de identificar vulnerabilidades nas dependências do seu código, ele pode te ajudar criando Pull Requests com a atualização da dependência com a versão já corrigida. Ele está disponível para todos os repositórios e recentemente foi liberada uma atualização que permite a atualização das dependências privadas do seu repositório.
Para isso ele conta com o GitHub Advisory Database uma lista de vulnerabilidades de segurança conhecidas, agrupadas em duas categorias:
GitHub-reviewed advisories – As vulnerabilidades que já foram identificadas e analisadas pelo GitHub, para essas são geradas notificações sempre que uma vulnerabilidade for identificada nas dependências do seu repositório, para isso, o alerta do Dependabot deve ser ativado.
Unreviewed advisories – As vulnerabilidades que estão listadas no feed do National Vulnerability Database, o Dependabot não gera alertas para essas vulnerabilidades, pois não houve verificação sobre a validade ou integridade por parte do GitHub.
O GitHub adiciona vulnerabilidades na lista do GitHub Advisory Database a partir das seguintes fontes:
Como habilitar o Dependabot
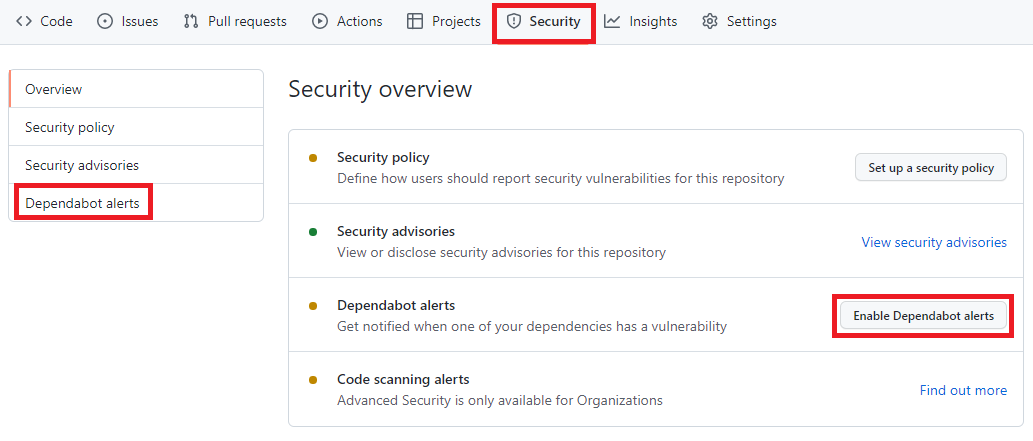
Para habilitar, você precisa acessar o menu Security -> Dependabot alerts e habilitar a opção Enable Dependabot alerts
Painel de Segurança do portal do GitHub, nela está destacado os seguintes termos: Security, Dependabot alerts, Enable Dependabot alerts
Com isso o Dependabot já passa a monitorar seu repositório em busca de vulnerabilidades nas dependências do seu repositório.
A partir de agora o Dependabot passará a gerar aletas sempre que:
- Uma nova vulnerabilidade for adicionada no GitHub Advisory Database
- O Gráfico dependência for atualizado. Exemplo um desenvolvedor faz um push de um commit que atualiza alguma dependência que esteja na lista do GitHub Advisory Database .
O que acontece depois de habilitar o Dependabot
Acessando novamente o menu Security -> Dependabot alerts é possível visualizar se há algum alerta de vulnerabilidade. Você terá acesso a uma lista completa de todas as vulnerabilidades encontradas em seu repositório, podendo filtrar por Pacote, ecossistema ou manifesto, há a opção de ordenar por mais novo, mais antigo, gravidade, localidade do manifesto ou nome do pacote.
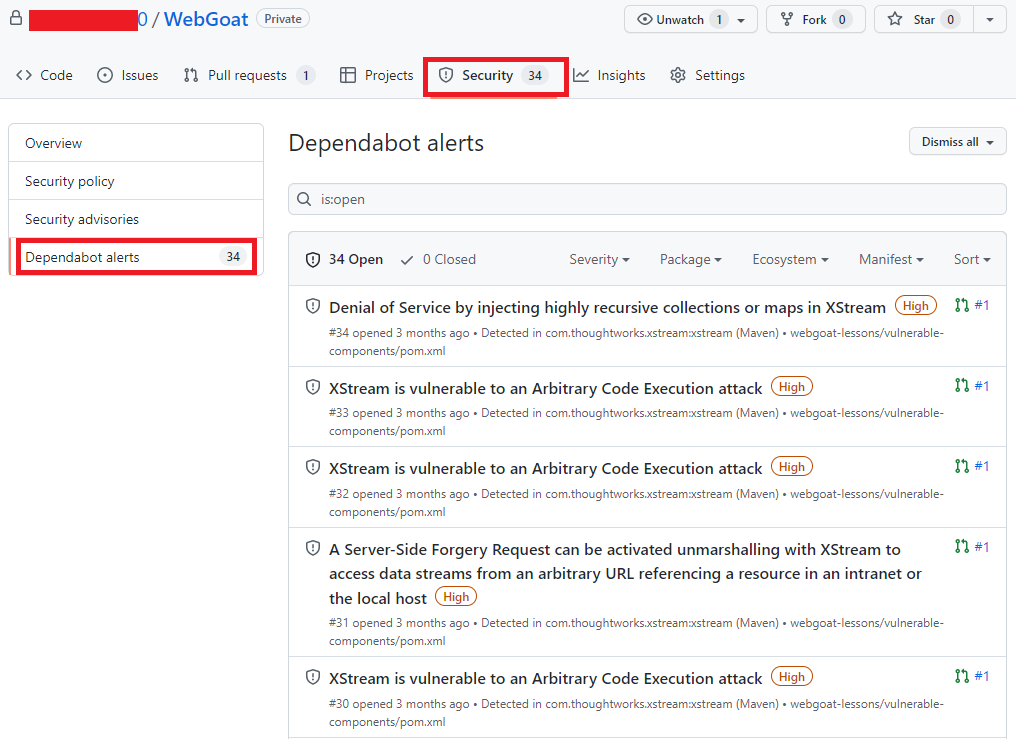 Alertas do portal do GitHub, agora com uma lista de vulnerabilidades e com os seguintes termos destacados: Security e Dependabot alerts
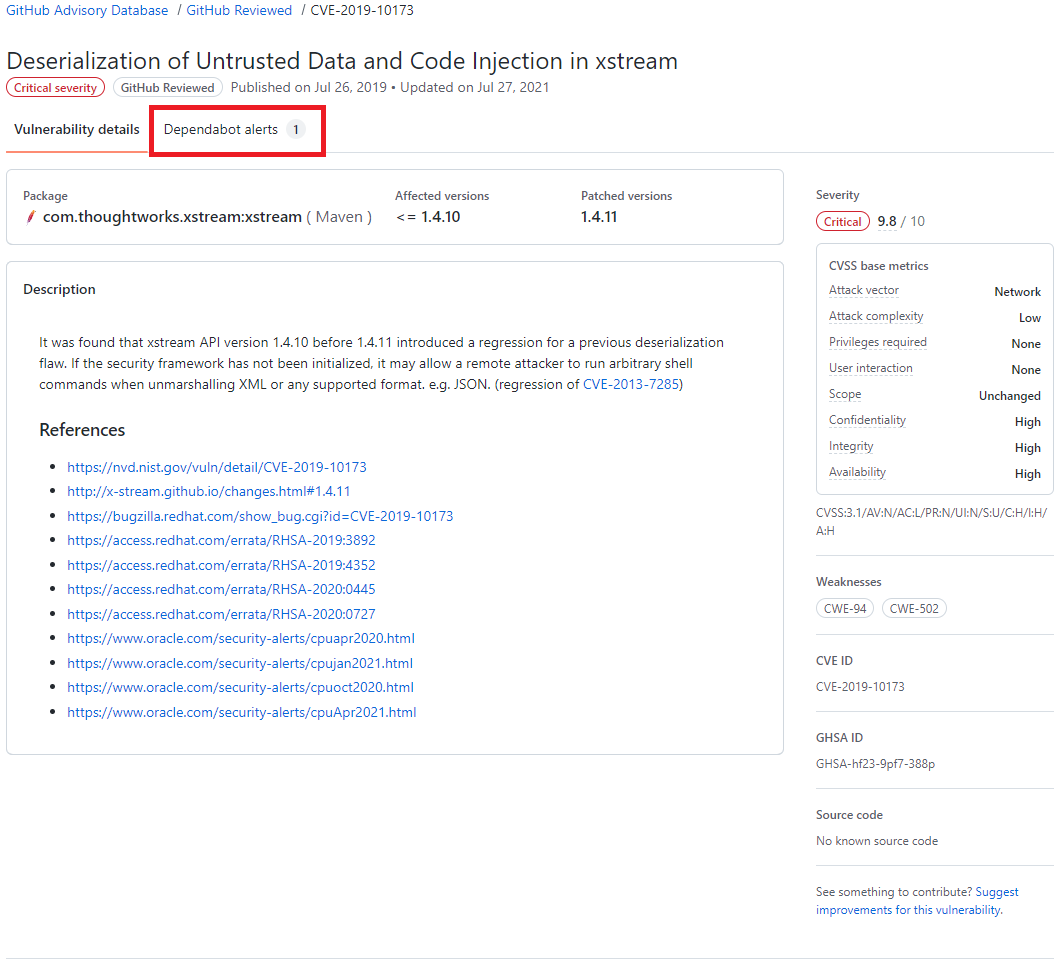
Clicando no alerta é possível obter mais informações sobre a vulnerabilidade, que pode incluir a descrição, nível de gravidade, nome do pacote afetado, ecossistema do pacote, as versões afetadas e as versões de patch, impacto e algumas informações opcionais como, por exemplo, referências, soluções alternativas e créditos. Além disso, um link para o registro CVE, onde você pode ler mais detalhes sobre a vulnerabilidade, suas pontuações CVSS e seu nível de gravidade qualitativa.
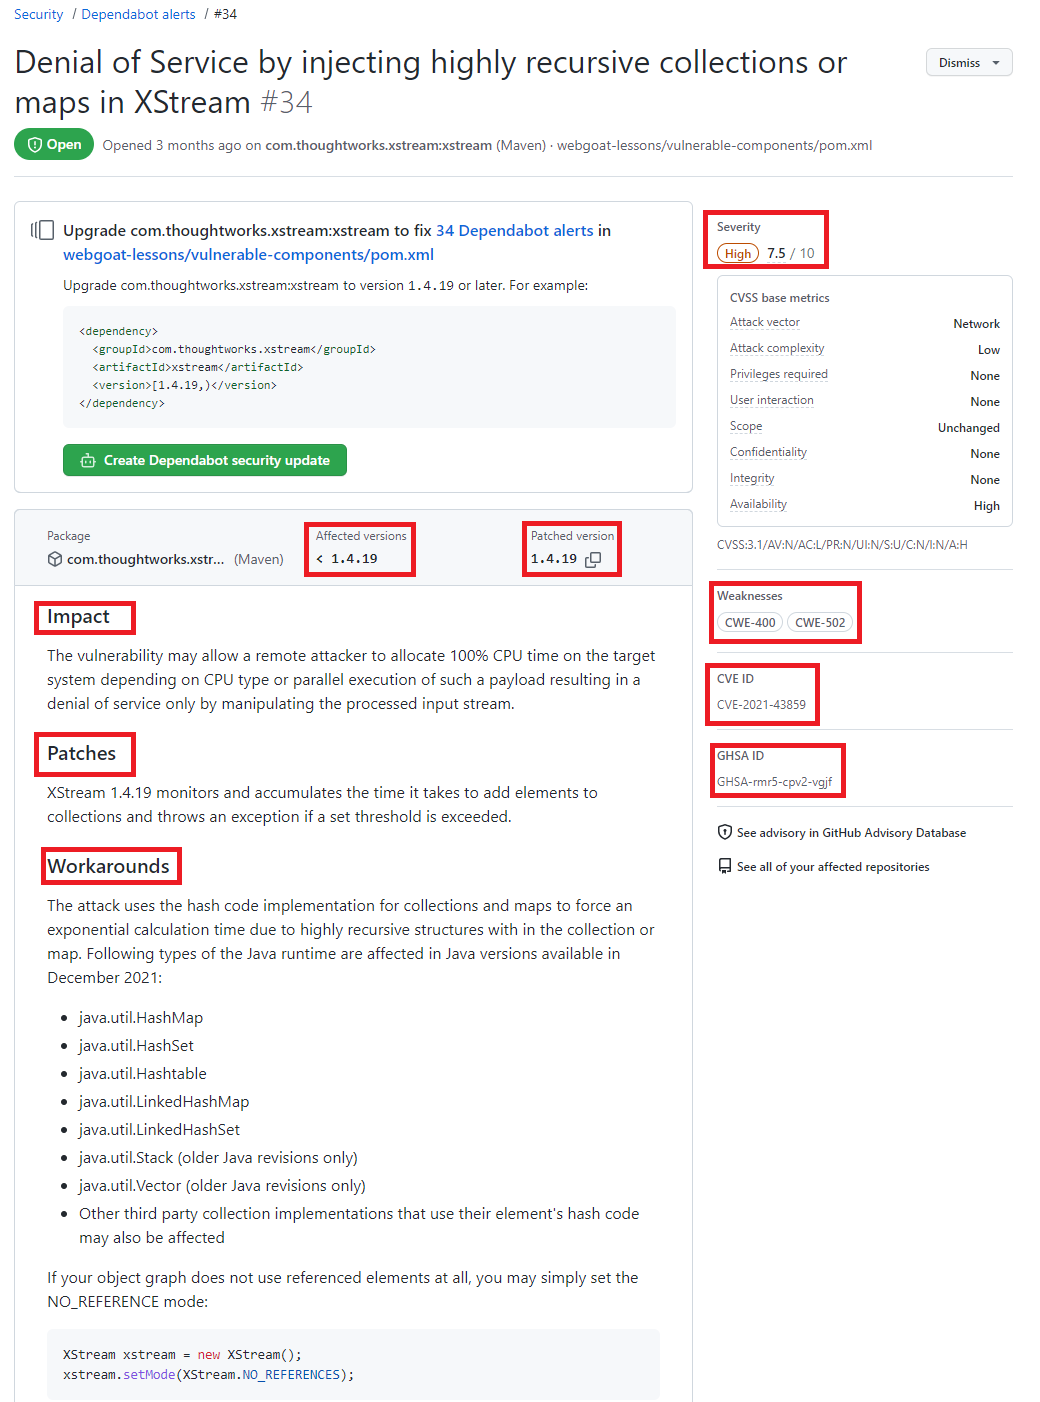 Detalhes de uma vulnerabilidade destacando as seguintes informações Severity, Affected versions, Patched version, impact, Patches, workarounds, weaknesses CVE ID e GHSA ID
O dependabot também envia notificações para os mantenedores do repositório onde a vulnerabilidade foi encontrada. Por padrão o mantenedor receberá um e-mail com um breve relato sobre a descoberta.
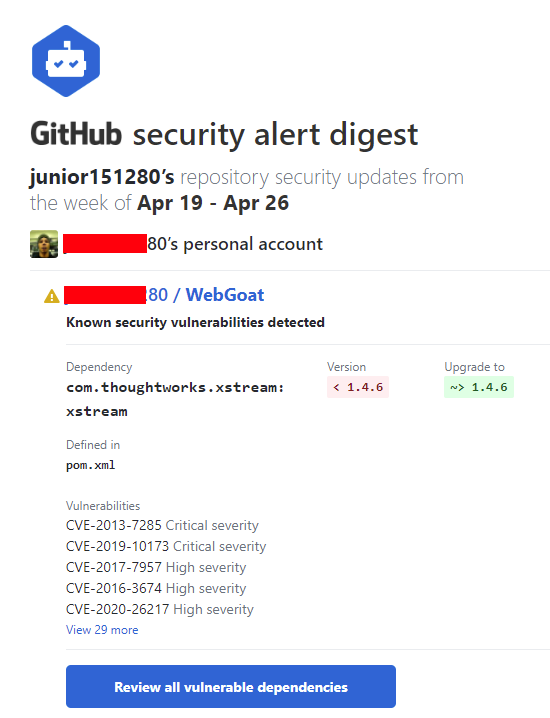 E-mail enviado pelo Dependabot
Localize repositórios com vulnerabilidades
Acessando o GitHub Advisory Database é possível identificar quais repositórios possui dependências com vulnerabilidade, para isso acesse o GitHub Advisory Database clicando nesse link.
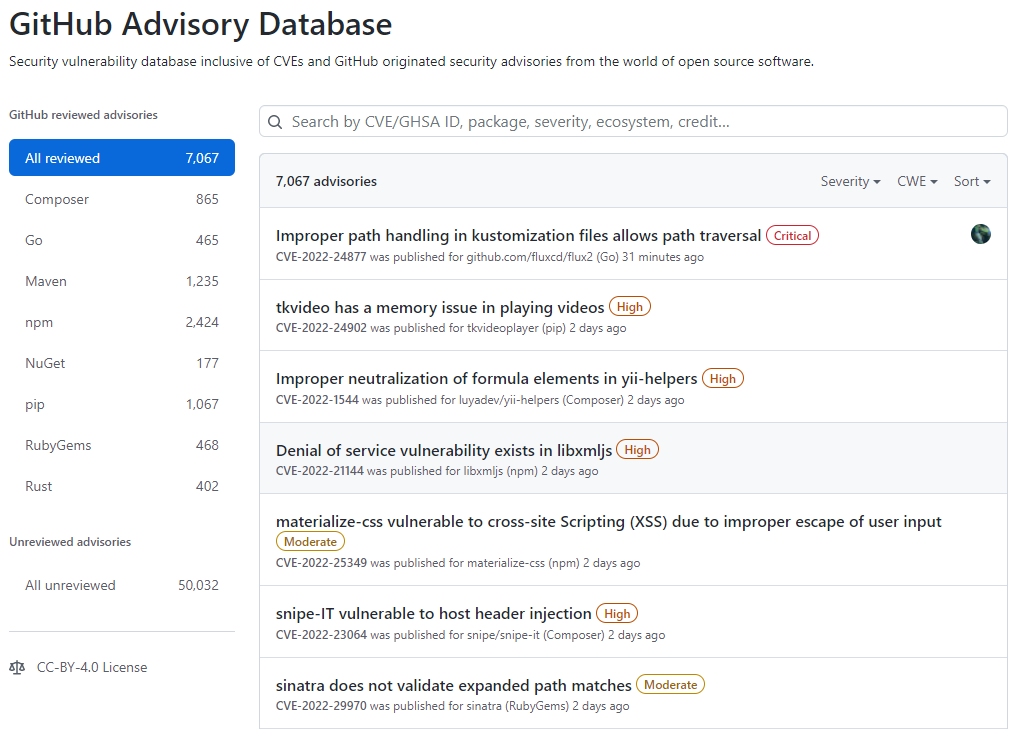 Tela inicial do GitHub Advisory Database
No GitHub Advisory Database é possível filtrar as vulnerabilidades por ecossistema, CVE/GHSA ID, nome do pacote, gravidade ou ordenar por mais novo, mais antigo, atualizado recentemente ou menos atualizado recentemente. Ao localizar a vulnerabilidade desejada é possível ver quais repositórios utiliza a dependência.
 Resultado de pesquisa do GitHub Advisory Database, destacando o termo Dependabot alert
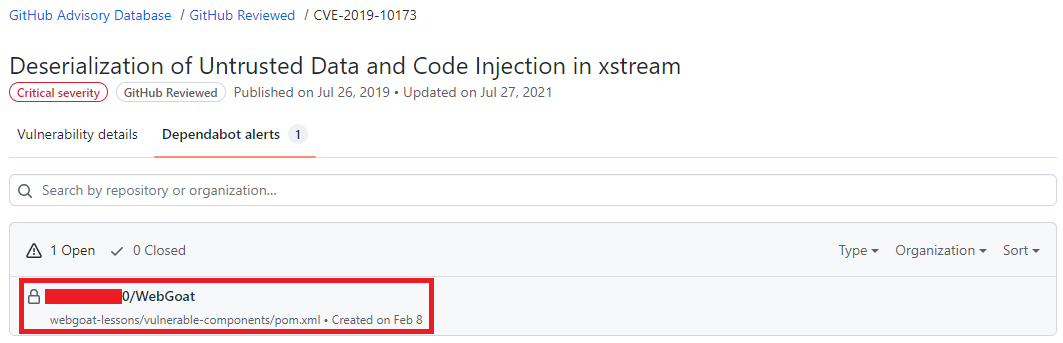 Resultado de pesquisa do GitHub Advisory Database mostrando quais repositórios há a dependência selecionada, o nome do repositório está destacado.
Atualize as dependências com ajuda do Dependabot
Após um alerta ser gerado, se já existir uma versão com a correção da vulnerabilidade o Dependabot abre um Pull Request com a ação corretiva, em alguns casos quando o as informações são suficientes uma pontuação de confiabilidade é gerada.
O Pull Request passa pelos mesmos testes que os demais Pull Requests gerados pelo time responsável pelo repositório, portanto fica na responsabilidade do mantenedor do repositório avaliar e se estiver tudo correto aprovar o Pull Request. A aprovação dos Pull Requests podem ser automatizada utilizando as Actions para saber mais sobre como automatizar o Dependabot com o GitHub Actions acesse esse link
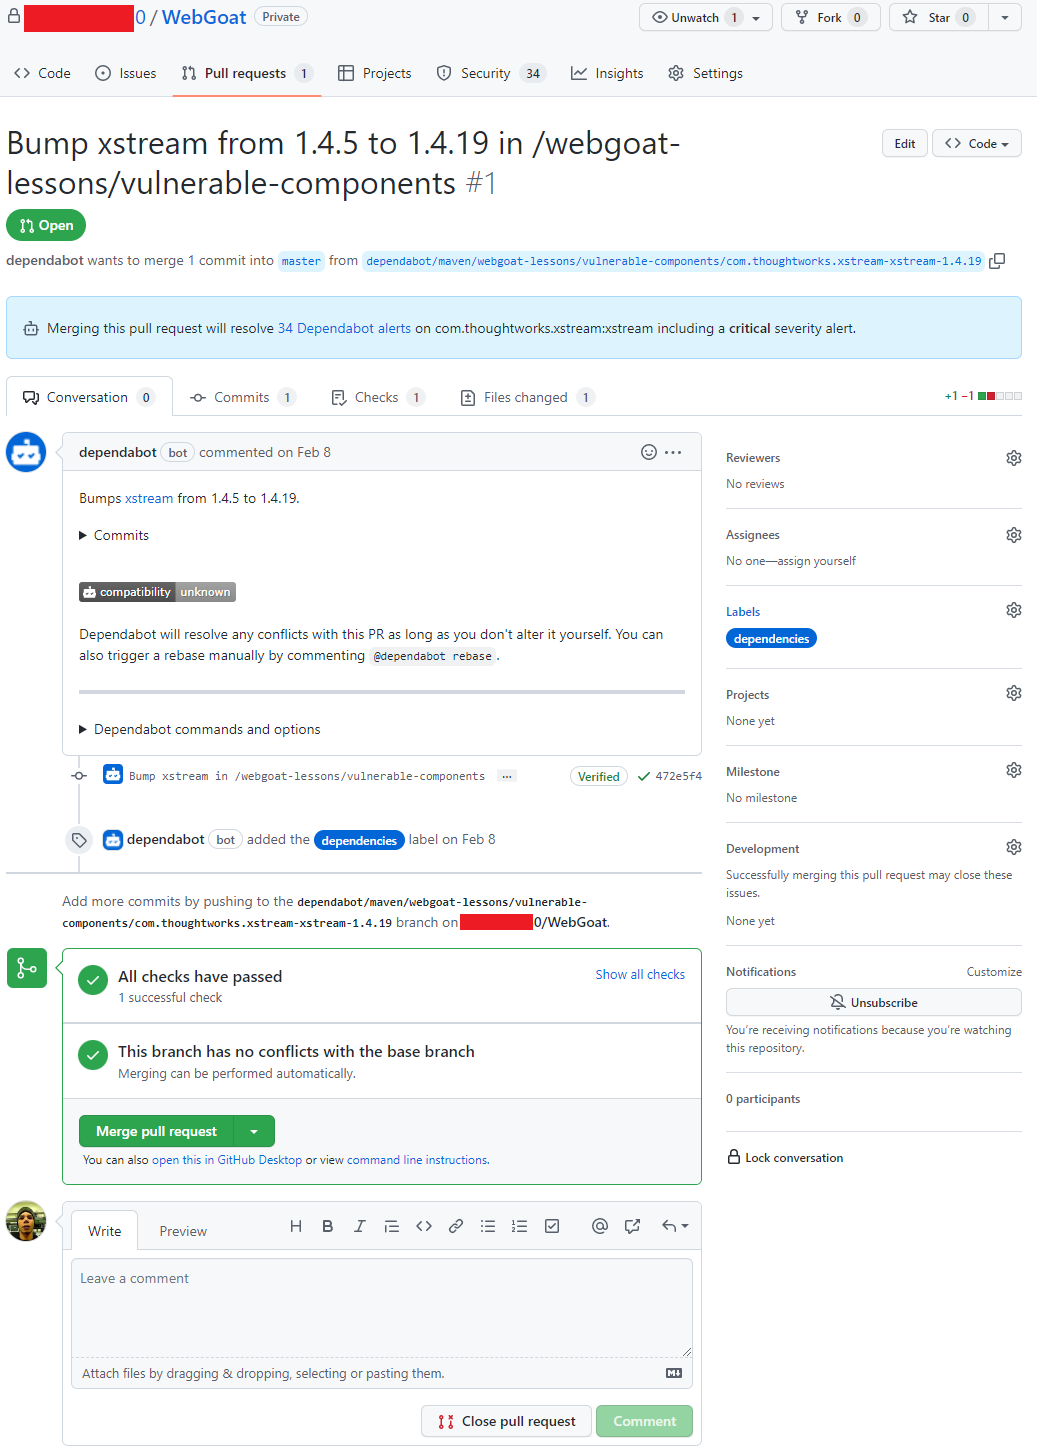 Pull request aberto pelo Dependabot
Conclusão
O Dependabot é um recurso que não podemos deixar de habilitar em nossos repositórios, é grátis, faz boa parte do trabalho sozinho e nos ajuda a manter nosso código muito mais seguro.
by Scott Muniz | May 9, 2022 | Security
This article was originally posted by the FTC. See the original article here.
Brought to you by Dr. Ware, Microsoft Office 365 Silver Partner, Charleston SC.
by Contributed | May 8, 2022 | Technology
This article is contributed. See the original author and article here.
This 7th of May, my colleague Paloma Garcia and I, delivered a session in Spanish “No encuentro donde esté el problema de la query” where we compare the performance in two different environments (production and staging) where our customer reported differences in execution time. In this article you could find out the link about the session recorded in Global Azure event
Abstract Spanish version
=======================
Muchas veces recibimos casos en soporte de Azure SQL Database donde nos indican que al ejecutar la query en la base de datos de producción tarda más que en la base de datos de preproducción con las mismas características de base de datos. En esta charla explicaremos una serie de pasos que seguimos para encontrar cuál es la razón de esta diferencia e intentaremos arreglar el entuerto.
Abstract English version
=======================
Many times, we received cases in Azure SQL Database support where customer noticed us that running a query on the production database takes longer than on the staging database with the same database characteristics. In this session we will explain a series of steps that we follow to find what is the reason for this difference and we will try to fix the mess.
Enjoy!
by Contributed | May 7, 2022 | Technology
This article is contributed. See the original author and article here.
Final Update: Saturday, 07 May 2022 06:09 UTCCustomers with Application Insights components in Korea South during 05/07, 03:45 UTC through 05/07, 04:30 UTC may have experienced intermittent data gaps and incorrect alert activation.- Root Cause: We determined that one of our downstream services became unhealthy.
- Incident Timeline: 45 minutes – 05/07, 03:45 UTC through 05/07, 04:30 UTC
We understand that customers rely on Application Insights as a critical service and apologize for any impact this incident caused.-Deepika
Initial Update: Saturday, 07 May 2022 04:58 UTCCustomers with Application Insights components in Korea South may experience intermittent data gaps and incorrect alert activation starting from 03:45 UTC.- Work Around: None
- Next Update: Before 05/07 10:00 UTC
We are working hard to resolve this issue and apologize for any inconvenience.-Deepika

Recent Comments