On January 25, 2023, we published the 2023 release wave 1 plans for Microsoft Dynamics 365 and Microsoft Power Platform, a compilation of new capabilities planned to be released between April 2023 and September 2023. This first release wave of the year offers hundreds of new features and enhancements, demonstrating our continued investment to power digital transformation for our customers and partners.
This release wave builds on our commitment to create applications and experiences that add value to every role by breaking down silos between data, insights, and people. New capabilities empower new ways to make informed decisions with AI-guided insights and suggested actions, easier ways to automate tasks and processes, and collaboration seamlessly integrated into the flow of work, plus, new low-code ways for anyone to build solutions.
As part of our commitment to creating great customer experiences, we have introduced a new way to interact with release plans. The release planner for Dynamics 365 and Microsoft Power Platform enables users to view and manage release plans across all active waves in a unified and interactive interface while giving them the option to personalize, filter, sort, and share these plans.
Highlights from Dynamics 365
Dynamics 365 Marketing delivers connected sales and marketing capabilities to enable marketers and sellers to act as a unified team and accelerate their pipelines. New features such as a new business-to-business (B2B) analytics dashboard, frequency capping, multiple email recipient activation, emails timeline, customizable preference centers, and Urchin Tracking Module (UTM) marketing tagging will be released in this wave to allow businesses to increase their output, organizational efficiency, and analyze the impact of their campaigns to reach higher levels of marketing maturity.
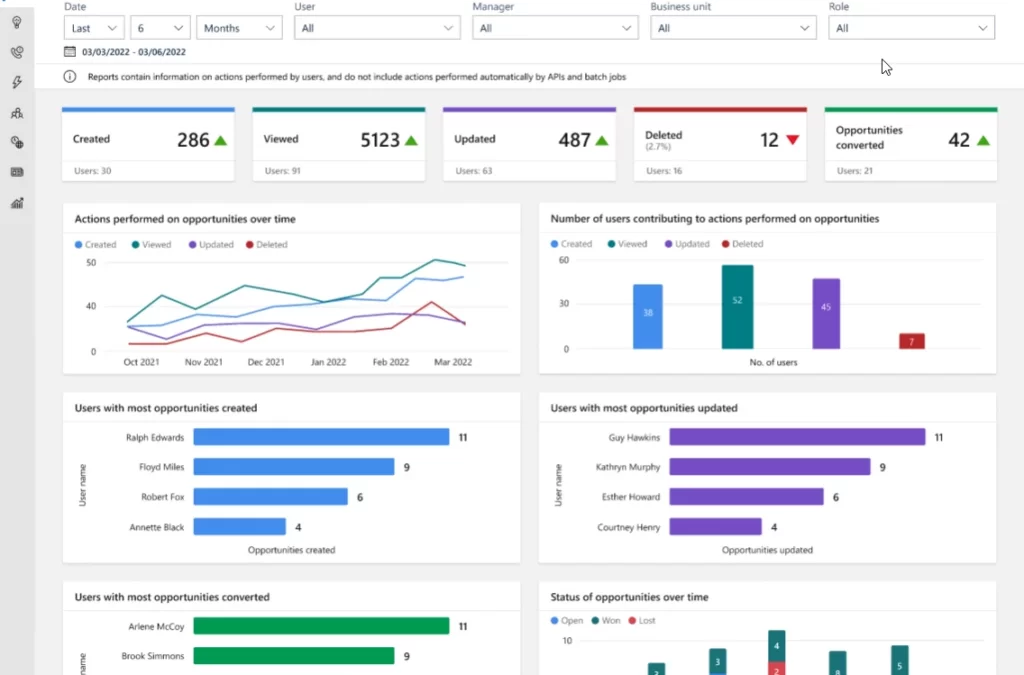
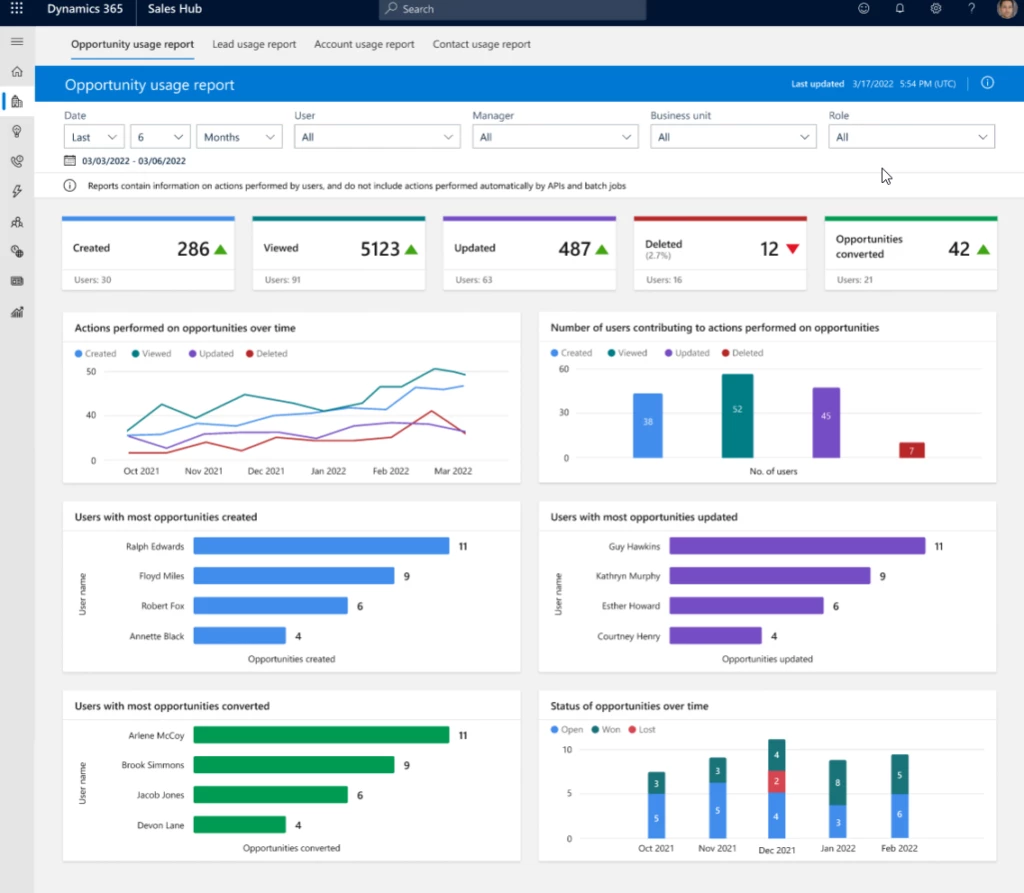
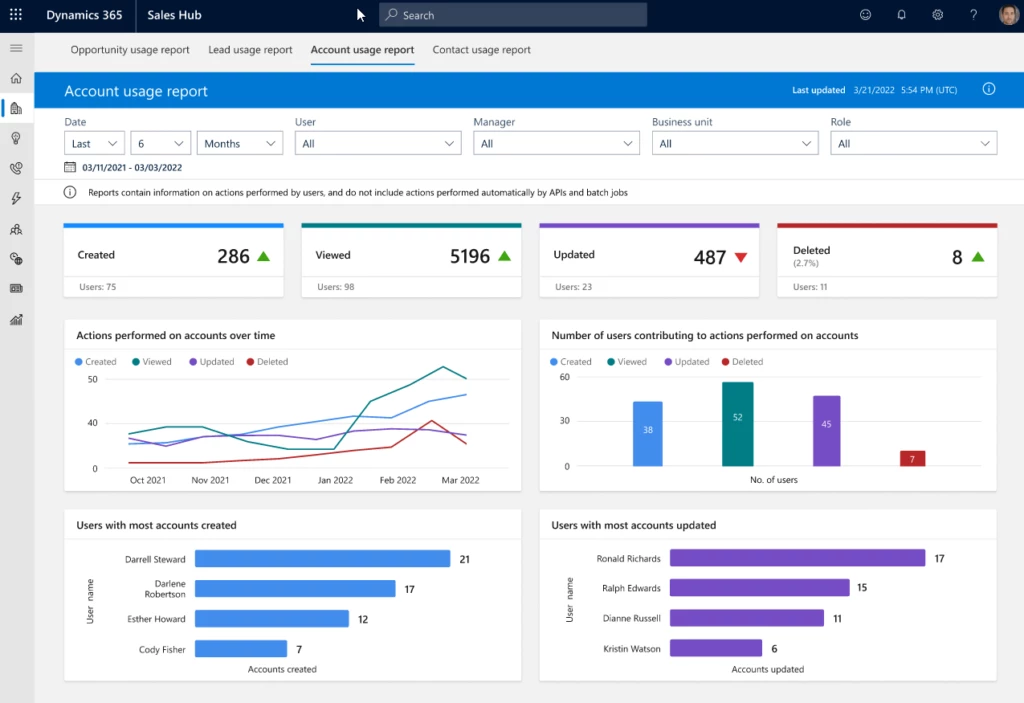
Dynamics 365 Sales brings new features such as enhanced sequence capabilities supporting personalized and account-based engagement, actionable AI-powered suggestions within the seller workflow, an updated form layout, and new opportunity management workspace. Additionally, enhanced email templates, content suggestions and text message capabilities, as well as various new abilities to create, loop, and optimize sales sequences will be released during this wave.
Dynamics 365 Customer Service empowers agents to work more efficiently with enhancements to voice features, unified routing, embedded Microsoft Teams collaboration, and elements of the agent workspace such as the case form, timeline, and conversation control. Throughout this wave, we will continue to invest in AI across the contact center with intelligent-suggested replies and robust real-time analytics with customization.
Dynamics 365 Field Service is continuing to improve the new schedule board for dispatchers this wave. We are also supporting our frontline workers by allowing them to see their appointments in Outlook, find information faster through improved global search, and recognize improvements in performance and reliability on the mobile app.
Dynamics 365 Finance is focused on enhancing organizations’ visibility into their data, continuing finance automation, and expanding out-of-the-box country coverage in Latin America. Other enhancements such as further automation of complex tax scenarios, full end-to-end automation of accounts payable and ledger settlements to expedite the close and enable talented finance users to spend more time focusing on value-added activities will also be released.
Dynamics 365 Supply Chain Management continues to deliver increased agility and resilience across the supply chain with enhancements to omnichannel sales strategies with improved ways of managing attribute-based pricing, integrated soft reservations, and optimized end-to-end process integration across Dynamics 365 Sales and Supply Chain Management. Investments to improve agility and increase efficiency for discrete manufacturers, maintenance workers, and warehouse workers will also be a focus for this wave.
Dynamics 365 Project Operations is continuing to invest in capabilities to empower project managers and project teams with new features like expanding the project budgeting and time-phased forecasting to resource/non-stocked deployment modes and completely lighting up the core experiences for expense management on the web and mobile form factors. Across-the-board investments in performance and usability with an uptake of modern and fluent controls in sales, billing and pricing, and subcontracting experiences are also targeted for this release wave.
Dynamics 365 Guides will continue investing in capabilities to improve collaboration experiences for users on HoloLens 2. Key updates include improvements in handling incoming calls, join settings, and more accurate mixed reality annotations will also be coming in this wave. We will also be adding new holographic workflows and features like the ability to manipulate a hologram as an operator and taking a photo while in a guide.
Dynamics 365 Human Resources will continue to expand the human capital management (HCM) ecosystem and further investment in expanding our payroll partner network to provide broader coverage for global organizations. We will also be providing better experiences to resource managers in Project Operations by integrating employee skill, compensation, and leave information while helping employees grow their careers by bringing project and experience information back into employee profiles.
Dynamics 365 Commerce is enabling new and updated B2B experiences, including the modeling of distributers as sellers, introducing a distributer fulfillment dashboard, and improving the out-of-the-box B2B user sign-up flow. We are revising and improving our payment flows and enabling network health checks to diagnose network-related issues that can impact point of sale (POS) uptime for POS and Store Commerce users. We will also be investing in asynchronous payment capabilities to provide support for Klarna and other “buy now, pay later” methods and ACH real-time banking.
Dynamics 365 Fraud Protection is introducing Assessments API in 2023 release wave 1 that will allow customers to define their own fraud event (in addition to the default events covered by Fraud Protection such as Purchase Protection and Account Protection). This functionality will allow customers to configure Fraud Protection to protect against fraud events specific to their businesses.
Dynamics 365 Business Central will continue developing enhanced finance capabilities for intercompany transactions as well as several improvements to the warehouse management area to make customers’ processes more efficient. More default setup data will also be provided during this wave to expedite customers’ onboarding procedures. Furthermore, Microsoft Power Platform and Microsoft 365, including Teams, capabilities will be improved enabling better reporting, automation, and collaboration opportunities.
Dynamics 365 Customer Insights will bring enhancements such as improved data interoperability and governance features allowing the ability to control and restrict access to data, configurations, and actions; an increased maturity around application lifecycle management and enterprise lifecycle management; increased activation capabilities through tighter integration with Microsoft Dataverse; and will receive navigational guidance, AI-powered suggestions, and task assistance increasing the depth of insights obtained from the product with less time investment.
Dynamics 365 Connected Spaces delivers alerts and notifications via Teams or Outlook when business AI-skills detect actionable patterns within a space containing vehiclesstationary or mobile. Throughout this wave, improvements will be released enabling customers to use the Microsoft Azure Stack HCI devices for configuring Connected Spaces to run AI models at the edge in addition to the existing Microsoft Azure Stack Edge devices.
Dynamics 365 Customer Voice is investing infunctionalities to unblock key scenarios for customers and is focusing on improving the overall usage experience along with the architecture evolution and stability fixes for survey owners and responders. We will focus on delivering features such as the transfer ownership of an orphan project in case a project owner has left the organization, as well as allowing survey responders to record partial survey responses.
Microsoft Supply Chain Center delivers improvements to organizations’ management of their supply chain by enhancing their end-to-end visibility of their supply chain, improving AI-based recommendations, and enabling them to seamlessly collaborate with their teams and suppliers on the workflow, resulting in better orchestrated business processes.
Implementation portal
We are launching a new implementation portal to provide contextual guidance and recommended practices for Dynamics 365 implementations, in order to enable greater success once implementations go live. This portal is based on the Success by Design for Dynamics 365 framework put together by the FastTrack for Dynamics 365 team.
2023 release wave 1 for Dynamics 365
Check out new capabilities for Dynamics 365 with the 2023 release wave 1 plan.
Highlights from Microsoft Power Platform
Power BI continues to invest in empowering individuals, teams, and organizations to drive a data culture. For individuals, we’re enhancing the creation experience, bringing more parity on the web, and adding the Power Query diagram view into Power BI. For teams, we’re bringing enhancements to meetings and multitasking to help users seamlessly work with their data wherever they work.
Power Apps is focusing on reducing risk for organizations with advanced governance capabilitiesensuring easy onboarding and using low-code capabilities in a manageable way for the organization to scale. Makers and developers of all skill levels will be more productive with modern experiences to build apps, manage data, and logic. Customers will benefit from modernization of web and mobile experiences ensuring modern and fast experiences across apps.
Power Pages continues to invest in bringing more out-of-the-box capabilities to support both low-code and no-code development as well as professional developers. New features in this release will allow makers to have additional capabilities and solution templates in the design studio. Professional developers will be able to perform additional actions and work with code productively using the Microsoft Power Platform CLI tool and Microsoft Visual Studio Code, and administrators will be enabled to better manage and govern their Power Pages sites.
Power Automate is releasing new capabilities to simplify creating new flows by describing them in natural language. This, with other experience improvements for creating and authoring flows, means it’ll be easier than ever for new users to get started. These improvements include introducing work queues where automatable tasks can be viewed and managed together as well as providing simpler connectivity to a machine for desktop flows, eliminating the need for additional installs and managing password management.
Power Virtual Agents offers a new unified authoring canvas that is Microsoft’s single conversational AI studio for all bot-building needs. With the continuing integration with Microsoft Bot Framework capabilities and Microsoft Azure Cognitive Services, bot creatorsfrom subject matter experts to developersare empowered to begin building today with the public preview. The advanced authoring canvas will be generally available this wave.
AI Builder will bring document processing improvements that will include more prebuilt model capabilities like contract processing, the ability to identify personal information, and the possibility to extract field types from documents. We’re also focusing on facilitating model governance and licensing by improving our admin interfaces to make it easier to govern how AI Builder credits are used across environments, apps, and flows.
For a complete list of new capabilities, please check out the Dynamics 365 2023 release wave 1 plan and the Microsoft Power Platform 2023 release wave 1 plan.
2023 release wave 1 for Microsoft Power Platform
The first release wave of the year offers many new features and enhancements for Microsoft Power Platform.
Early access period
Starting January 30, 2023, customers and partners will be able to validate the latest features in a non-production environment. These features include user experience enhancements that will be automatically enabled for users in production environments during April 2023. To take advantage of the early access period, try out the latest updates in a non-production environment and effectively plan for your customer rollout. To take advantage of the early access period, try out the latest updates in a non-production environment, and effectively plan for your customer rollout. Check out the 2023 release wave 1 early access features for Dynamics 365 and Power Platform or visit the early access FAQ page.
View the latest product updates and release highlights, and share your feedback in the community forums via Dynamics 365 or Power Platform.
The post 2023 release wave 1 plans for Microsoft Dynamics 365 and Power Platform now available appeared first on Microsoft Dynamics 365 Blog.
Brought to you by Dr. Ware, Microsoft Office 365 Silver Partner, Charleston SC.


Recent Comments