ADX Web Explorer usability survey

This article is contributed. See the original author and article here.

We here in the ADX Product Management team would love to hear from you.

Your feedback is crucial for us to be able to create the best ADX user experience.

Please take the time to answer our quick survey about your tab navigation experience in the ADX Web Explorer.

It takes only 3 minutes to make a difference.


Take the survey


Help shape the future of ADX Web Explorer, go to ADX User Voice to ask and upvote feature requests

 
What is shutting down my Azure Virtual Machine?

What is shutting down my Azure Virtual Machine?

This article is contributed. See the original author and article here.

Recently I came across a scenario where someone had changed the time on a scheduled Azure virtual machine shut down, but the VM was not adhering to the shut down new time.. Learn how asking the wrong question can cause you to miss the answer!


Background – the change
The systems administrator had an Azure Automation Runbook in place that told the Azure Windows Server virtual machine to shut down at 10pm each night. After changing the script to 11pm, the admin noticed that the server was still shutting down at 10pm.


Scheduled-StopVM.jpg


So they started to investigate the wrong question …

“Why isn’t the VM acknowledging the changed time in the updated schedule?”


The importance of broader questions
With this question, we’re assuming part of the cause – that the VM is controlled by the Azure Automation Runbook but somehow doesn’t realize there has been an updated change to the schedule. We could wrack our brains & comb through logs for days, without answering this question. Why? Because it’s the wrong question to ask.


A better question
Instead, let’s rephrase the problem a little broader.
“WHY is the VM shutting down at 10pm?”


Notice I didn’t say “why is the VM still shutting down at 10pm”. I want to set aside for a moment any past behavior versus expected new behavior and instead go exploring some of the reasons why a virtual machine would shut down.

Shut down causes/triggers
Let’s brainstorm a few “usual suspects” that might shut down a VM:
1. Azure Automation  – yes, that’s what we were first looking at. Has it saved correctly? Are there any other runbooks executing first?
2. Windows Update – settings on the server itself, Azure Update Management, or even a third party management tool (though in none of those scenarios would I expect it to happen every day, but I have seen stranger things!).
3. Azure Dev/Test Labs – These pre-configured Azure Resource Manager templates let you specify auto shutdown (and auto start) times and policies for your Azure VMs.
4. Something else controlling that server – think of a local script, application or third party management tool. Could the cause of the shut down be inside the VM itself and not related to Azure?


See if you can identify something I’ve left off this list, on purpose!


Analyzing the shut down event
Now I have a few ideas outside the scope of just that one script, it’s time to go and look at the facts.


Starting with the Windows Server event log, it tells me that a shut down event was initiated at 2200hrs. Yeah, no kidding. But it’s not very good at tell me what initiated it. This gives me a clue that it may be a factor outside of the server OS.


Next, I’ll check the VM’s Activity log in the Azure portal. This logs subscription-level events, including those triggered by Azure Policy. Now we can see that “Azure Lab Services” initiates our shut down events at 10:00pm daily – as well as our . That is not our Azure Automation Runbook.


ActivityLog_ShutdownEvents.jpg


This server is not part of an Azure Dev/Test Lab though, so what have we missed?


Auto-shutdown support for Azure VMs
One place we didn’t look was the Operations section of the Azure VM, in the Azure Portal. Nestled in with Azure Bastion connection, Backup, Policies etc. (relevant to this machine), is the Auto-shutdown section!

And here we’ve found the cause of our shutdowns.

AutoShutdown.jpg

The properties of the Virtual Machine had been configured to shut down the VM daily at 10pm. 


Summary
If you’ve ever scratched your head over a problem, only to have someone else quickly find the cause … welcome to the human race! Sometimes our troubleshooting questions lead us in a defined direction, missing the clues that we actually need. So the next time you’re faced with a problem, step back and look at what questions you are asking to try and solve it, and what assumptions they may contain.


Learn more with our Introduction to Azure Virtual Machines, on Microsoft Learn.


Ingest ProxySQL Metrics into the Azure Monitor Log Analytics Workspace

Ingest ProxySQL Metrics into the Azure Monitor Log Analytics Workspace

This article is contributed. See the original author and article here.


ProxySQL have rich internal functioning metrics which could be accessed from its stats database through the Admin interface, and the stored metrics are the snapshot of a particular point of time when you select the metric table. When troubleshooting the problem, we need to review and accumulate the historical metrics data with powerful query functions like Azure Monitor Kusto Queries to help understand the overall status. In this blog, we will introduce how to post the metrics to Azure Monitor Log Analytics Workspace and leverage the powerful Kusto query language to monitor the ProxySQL statistics metrics.

Access the ProxySQL Metrics for Monitoring:

1. Connect the ProxySQL Admin interface through any client using MySQL protocol with the admin credential like below:

mysql -u admin -padmin -h 127.0.0.1 -P6032

2. Access the statistics metrics by select query like below example:

select Client_Connections_aborted from stats.stats_mysql_global

3. Please refer the metrics detail in https://proxysql.com/documentation/stats-statistics/, there are 18 stats tables storing important monitoring data viz the front end and backend connections, query digest, GTID, prepared statements and etc.

Note: ProxySQL is an open source community tool. It is supported by Microsoft on a best effort basis. In order to get production support with authoritative guidance, you can evaluate and reach out to ProxySQL Product support.

Ingest the Metrics to external monitoring tool – Azure Monitor:

1. Assume you have installed ProxySQL on a Linux VM already, as the Admin interface is only allowed to access locally, we need to run the ingestion code side by side on the same VM. The ingestion sample code will query the ProxySQL stats metrics then post the data to the Logical Workspace in a regular 1-minute interval.

2. Provision a Log Analytics Workspace to store the posted metrics. The Ingestion sample code performs POST Azure Monitor custom log through HTTP REST API: https://docs.microsoft.com/en-us/azure/azure-monitor/platform/data-collector-api

3. The ingestion sample code is developed with .NET Core 3.1, and you could check out from the GitHub repo https://github.com/Azure/azure-mysql/tree/master/ProxySQLMetricsIngest.

Detail usage instructions about the sample ingesting code:

1. Install .NET Core on the Linux VM where ProxySQL is located.

Refer to https://docs.microsoft.com/dotnet/core/install/linux-package-manager-ubuntu-1804


wget -q https://packages.microsoft.com/config/ubuntu/18.04/packages-microsoft-prod.deb -O packages-microsoft-prod.deb

sudo dpkg -i packages-microsoft-prod.deb

sudo add-apt-repository universe

sudo apt-get update

sudo apt-get install apt-transport-https

sudo apt-get update

sudo apt-get install dotnet-sdk-3.1

2. Get the Custom ID and Shared Key of the Log Analytics Workspace

1)      In the Azure portal, locate your Log Analytics workspace.

2)      Select Advanced Settings and then Connected Sources.

3)      To the right of Workspace ID, select the copy icon, and then paste the ID as the value of the Customer ID input for the sample application input.

4)      To the right of Primary Key, select the copy icon, and then paste the ID as the value of the Shared Key input for the sample application input.

3. Checkout the sample code and run:

git clone https://github.com/Azure/azure-mysql

cd ProxySQLMetricsIngest/

dotnet build

sudo dotnet run

Here are some details about the sample:

1)      It is a console application which will ask for the input of the connection string for ProxySQL Admin Interface, (Log Workspace) custom ID and Shared key.

2)      The sample currently register a 1-minute timer to periodically access the ProxySQL stats tables through MySQL protocol and post data into the Log Analytics Workspace

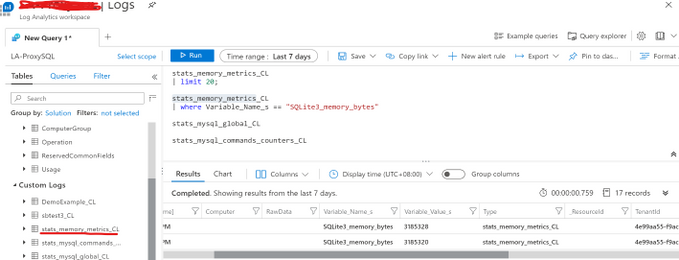
3)      Each ProxySQL stats table name would be used as the Custom Log Type Name, and the Log Analytics will automatically add _CL suffix to generate the complete Custom Log Type Name. For example, the stats table stats_memory_metrics will become stats_memroy_metrics_CL in the Custom Logs list. Below is the example screenshot within the Log Analytics Workspace.


blog_pic_1.png


4)      The sample code also post the error logs in /var/lib/proxysql/proxysql.log to the Log Analytics Workspace as Custom Log Type: PSLogs_CL, to get the file read permission, please execute “sudo dotnet run”. 

4. Use Kusto query in Log Analytics Workspace to operate the ProxySQL metrics data.

Please be noticed that all the ProxySQL stats table values are set to string, so need convert it to number in Kusto query. Below is the example to render a time chart of the memory usage about ProxySQL internal module SQLLite.

blog_pic_2.png


Disclaimer: This sample code is available AS IS with no warranties and support from Microsoft. Please raise an issue in Github if you encounter any issues and I will try our best to address it.


If you have trouble setting up ProxySQL on Azure Database for MySQL, please contact the Azure Database for MySQL team at AskAzureDBforMySQL@service.microsoft.com

Azure Feature Pack 1.19.0 released with Azure Storage SAS authentication support

This article is contributed. See the original author and article here.

Dear SSIS Users,


Azure Feature Pack 1.19.0 is here with an updated Azure Storage connection manager. Now you can configure Azure Storage connection manager to authenticate with shared access signature, and use it in Flexible File Task/Source/Destination.


This new version of Azure Feature Pack is pre-installed on Azure-SSIS integration runtime. To install elsewhere, you can download installation packages from the following links:

Best practices for accelerating cloud migration

Best practices for accelerating cloud migration

This article is contributed. See the original author and article here.

As we navigate the challenges posed by the current environment, many organizations are looking to move to the cloud to not only respond to the current crisis but also be better prepared for future. Below you can see some of the common cloud migration triggers that we see with our customers.


Cloud migration triggers.PNG


Our customers are ready to move to the cloud but don’t know where to begin. They are seeking help and guidance so that they can confidently move their on-premises workloads and applications to the cloud to meet their evolving needs.


Covid response.PNG

Based on our learnings from hundreds of customer engagements, we’ve developed some recommendations and best practices guidance that you can leverage to accelerate your journey to Azure. Listen to Jeremy Winter, Partner Director of Azure Management share his top three recommendations to quickly move to the cloud in this video.


We also kicked off a blog series to address some of the common challenges that our customers face with cloud migration. You can read the kick-off blog to get an idea about the topics we’ll be discussing. We also published the next blog which focuses on financial considerations for cloud migration. Stay tuned and follow the series to learn about critical considerations for migration such as performing assessments, building the landing zone, executing migration and managing your cloud resources.