by Scott Muniz | Jul 21, 2020 | Uncategorized
This article is contributed. See the original author and article here.
Project management, scientific experimentation and software engineering all have at least one component in comment: documentation. Without the basic concept of transferring the knowledge of a given operation from the author to the reader, projects of any nature are doomed to become a maintenance issue, with potentially devastating results.
In Data Projects, we have an interesting issue with this documentation. Whilst the project plans, software specifications and so on are well-defined and mostly consistent in nature and delivery method (such as a Microsoft Word document), comments within the code for a given component are not. Different languages, platforms and other constructs make consistency more challenging. This can become a huge issue when the calling or receiving component needs to rely on the operation of the other component.
To state the obvious: At the very least, you should comment your code with complete, informative information. It’s up to you to understand how your language or compiler uses comments, and you will also have to learn how other popular languages use comments since you may need to read source code from your team.
When I learned to program (on a Mainframe, several hundred years ago) I was taught to write comments detailing the flow of the program first, and then go lay in my code underneath the comments I wrote. “Comment-First” coding.
Depending on the language/interpreter, there are (usually) two types of comments: Line and Block. A Line comment is indicated by some set of symbols (such as — in T-SQL), and is terminated with the end of the line. A Block comment uses different symbols to “start” and “stop” comment text (such as /* and */ in T-SQL), and can span multiple lines.
In general, always prefer Block comments to Line comments. The reason is that lines of text often have different ASCII characters to signal the “EOL” or End of Line for a given software/hardware environment – Linux and Windows terminators for instance. Take, for example, this unfortunate comment:
— Whatever you do, do not run
— TRUNCATE TABLE
— On this code!
(Yes, I’ve something just like this) If the — at the start of the line is removed for the middle component by some accident, you can see that would have a tragic result. I recommend the comment be changed to this:
/* Whatever you do, do not run TRUNCATE TABLE
On this code!
*/
Or even
/* Whatever you do, do not run TRUNCATE TABLE On this code! */
That way you’ll get a syntax error alerting you to an issue if you leave out the start or end comment symbols.
As an aside, each language may handle these comments differently, so make sure you understand how they work, or are even stored. For instance, in some SQL dialects, starting a Stored Procedure with a comment may not save the comment in the Stored Procedure definition (although if you keep the source code it’s there of course). For instance, this:
/* Let’s Create a Procedure to deal with that return data: */
CREATE PROC @ReturnMe AS
….
Might be different when you call to view the text of the Stored Procedure than this:
CREATE PROC @ReturnMe AS
/* Let’s Create a Procedure to deal with that return data: */
….
So what is a “Good” Comment? Well, since I am “old-school”, my comments at the start of the code looks like this:
/* <MyObjectOrFileName>
Purpose: <PurposeOf Code>
Author: <AuthorName>
Date Created: <DateCodeOriginallyCreated>
Edits:
<DateEditedAndReason>
<DateEditedAndReason>
*/
/* <Code SegmentComment> */
/* EOF <MyObjectOrFileName>*/
In fact, for Transact-SQL code, I use this handy tip from my friend Dr. Greg Low to make text that a default Query Window in SQL Server Management Studio.
Other tools have similar constructs, or you can just paste that in OneNote to use.
Is all this a bit much? Yes. Until you need it. Also, coding my comments makes me think more about what I am doing, and slows me down a bit to put higher quality into my work.
There is an interesting new development in Data Projects: Notebooks. I use Jupyter Notebooks quite a bit in Data Science work. Jupyter Notebooks have “Cells” that allow you to enter either Code or Text. The text is usually longer, can be formatted, have links and graphics, and can be quite descriptive. In a way, it’s like a hyper set of comments. So are comments still needed in the Code cells?
Like most Data Project questions, the answer is “it depends”. If the Notebook itself is a code artifact, the Code Cells do not need to be further annotated – that’s the point of the text. If, however, the code in a Cell can be “extracted” for use in some other way, or the Text Cell is used to explain the purpose but not the code flow, then yes, comments are still needed.
So stick to the basics in your software engineering and Data Science work, and ensure you comment your code. As I was taught early on, “Pretend that the person that will maintain your code is a very easily triggered person, and knows where you live.” That’s good advice.
by Scott Muniz | Jul 21, 2020 | Alerts, Microsoft, Technology, Uncategorized
This article is contributed. See the original author and article here.
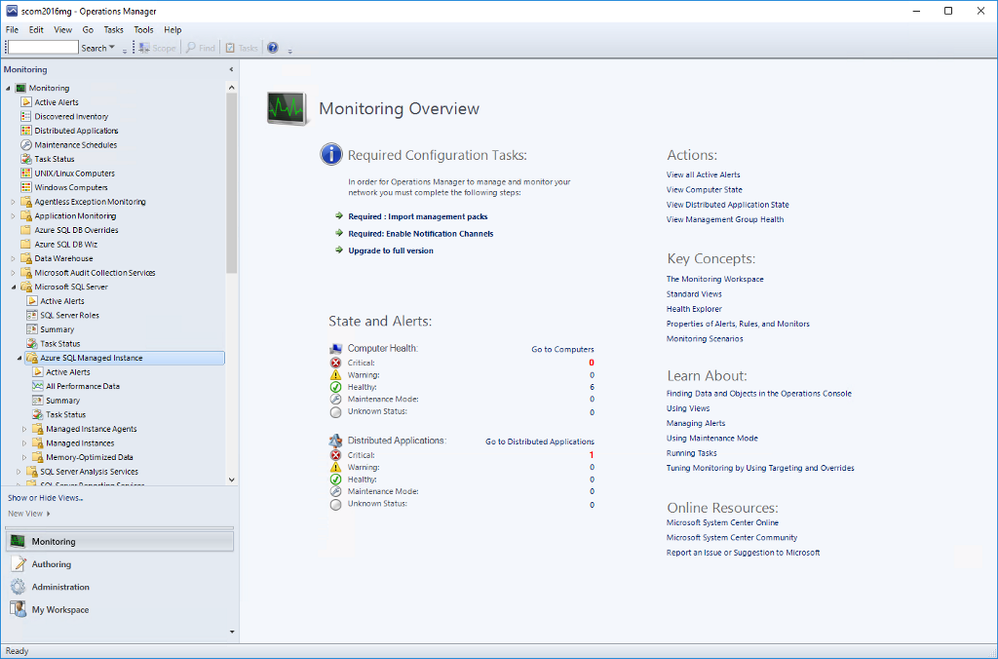
We released System Center Operations Manager Management Pack for Azure SQL Managed Instance recently. It provides comprehensive monitoring capabilities for SQL Managed Instance. If you have a hybrid data environment, you can use a single monitoring solution, SCOM, to monitor all your data assets as we already have management packs for SQL Server and Azure SQL DB.
Discovery
After you install the management pack (MP), there are two templates to get you started: Manual and Automatic Discovery. As the names suggest, you can either discover your instances by adding them manually or automatically discover instances in a given subscription. Both options have wizards that walk you through this setup. We will not explore them in this post as the instructions in the MP guide are very detailed. I just want to point out that you can use either Azure Active Directory (AAD) or SQL Authentication to connect to the instances. You can use a connection with sysadmin rights or there is an option to use the least amount of privileges to monitor the product just like SQL Server MP. This is also explained in detail in the MP guide.
Monitoring
Once you complete all the steps in the wizard, you will be able to see the instances in the SCOM dashboard under Monitoring. Under Microsoft SQL Server folder, you’ll see a subfolder for Microsoft Azure SQL Managed Instance.

Navigate to Microsoft Azure SQL Managed Instance -> Managed Instances -> Database Engines
You can see the instances listed with some details. You can select which columns to display here by right-clicking and selecting Personalize View from the list. If you are using geo-replication, you will see that Geo-Replication Replica Role is listed in Detailed View. It can be Primary or Secondary (or blank if this instance is not participating in geo-replication).

As usual, you can drill down by double-clicking on the instance rows. This will take you to the list of individual monitors and their status. Most of these are the monitors you are familiar with from SQL Server MP.
There is a brand new monitor called Instance Free Storage Space Left. It uses percentages and is set to warn if it goes below 20% but, of course, it is customizable just like all the other monitors. It also shows the actual data in MB.

Navigate to Microsoft Azure SQL Managed Instance -> Managed Instances -> Databases
If you double-click on a geo-replicated database, you will see the new monitor, Geo-Replication Status, under Availability. All the information is on the right hand side. As you can see it can be in one of three states:
- CATCH_UP: This is the healthy state.
- SEEDING: Seeding is happening but until it competes, you can’t connect to the secondary database.
- PENDING: Not in an active continuous-copy relationship. Usually indicates bandwidth related issues.

Also on the Databases view, right-click on a geo-replicated database and select Open->Performance View. You will find the new counter Geo-Replication Lag (sec) along with other counters. This rule collects performance metric for the primary database only and shows the time difference between transactions committed on primary database and persisted on secondary database.
Other Views
You can also explore Managed Instance Agents and Memory-Optimized Data folders for monitors specific to those areas. We will not explore those in this post.
Summary Dashboard under Microsoft Azure SQL Managed Instance provides the usual status-at-a-glance view of everything. Just like other SQL MPs, you can drill down to get to specific monitors/rules and customize it by adding or removing tiles to fit your needs.

Active Alerts view under Microsoft Azure SQL Managed Instance lets you view all your active alerts in a single place just like other SQL MPs.

Summary
Azure SQL Managed Instance Management Pack is very similar to other SQL MPs but also introduces product specific monitors and rules.
by Scott Muniz | Jul 21, 2020 | Alerts, Microsoft, Technology, Uncategorized
This article is contributed. See the original author and article here.
Azure Activity logs provides insight into any subscription-level or management group level events that have occurred in Azure, there are three main categories covered under Azure Activity and a bunch of resource types, for more details click here:
- Azure Resources
- Audit
- Security
Each event in the Activity Log has a particular category . See the sections below for more detail on each category and its schema when you access the Activity log from the portal, PowerShell, CLI, and REST API. The schema is different when you stream the Activity log to storage or Event Hubs:
| Category |
Description |
| Administrative |
Contains the record of all create, update, delete, and action operations performed through Resource Manager. Examples of Administrative events include create virtual machine and delete network security group.
Every action taken by a user or application using Resource Manager is modeled as an operation on a particular resource type. If the operation type is Write, Delete, or Action, the records of both the start and success or fail of that operation are recorded in the Administrative category. Administrative events also include any changes to role-based access control in a subscription. |
| Service Health |
Contains the record of any service health incidents that have occurred in Azure. An example of a Service Health event SQL Azure in East US is experiencing downtime.
Service Health events come in Six varieties: Action Required, Assisted Recovery, Incident, Maintenance, Information, or Security. These events are only created if you have a resource in the subscription that would be impacted by the event. |
| Resource Health |
Contains the record of any resource health events that have occurred to your Azure resources. An example of a Resource Health event is Virtual Machine health status changed to unavailable.
Resource Health events can represent one of four health statuses: Available, Unavailable, Degraded, and Unknown. Additionally, Resource Health events can be categorized as being Platform Initiated or User Initiated. |
| Alert |
Contains the record of activations for Azure alerts. An example of an Alert event is CPU % on myVM has been over 80 for the past 5 minutes. |
| Autoscale |
Contains the record of any events related to the operation of the autoscale engine based on any autoscale settings you have defined in your subscription. An example of an Autoscale event is Autoscale scale up action failed. |
| Recommendation |
Contains recommendation events from Azure Advisor. |
| Security |
Contains the record of any alerts generated by Azure Security Center. An example of a Security event is Suspicious double extension file executed. |
| Policy |
Contains records of all effect action operations performed by Azure Policy. Examples of Policy events include Audit and Deny. Every action taken by Policy is modeled as an operation on a resource. |
Our hunting library for today will shed more lights on “Administrative” category which contains the record of all create, update, delete, and action operations performed through Resource Manager, this means an auditing & reporting activities have to be in place and hence there are a set of operations (Operation Name) which defines a resource types.
Hunting such kind of activities (aka: Demons) require defining the category, operation name “value” & activity value. Before sharing couple of hunting use-cases let’s have a look at a set of administrative operations as a sample:
| Operation name |
Resource type |
| Create or update workbook |
Microsoft.Insights/workbooks |
| Delete Workbook |
Microsoft.Insights/workbooks |
| Set Workflow – Playbook |
Microsoft.Logic/workflows |
| Delete Workflow – Playbook |
Microsoft.Logic/workflows |
| Create Saved Search |
Microsoft.OperationalInsights/workspaces/savedSearches |
| Delete Saved Search |
Microsoft.OperationalInsights/workspaces/savedSearches |
| Update Alert – Analytics Rules |
Microsoft.SecurityInsights/alertRules |
| Delete Alert – Analytics Rules |
Microsoft.SecurityInsights/alertRules |
| Update Alert Rule Response Actions |
Microsoft.SecurityInsights/alertRules/actions |
| Delete Alert Rule Response Actions |
Microsoft.SecurityInsights/alertRules/actions |
| Update Bookmarks |
Microsoft.SecurityInsights/bookmarks |
| Delete Bookmarks |
Microsoft.SecurityInsights/bookmarks |
| Update Cases |
Microsoft.SecurityInsights/Cases |
| Update Case Investigation |
Microsoft.SecurityInsights/Cases/investigations |
| Create Case Comments |
Microsoft.SecurityInsights/Cases/comments |
| Update Data Connectors |
Microsoft.SecurityInsights/dataConnectors |
| Delete Data Connectors |
Microsoft.SecurityInsights/dataConnectors |
| Update Settings |
Microsoft.SecurityInsights/settings |
| Update / Delete NSG |
Microsoft.Network/networkSecurityGroups |
| Create / Update / Delete Pubic IP Addresses |
Microsoft.Network/publicIPAddresses |
| Create / Update / Delete Network Interfaces |
Microsoft.Network/networkInterfaces |
| Route tables actions |
Microsoft.Network/routeTables |
| Create / Update / Delete Front door web app firewall policies |
Microsoft.Network/frontdoorwebapplicationfirewallpolicies |
| DDOS Protection Plans Actions |
Microsoft.Network/ddosProtectionPlans |
| Create / Update / Delete Virtual Networks |
Microsoft.Network/virtualNetworks |
| Create / Update / Delete Front doors |
Microsoft.Network/frontdoors |
| Create / Update / Delete Subnets |
Microsoft.Network/virtualNetworks/subnets |
| Create / Update / Delete Application Gateways |
Microsoft.Network/applicationGateways |
| Create / Update / Delete Update Virtual Network Peerings |
Microsoft.Network/virtualNetworks/virtualNetworkPeerings |
| Firewall Policies Rule Groups Actions |
Microsoft.Network/firewallPolicies/ruleGroups |
| Create / Update / Delete Azure Firewalls |
Microsoft.Network/azureFirewalls |
| Create / Update / Delete Firewall Policies |
Microsoft.Network/firewallPolicies |
| DNS Resources Actions |
Microsoft.Network/getDnsResourceReference |
Use- Cases:
#1 Creating a new Azure Sentinel Analytics – Rule:
AzureActivity
| where Category == "Administrative"
| where OperationNameValue == "Microsoft.SecurityInsights/alertRules/write"
| where ActivitySubstatusValue == "Created"
#2 Deleting an existing Azure Sentinel Analytics – Rule:
AzureActivity
| where Category == "Administrative"
| where OperationNameValue == "Microsoft.SecurityInsights/alertRules/delete"
| where ActivitySubstatusValue == "OK"
#3 Creating a new NSG:
// NSG : 201 Created status means "Created"
AzureActivity
| where Category == "Administrative"
| where OperationNameValue == "Microsoft.Network/networkSecurityGroups/write"
| where ActivitySubstatusValue == "Created"
#4 Updating an Existing NSG:
// NSG : 200 Ok status means "Updated"
AzureActivity
| where Category == "Administrative"
| where OperationNameValue == "Microsoft.Network/networkSecurityGroups/write"
| where ActivitySubstatusValue == "OK"
#5 Creating Virtual Network Subnets:
// Virtual Networks Subnets Creation
AzureActivity
| where Category == "Administrative"
| where OperationNameValue == "Microsoft.Network/virtualNetworks/subnets/write"
| where ActivitySubstatusValue == "Created"
And much more use-cases and hunting queries can be configured, we make it easy so check out the Azure Sentinel Administrative Suspicious Activities Library uploaded to gihub :
AnalyticsRulesAdministrativeOperations
AzureNSG_AdministrativeOperations
AzureSentinelWorkbooks_AdministrativeOperation
AzureVirtualNetworkSubnets_AdministrativeOperationset
Enjoy hunting the demons! and please share your feedback.
by Scott Muniz | Jul 21, 2020 | Uncategorized
This article is contributed. See the original author and article here.
Follow me on Twitter, happy to take your suggestions on topics or improvements /Chris
Durable Functions are an extension of Azure Functions that lets you write stateful functions in a serverless environment. Durable functions manages state, checkpoints, and restarts for you.
What does that even mean you ask?
It means you can have long-running functions like really long-running functions. It also has a state which means it remembers where it is, like a workflow.
How about this. Imagine you have a situation where :
> you need to manage something by dividing it up in different checkpoints. Each checkpoint is one step closer for it to be considered handled. More concretely imagine a game for example where you need to load a bunch of different resources and only when everything is loaded and ready are you able to play the game.
Oh, ok, so it’s like a workflow framework
Yea exactly, it enables you to specify how something should be executed through a flow. There are even different architectural patterns that is recommended for different flows.
Sounds like that could be expensive, is it?
No not really, the payment model is very close to the one Azure Functions use, only pay for when the functions/ workflow is actually executing.
Sounds great, tell me more
In this article we will cover:
- What are Durable functions, let’s talk through what it is and what the central concepts are
- How it works, we will explain a little bit of how it works
- Resources, we will give out some resources so you can delve further in
- Lab, we will code through an example so you see the major concepts in use and what happens when
Concepts and high-level explanation
There are some concepts we need to know about when dealing with durable functions. All concepts play a role that together enables us to run our durable function.
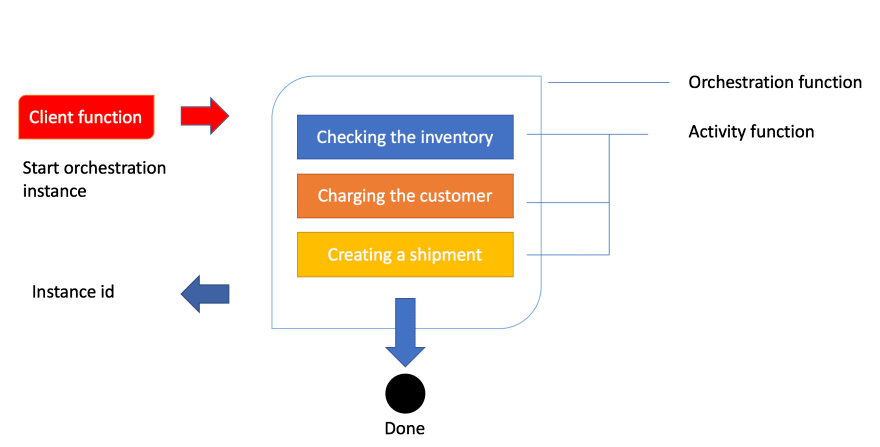
- Orchestrator function, this is a function where we define the workflow, we set up what should happen in the workflow, what activities to carry out and what happens when it’s done
- Activity function, Activity functions are the basic unit of work in a durable function orchestration. Activity functions are the functions and tasks that are orchestrated in the process. You can have as many activity functions as you want. Make sure to give them descriptive names that represent steps in your flow
- Client functions, Client functions are the triggered functions that create new instances of an orchestration. Client functions are the entry point for creating an instance of a Durable Functions orchestration
Ok, I think I got but can you maybe explain it a bit more?
Sure, the best way to explain it is through a realistic example and an image. So let’s talk about order processing. In order processing we imagine we have the following tasks to carry out:
- Checking the inventory,
- Charging the customer,
- Creating a shipment
Given that we know how an order is processed let’s show you that image so you get a feeling for the workflow:

Ok, above we see how a client function is being invoked. In the case of an order being created, this typically is an HTTP endpoint we hit from an application. The next thing to happen is that the client’s function starts an instance of an orchestration. This means we will get an instance id, our unique reference to that specific flow. Next thing to happen is that we try to carry out everything inside of the orchestration like checking the inventory, charging the customer and creating a shipment.
How it works
Let’s talk a bit more about how this technically works. The thing with the orchestration is that what it orchestrates usually is asynchronous which means we don’t know exactly when something finishes. To avoid that you pay running costs for it durable functions powers down and saves the state.
When an orchestration function is given more work to do (for example, a response message is received or a durable timer expires), the orchestrator wakes up and re-executes the entire function from the start to rebuild the local state.
wait, re-running everything?
No worries, during the replay, if the code tries to call a function (or do any other async work), the Durable Task Framework consults the execution history of the current orchestration. If it finds that the activity function has already executed and yielded a result, it replays that function’s result and the orchestrator code continues to run.
Oh ok, that sounds better
Replay continues until the function code is finished or until it has scheduled new async work
Resources
Lab – simple activity flow
We believe the best way to learn is to build something with it. So how do we do it? Well, it’s quite simple. Using VS Code we can install a plugin making this process really easy.

Creating our project
Open up the command palette or type COMMAND + SHIFT + P.
Then we select the following, to create a new project

This is followed by us selecting a language, let’s take C#. Then we are faced with this list of choices
Select Durable Functions Orchestration , next name your function:

You will be asked to select a storage account, you will need to select Subscription, Storage account and Resource group. The reason for this is that when you save the state of your function it needs to be saved somewhere for later recovery.
Your project should now look like this:
-| obj/
-| bin/
-| .gitignore
-| <name of directory>.csproj
-| local.settings.json
-| Orchestration.cs
Let’s take a closer look at Orchestration.cs:
using System.Collections.Generic;
using System.Net.Http;
using System.Threading.Tasks;
using Microsoft.Azure.WebJobs;
using Microsoft.Azure.WebJobs.Extensions.DurableTask;
using Microsoft.Azure.WebJobs.Extensions.Http;
using Microsoft.Extensions.Logging;

namespace Company.Function
{
    public static class Orchestration
    {
        [FunctionName("Orchestration")]
        public static async Task<List<string>> RunOrchestrator(
            [OrchestrationTrigger] IDurableOrchestrationContext context)
        {
            var outputs = new List<string>();

            // Replace "hello" with the name of your Durable Activity Function.
            outputs.Add(await context.CallActivityAsync<string>("Orchestration_Hello", "Tokyo"));
            outputs.Add(await context.CallActivityAsync<string>("Orchestration_Hello", "Seattle"));
            outputs.Add(await context.CallActivityAsync<string>("Orchestration_Hello", "London"));

            // returns ["Hello Tokyo!", "Hello Seattle!", "Hello London!"]
            return outputs;
        }

        [FunctionName("Orchestration_Hello")]
        public static string SayHello([ActivityTrigger] string name, ILogger log)
        {
            log.LogInformation($"Saying hello to {name}.");
            return $"Hello {name}!";
        }

        [FunctionName("Orchestration_HttpStart")]
        public static async Task<HttpResponseMessage> HttpStart(
            [HttpTrigger(AuthorizationLevel.Anonymous, "get", "post")] HttpRequestMessage req,
            [DurableClient] IDurableOrchestrationClient starter,
            ILogger log)
        {
            // Function input comes from the request content.
            string instanceId = await starter.StartNewAsync("Orchestration", null);

            log.LogInformation($"Started orchestration with ID = '{instanceId}'.");

            return starter.CreateCheckStatusResponse(req, instanceId);
        }
    }
}
Above you can see how three functions have been generated for you when you created the project. Every function has been decorated with FunctionName decorator. This is how the runtime knows what these functions are and can generate endpoints from it, among other things.
Explaining the artifacts
Ok, so we created three different functions or artifacts, an orchestrator function, an HTTP start/client function, and an activity function. How does this all work?
Well, it all starts with a HttpStart function that kicks everything off. Then said function kicks off the Orchestrator that in turn starts the Activity functions specified in the orchestrator. Sounds a bit theoretical but let’s dive into each of these artifacts and see what happens in the code.
HttpStart
As mentioned above, this is the function that starts it all. Let’s have a look at its source code and discuss what’s happening:
[FunctionName("Orchestration_HttpStart")]
public static async Task<HttpResponseMessage> HttpStart(
  [HttpTrigger(AuthorizationLevel.Anonymous, "get", "post")] HttpRequestMessage req,
  [DurableClient] IDurableOrchestrationClient starter,
   ILogger log)
{
  // Function input comes from the request content.
  string instanceId = await starter.StartNewAsync("Orchestration", null);

  log.LogInformation($"Started orchestration with ID = '{instanceId}'.");
  return starter.CreateCheckStatusResponse(req, instanceId);
}
We can see above that we have three input parameters:
- req, of type IHttpRequestMessage, this is the incoming web request. Note how this parameter has the
HttpTrigger decorator with two input params, AuthorizationLevel, and the strings “get” and “post”. This instructs this method to listen to WebRequests using the HTTP verbs GET and POST.
- starter, of type IIDurableOrchestrationClient, this is the client that allows us to control the general flow.
- log, of type ILogger, this instance lets us log different messages that can be subscribed to by Azure and will also be visible in the terminal while developing our project.
Next up our starter instance calls StartNewAsync() which produce an instanceId. The instanceId is a reference or handler to this specific function invocation. It doesn’t matter so much for this demo but the for the second one we will use that information.
The last thing to happen is that we create an HTTP response by calling CreateCheckStatusResponse() .
Orchestrator
Let’s look at the Orchestrator next. This is where all the interesting things are happening, this is where we set up our flow, what function to be called when and why. Let’s look at the code:
[FunctionName("Orchestration")]
public static async Task<List<string>> RunOrchestrator(
  [OrchestrationTrigger] IDurableOrchestrationContext context)
{
  var outputs = new List<string>();

  // Replace "hello" with the name of your Durable Activity Function.
  outputs.Add(await context.CallActivityAsync<string>("Orchestration_Hello", "Tokyo"));
  outputs.Add(await context.CallActivityAsync<string>("Orchestration_Hello", "Seattle"));
  outputs.Add(await context.CallActivityAsync<string>("Orchestration_Hello", "London"));

  // returns ["Hello Tokyo!", "Hello Seattle!", "Hello London!"]
  return outputs;
}
The first thing we see that we have a method FunctionName("Orchestration") . We have an input parameter context of type IDurableOrchestrationContext. This parameter has the capability of controlling the flow but also call helpers but also activity functions, that does the heavy lifting. When contextcalls CallActivitySync()it does just that, it calls an activity function with the name Orchestration_Helloand pass it a string.
Orchestration_Hello
Next up we have an activity function. This is where we carry out all the heavy lifting.
[FunctionName("Orchestration_Hello")]
public static string SayHello([ActivityTrigger] string name, ILogger log)
{
  log.LogInformation($"Saying hello to {name}.");
  return $"Hello {name}!";
}
We see that it returns straight away but it could definitely be a long-running activity. The point is whether it runs in a millisecond or takes some time, it doesn’t matter, the orchestration function still has to wait for it to conclude. Imagine this function can do a lot more, like talking to a database or do an HTTP request.
Debugging
You may think you understand everything up to this point but it really clicks when you see a debugging flow happening. So that’s what we are going to be doing next, we are going to start up our durable function from VS Code and you will be able to see how the breakpoints hit and when.
Now we are ready to debug so let’s hit debug by going to Run/ Start Debugging in the VS Code menu.
We should be getting something like this printed in the terminal
Http Functions:
  Orchestration_HttpStart: [GET,POST] http://localhost:7071/api/Orchestration_HttpStart
Next thing we need to do is to kick everything off by hitting our client function route as indicated above http://localhost:7071/api/Orchestration_HttpStart. We need to start the whole thing by calling the mentioned URL
1) The first thing to happen is our HttpStart function being hit:
We let the debugger advance:
2) Next, the Orchestration is being hit.
Next up we advance to the next breakpoint and we see that our activity
3) Next, the function Orchestration_Hello is being hit next.
We advanced the breakpoint and we find ourselves being back in the orchestration function:
This will lead to the activity function being hit again, this time with the argument Seattleand so on.
As you can see it will keep going like this between activity function and orchestrator until orchestrator is done.
We end up coming to a page like this which is the HTTP response from the method called HttpStart
// 20200721125052
// http://localhost:7071/api/Orchestration_HttpStart

{
  "id": "151c37c2bbc14f659ffb0a4d3ed9e54e",
  "statusQueryGetUri": "http://localhost:7071/runtime/webhooks/durabletask/instances/151c37c2bbc14f659ffb0a4d3ed9e54e?taskHub=TestHubName&connection=Storage&code=/XsKEv/uaBc41kmo1ayzMMhI7mh5fNazn4azktrpMbJtuEnSnpm1lA==",
  "sendEventPostUri": "http://localhost:7071/runtime/webhooks/durabletask/instances/151c37c2bbc14f659ffb0a4d3ed9e54e/raiseEvent/{eventName}?taskHub=TestHubName&connection=Storage&code=/XsKEv/uaBc41kmo1ayzMMhI7mh5fNazn4azktrpMbJtuEnSnpm1lA==",
  "terminatePostUri": "http://localhost:7071/runtime/webhooks/durabletask/instances/151c37c2bbc14f659ffb0a4d3ed9e54e/terminate?reason={text}&taskHub=TestHubName&connection=Storage&code=/XsKEv/uaBc41kmo1ayzMMhI7mh5fNazn4azktrpMbJtuEnSnpm1lA==",
  "purgeHistoryDeleteUri": "http://localhost:7071/runtime/webhooks/durabletask/instances/151c37c2bbc14f659ffb0a4d3ed9e54e?taskHub=TestHubName&connection=Storage&code=/XsKEv/uaBc41kmo1ayzMMhI7mh5fNazn4azktrpMbJtuEnSnpm1lA=="
}
What’s interesting for us to know at this point is what did we end up producing? The answer lies in the URL called statusQueryGetUri. Let’s follow that link:
// 20200721122529
// http://localhost:7071/runtime/webhooks/durabletask/instances/e1d7e237acb74834a02854050805712e?taskHub=TestHubName&connection=Storage&code=/XsKEv/uaBc41kmo1ayzMMhI7mh5fNazn4azktrpMbJtuEnSnpm1lA==

{
  "name": "Orchestration",
  "instanceId": "e1d7e237acb74834a02854050805712e",
  "runtimeStatus": "Completed",
  "input": null,
  "customStatus": null,
  "output": [
    "Hello Tokyo!",
    "Hello Seattle!",
    "Hello London!"
  ],
  "createdTime": "2020-07-21T11:18:28Z",
  "lastUpdatedTime": "2020-07-21T11:24:25Z"
}
As you can see above the response from our Orchestration function is an array consisting of the responses from all activity functions, like so:
"output": [
  "Hello Tokyo!",
  "Hello Seattle!",
  "Hello London"
]
It ended up that way because of the way we constructed the code, we wrote this:
outputs.Add(await context.CallActivityAsync<string>("Orchestration_Hello", "Tokyo"));
outputs.Add(await context.CallActivityAsync<string>("Orchestration_Hello", "Seattle"));
outputs.Add(await context.CallActivityAsync<string>("Orchestration_Hello", "London"));
Summary
There is so much more to learn about Durable Functions but I can already hear some of you snore at this point which is why we will save topics such as Application Patterns and implementation of a pattern Fan-out/fan-in for the next part.
So I hope you are excited about that one.
Acknowledgements
I wouldn’t be writing this if it wasn’t for your guidance in how Durable Functions work. You both are amazing human beings.
So go give them a follow, they really know their stuff on Serverless

Recent Comments