This article is contributed. See the original author and article here.
Bucketing data by dynamic bucket size
When we create chart in Power BI or any other visualization, we have a limited number of datapoints we can plot.
Power BI samples the data according to the resolution and the size of the chart vs. the number of points.
This means that we may bring from ADX hundreds of thousands of points and Power BI will sample the data we bring and plot the sampled data.
What if we want to limit the number of points ourselves using a different method?
Power BI imposes a limit of 1 million rows returned by a single query so if you have more than a million values returned, you’ll have to reduce this number.
Even if the number of results is not over the limit, it will be more efficient to return a small number of rows instead of bringing a very high number of points and letting Power BI do the sampling.
Function that aggregates the data in a dynamic way
The scenario is a line chart using a date time column on the X axis and some value on the Y that we can average.
I created a KQL function that summarizes the data to limit the number of points using a dynamic bin size.
The function averages the values in each group of points.
Other ways of representing the values can use other aggregations like count, sum or more sophisticated methods
The function uses data from the help cluster.
You can create the function in any database you have access to.
.create-or-alter function conditional_Sampling(From:datetime,To:datetime,GranularityS:string=”5s”,MaxPoints:long=1000)
{
// Easier to use strings in Power BI and convert here
let Granularity=totimespan(GranularityS) ;
// Number of points is calculated based on the timespan and the known granularity in the specific table
let Points=tolong((To-From)/Granularity) ;
// The factor is the number of points represented as one point in the chart
let Factor=iff(Points <=MaxPoints,1,tolong(Points/MaxPoints)) ;
This article is contributed. See the original author and article here.
Staying organized is one important factor in delivering projects on time and within budget. Two features released earlier in March are aimed at helping you in this regard. Read on to see what these features can do for you and your team.
New Features:
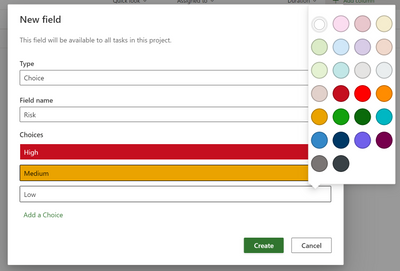
Colors in custom field drop down~ Add colors to your custom fields for better visual organization of your project plans.
Priority Field ~ Almost finished rolling out, set the priority of your tasks in Project for the web, to better help sort and prioritize your work.
Labels ~ Almost finished rolling out, add up to 25 different colored labels to your tasks in Project for the web for better visual organization.
Upcoming Features:
Guest Users ~ Add people who are not part of your Microsoft 365 Group to your projects & assign tasks to them. This can include external stakeholders such as vendors or partners.
Templates ~ Get a jump start on your projects with a set of built-in templates.
Task edit for Microsoft 365 users ~ Enable your users with Microsoft 365 licenses to edit tasks assigned to them from a project plan built in Project for the web.
Charts View ~ Visually assess the progress of your work through charts.
This article is contributed. See the original author and article here.
This is the next segment of our blog series highlighting Microsoft Learn Student Ambassadors who achieved the Gold milestone and have recently graduated from university. Each blog in the series features a different student and highlights their accomplishments, their experience with the Student Ambassadors community, and what they’re up to now.
Today we meet Japhlet Nwamu who is from Nigeria and recently graduated from the University of Benin with a degree in Computer Science.
Responses have been edited for clarity and length.
When you joined the Student Ambassador community in September of 2019, did you have specific goals you wanted to reach, such as a particular skill or quality?
I’ve always loved being unique and making a difference. My goal when I joined the community was to do just that–empower thousands in unique ways and make a difference. Have I accomplished this? I can proudly say “yes”. With the support of this global community, I have empowered thousands and counting. The community has given me access to the right opportunities, the right people, and the right platform to accomplish this goal.
What were the accomplishments that you’re the proudest of and why?
They are so many of them I am grateful for, but here are just a few:
A personal project I built with Microsoft 365 and Power Platform was featured on the Microsoft 365 Developer YouTube channel
I wrote 4 articles featured on Microsoft’s Developer Blog which has had over 8,000+ views. Writing these articles helped me harness and improve my critical thinking and problem solving skills.
Why do these accomplishments matter to me? Before I joined the community, I was an introvert and never thought I would attain such milestones, that I would be able to empower people so much, but the community has allowed me to empower thousands of lives and inspire others in ways I never thought possible.
What are you doing now that you’ve graduated?
I am currently working towards securing a job that would give me the opportunity to empower the lives of people around the world.
My goal for 2022 is to “democratize technology and make a difference”. I hope to do as much as I can. I’ve already started it and hope to continue with it.
If you could redo your time as a Student Ambassador, is there anything you would have done differently?
I would have started empowering people earlier. As an introvert, especially in global spaces like the Student Ambassador program, I spent 5 months trying to find my feet, connect, and make friends before I hosted my first event, and I wish it didn’t take so long.
If you were to describe the community to a student who is interested in joining, what would you say about it to convince him or her to join?
“Love to empower lives and make a difference? Then join the Microsoft Learn Student Ambassadors community.”
What advice would you give to new Student Ambassadors?
You have an amazing and solid support system in the community. People are ready to help you. They want to see you grow, they love to see you succeed, so harness this opportunity. Connect with them, collaborate, make lasting friendships, and empower others.
What is your motto in life, your guiding principle?
Set goals, commit to them, be consistent, and attain them. That’s all you need to succeed.
What is one random fact about you that few people are aware of?
I love playing football, travelling, meeting and interacting with new people.
This article is contributed. See the original author and article here.
At last year’s Ignite 2021 Microsoft announced the Preview of a new Teams SDK that enables developers to create Microsoft Teams apps that, with minor adjustments to the app’s manifest, can also extend Teams personal apps and message extensions to other parts of Microsoft 365, like Office and Outlook. Today, we are making the first group of these Teams apps available in Preview for Outlook and Office.com for users enrolled in the Targeted Release program. We’ve also worked on enhancing some of our own apps, like Power BI, partnered very closely with ISVs like Mural and Zoho to build apps using this SDK and will be adding more. Read on to learn how you, an admin, can get your users ready, and what admin controls are already available.
With this enhancement, apps built for Teams not only run everywhere Teams runs, but also in more of the places that users spend their time in Microsoft 365, like Outlook and Office.com. You should note that once your users in Targeted Release start seeing these apps, you will need to know how to manage this experience. Click here to learn more.
What does this mean for your organization?
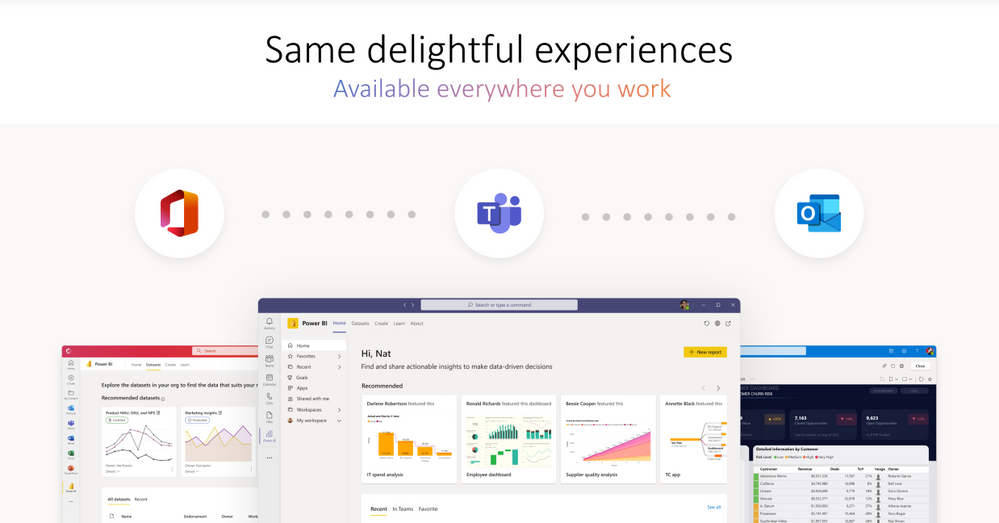
With the enhanced Teams apps, your users in Targeted Release that use the apps in Teams will start seeing those apps in Outlook and Office.com.
Illustration labeled, “Same delightful experience available everywhere you work.” Displays the Microsoft Office, Microsoft Teams, and Microsoft Outlook icons, and beneath them are screenshots of Power BI in Office, Microsoft Teams, and Outlook.
App Management Tools
With the enhanced Teams apps, as an admin, you can now manage the app and user access to the app in a unified manner. Previously, for an app to work in Teams, Outlook, and Office, you needed to manage each app independently. With the enhanced Teams apps, you now need to manage it only once, and enable a single, connected experience for end-users across Teams, Outlook, and Office.com.
With the enhanced Teams app, for its use in Outlook and Office.com, there is no change in existing permissions, or the app data access. The enhanced app continues to use the existing permissions granted in Teams.
Displays the Teams admin center with the permissions pop-up for Zoho projects app.
As an admin, you can manage the enhanced Teams apps, in the Teams admin center, using the same admin controls that you use for your Teams apps. As a Teams administrator, you can manage your end-users’ access to the enhanced Teams apps. If you are already using the Teams app that is enhanced to work across Microsoft 365, you can see the experience in Preview for Outlook and in Office.com.
Displays the Mural app in the Microsoft Office.com experience.
After you install, your end-users can start using the Teams app in Office.com and can see the app conveniently available in the app bar in Office.com.
Displays the Zoho projects app in the Microsoft Office experience, with a highlight on the Zoho projects app in the left ribbon.
Like in Office.com, your end users will have a similar experience in Outlook, plus message extensions within email and calendar composite experience. The app is conveniently available on the left app bar in Outlook.
Displays the Zoho projects app Message Extension in the Microsoft Outlook experience.
In the future, we will bring more admin controls to the Microsoft 365 admin center to manage these experiences across all Microsoft 365 apps.
Note: The Preview roll-out of these new capabilities has started for users enrolled in the Microsoft 365 Targeted Release program or who are members of the Office Insiders program and have Outlook for Windows installed from the Beta Channel.
Continue the conversation by joining us in the Microsoft 365 Tech Community! Whether you have product questions or just want to stay informed with the latest updates on new releases, tools, and blogs, Microsoft 365 Tech Community is your go-to resource to stay connected!
This article is contributed. See the original author and article here.
Every year, millions of basketball fans fill out brackets for the Division I Men’s College Basketball Tournament hoping to predict the team that will win it all. The Microsoft Business Applications Applied AI group has joined in on the fun, leveraging AI to help guide our bracket picks.
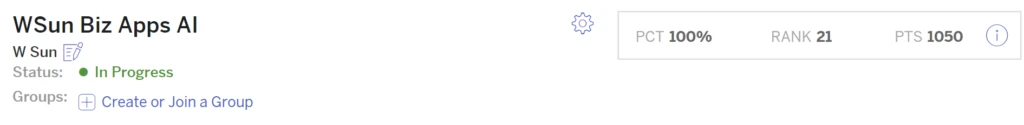
So far, we’ve had a pretty good run. Out of the 17 million brackets submitted for the 2022 ESPN Men’s Tournament Challenge, the Microsoft Business Applications Applied AI group’s bracket is ranked 21st on the leaderboard, which after four rounds (semifinal stage) is more accurate than 99.9997 percent of all brackets submitted at the beginning of the competition.
In this post, I’ll discuss how we built this bracket and explain how we use similar techniques to power AI capabilities in Microsoft Dynamics 365 applications. Why does this matter? Because businesses want to make better decisions and achieve better outcomes, andas the accuracy of our tournament predictions help showturning to AI to provide those insights can deliver impressive outcomes.
How we build our tournament AI model
Since readers are probably more interested in the construction of our bracket, let’s start with that (for business-minded readers, you can skip to the next section). We’ve previously explained how to build better brackets, and we had deeper dives providing details of our models. To summarize, we take over 10 years of historical data for teams and analyze many factors, including:
Regular season and tournament outcomes.
Current player composition, excluding injured team members unavailable for the tournament.
Historical competitive success of the head coaches coaching this year’s teams.
Success away from home and in neutral sites, which is where all tournament games happen for the men.
Historical analyses of seeds and conference successes.
With these factors, we created a model which determined that 5th seeded Houston was dramatically underrated at that position and we were thus able to correctly predict their upset wins over 4-seed Illinois and 1-seed Arizona and that 8th seeded North Carolina would upset 1-seed Baylor and 4-seed UCLA. The model understood team strengths well enough that by the quarterfinals, each of the four teams we predicted to make the semifinals was the stronger remaining seeded team in the four contests. And fortunately for us, all four teams delivered to ensure we’d have a perfect semifinal bracket going into this weekend.
Solving business problems with AI
Businesses have many questions they need answers to today. For example, what’s the likelihood that a customer will churn? What’s the predicted lifetime value of a customer? What products should be recommended to a customer? Will I have enough supply of a given product on the shelf? Accurately answering these questions leads to better outcomes, as customers are retained, loyalty programs are designed to reward your best customers, and customers see the products that are most relevant to them available on the shelf. We have built easy-to-use, out-of-box AI models that are trained on your data so you can get the predictions optimized for your business to answer these questions.
These models use the same concepts that we used to create our bracket, as the propensity of a business outcome can be modeled similarly to that of a sports outcome. Take, for instance, the classical Recency, Frequency, and Monetary (RFM) model for predicting churn.
For recency, in the basketball model we look at streaks and “last 10” performance, while in business churn, we look at the recent purchase history of a customer.
For frequency, we might analyze the number of wins a team has for basketball, while analogously we look at the quantity of purchases from a customer for our business applications models.
Finally, for monetary, this would be the point differential in basketball and quantity of spend in our churn model.
This is only a subset of all features we analyzed to give you an idea of our approach.
Beside the questions above, there are a lot of other questions that businesses are asking in every domain. For example, what are customers saying about our product? How do we identify business entities in text? How do we find the most relevant news articles about suppliers? How do we analyze your processes and automatically label the activities that are being done to identify bottlenecks and suggest improvements? We have AI capabilities to help answer these questions available in our Dynamics 365 product family today.
Of course, AI models need not be fully self-service as human intuition and guidance can be included when desired. This is why we have spent time discussing the importance of explain-ability of models in a recent post. People can take AI and use it as a guide to improve decision-making both in creating a bracket as well as solving your business problems. Namely, our AI models explain the insights so that you can add in your own intuition when planning your next marketing campaign or building your next material requirements plan.
Keeping pace on and off the court
The dynamic nature of our models can be seen with the tournament, too, where we incorporated the early results from additional post-season college tournaments to adjust the modeled strengths of conferences before main bracket play beganin 2022, this meant observing a stronger Atlantic Coast Conference based on Virginia upsetting Mississippi State and Wake Forest winning in outcomes from another tournament’s first round. Such a signal increased the model’s confidence in this conference, leading it to correctly pick a Duke versus North Carolina semifinal and a quarterfinal run for Miami.
In business, the only constant is change. How do you pivot and adjust to the latest disruptions in your supply chain? How would you route customer support calls to the best agents based on real-time staffing changes and that day’s routing behavior? We’re running a full court press in solving these types of problems, so if you want to learn more about how AI can help your business, try our line of business applications, visit our Insights blog, and come apply to the many AI-powered jobs we have for Dynamics 365.


Recent Comments