This article is contributed. See the original author and article here.
We’re glad to announce the release of Log Analytics Workspace Insights (preview) – a new experience providing comprehensive monitoring of your Log Analytics Workspace, through a central view of the workspace usage, performance, health, agents, run queries, and change log.
Accessing Log Analytics Workspace Insights
- Overview at scale – You can launch Log Analytics Workspace Insights through Azure Monitor’s list of insights, which shows an overview of your workspace across the globe: or from the Workspace itself. Opening LA Workspace Insights through Azure Monitor, first shows an overview of all your workspaces, across the globe:
 Overview at scale
Select a workspace from the list to reach the more detailed workspace-specific view.
- Workspace-specific insights – open a Log Analytics Workspace and select Insights from its menu. This opens a multi-tabbed view, where you can deep dive into different aspects of your workspace. Below, we review in detail what insights this view provides.
Workspace Overview
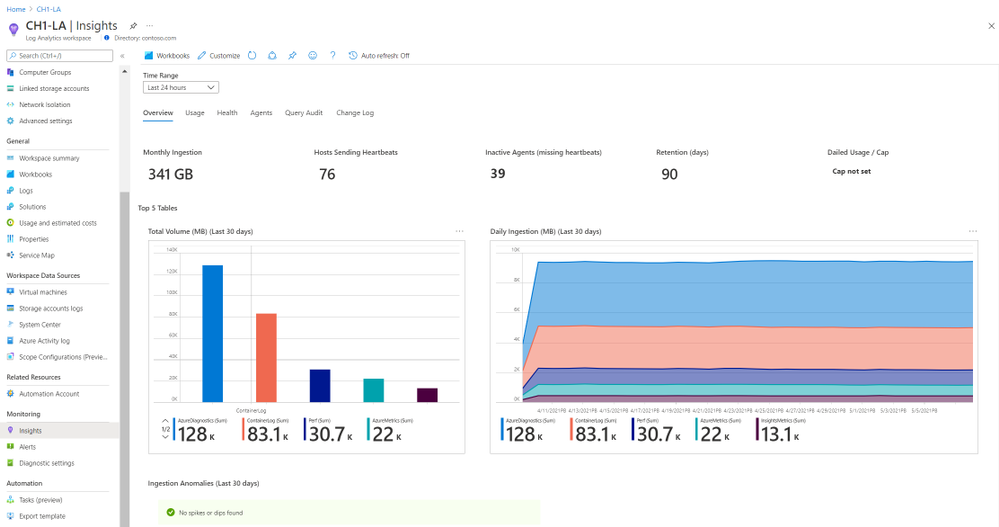
The Overview section surfaces main workspace settings and statistics, such as the total monthly ingestion volume, the data retention period, or a set daily cap and how much of was it used already.
It also shows which are the top 5 most used tables, and information on them – how much data was ingested, what’s the daily pattern and anomalies – if found.
 Workspace overview
Workspace Usage
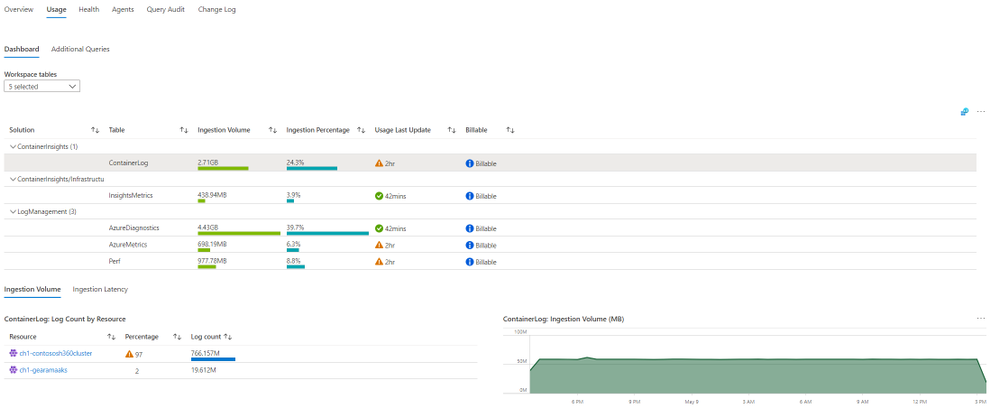
Here you can explore in detail the usage of each table of the workspace. Click a row in the top grid to see table-specific information – how much data was ingested to the table, the percentage of it from the total workspace volume, which resources sent most data, and latency data, charted by time, and split to agent and pipeline latency.
Additionally, you can switch from the Dashboard to the Additional Queries tab to run queries and learn which resources, subscriptions and resource groups ingested most data – across the workspace. That information could help you identify “spamming” resources and save costs.
 Workspace Usage
Workspace Health
The Health section shows the workspace health state, and known operational errors and warnings you should take note of. The table of operational events is based on the _LogOperation table.
 Workspace health
Workspace Agents
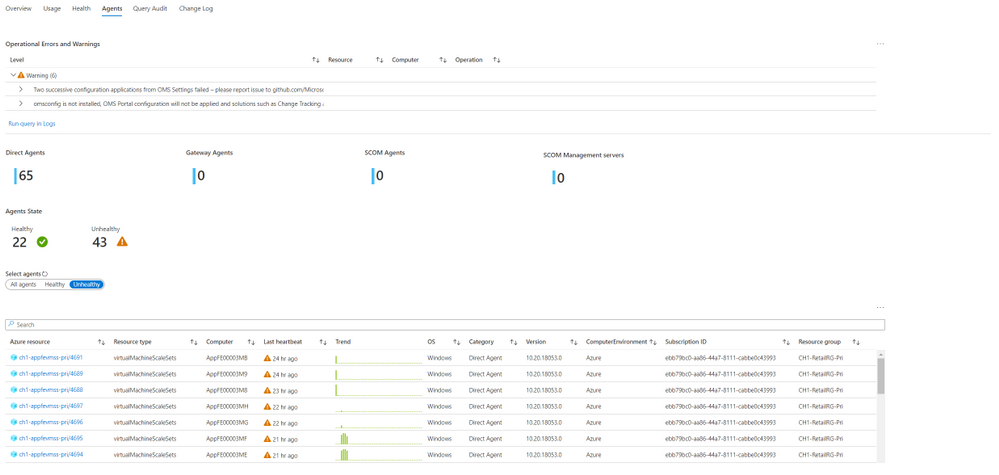
The top area of this page shows -operational errors and warnings related to your agents. The events are grouped by their description, but you can expand each type of event to see which resources were affected, and at which times.
Below it, you can review your agents in more detail – agent types, count, health and connectivity to the workspace over time.
 Workspace agents
Workspace Query Audit
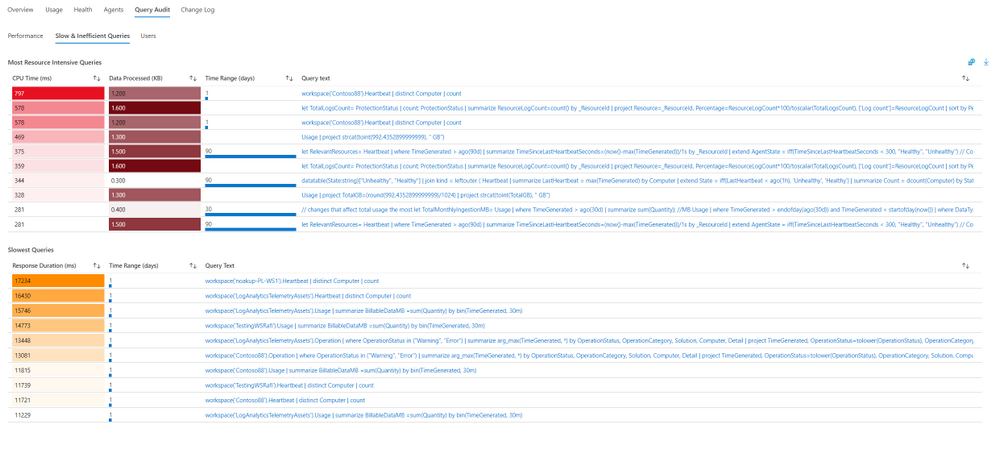
The insights regarding workspace queries rely on query auditing logs. If query auditing is enabled on your workspace, this data could help you understand and improve query performance, and load, identify the most inefficient queries and which users query most, or experience query throttling. To enable query auditing on your workspace or learn more about it, see Audit queries in Azure Monitor Logs.
 Workspace query audit
Workspace Change Log
Brought to you by Dr. Ware, Microsoft Office 365 Silver Partner, Charleston SC.


Recent Comments