by Contributed | May 10, 2021 | Technology
This article is contributed. See the original author and article here.
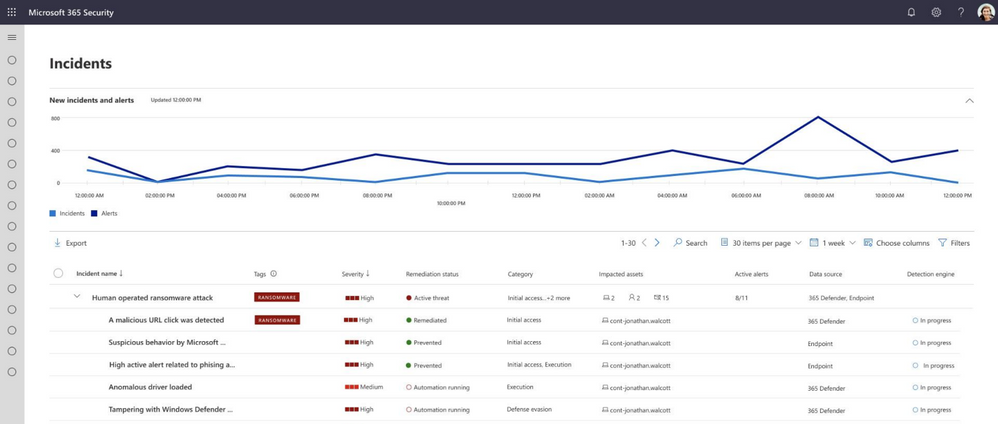
Microsoft 365 security Home page and Incidents page now include a trend graph of all the incidents and alerts over the last 24 hours.
This enables you to easily find spikes in your environment and tell if there anything abnormal happening.
The new incidents trend graph view will also allow you to determine if there are several alerts for a single incident or that your organization is under attack with several different incidents.
For example, a will usually generate a lot of alerts in your organization and all of them will be related to the same incident. Seeing that there are hundreds of alerts over time related to the same incident can help you understand that there is an emerging attack that is growing so that you can prioritize your incident response.
For more information on investigating incidents, see Investigate incidents in Microsoft 365 Defender.
by Contributed | May 10, 2021 | Technology
This article is contributed. See the original author and article here.
.png")
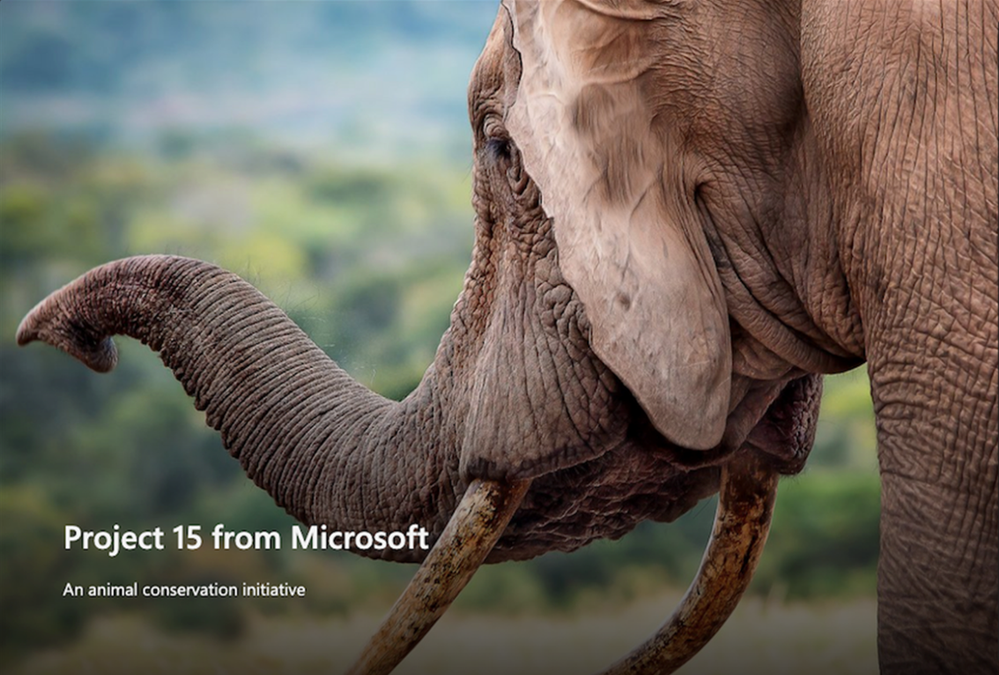
Today, May 10, 2021, we launch the second Project 15 from Microsoft video. The next chapter of a story that started with asking the question, “What if?”
I’m religiously anti-spoiler, so I will pause for you to watch the video.
But if you are asking yourself, “the second video?” let’s back up two years, and I will tell you a short history that brings us to today. Spoiler alert, it involves a first video.
 Daisuke Nakahara at the filming of the first Project 15 video – September 2019
Part 1: What is Project 15 from Microsoft?
Project 15 started two years ago on a “what if” that Daisuke and I shared. What if we could figure out a way to connect our commercial IoT solutioning world to the scientific developer community? Could we apply our processes to bring our partner solutions to scale in a new realm, rather than reinventing wheels that were stalling projects and/or wasting grant money? If we connected each other’s worlds, we could share knowledge and accelerate desperately needed solutions for our planet.
We asked others to join us on this adventure in learning and growth mindset. As we started our journey, Daisuke and I were unaware of most use cases in conservation, but we were willing to listen and learn to try to find the places we overlap.
Dr. Eric Dinerstein, Director of Biodiversity and Wildlife Solutions Program at RESOLVE was my first mentor. Eric gave me a crash course on anti-poaching in midnight emails while he was filming an episode of Robert Downey Jr.’s YouTube series, The Age of A.I.: Saving the world one algorithm at a time, in The Mara. Eric has an incredibly rich history in conservation. It’s almost beyond words so I will let this picture tell the story. In the photo below, Eric is collaring the first Rhino in 1986. Eric explained to me, “The rhino was sedated by a trained vet and who was an expert on immobilization of wild animals as being the head vet at the Kathmandu Zoo. When we injected the antidote (antagonist) in the rhino’s ear vein, it was on its feet in 30 seconds!” If you look closely, you can see curious elephants in the background.
 Dr. Eric Dinerstein collaring the first Rhino at Kathmandu Zoo – c. 1986
With Eric’s encouragement, I landed on a promise: that I may not know how to collar a Rhino, but I would gather an army of developers like me who could help him and his friends save the planet. The more I learned, the more I realized that we are out of time for talking about conservation. We all need to get involved in whatever way we can to save endangered animals. Project 15’s name was derived from the statistic that we lose an elephant from the planet every 15 minutes, a fact that Eric taught me.
The first mission of Project 15 was to ring a bell. Not that Daisuke and I had any idea what that meant yet, but we had to try.
 The first Project 15 “napkin drawing” – April 2019
I pitched Lucas Joppa, Chief Environmental Officer at Microsoft by email. He, like Eric, didn’t think it was an outlandish idea either and joined us for our first video.
 Lucas Joppa, Chief Environmental Officer at Microsoft with Sarah on filming day – September 2019
Eric was the first mentor, and soon, there were many more. We wouldn’t be here today if it weren’t for the space we were given to learn and the grace to be wrong and “try again.”
Part 2: The Phone Rings
The first call.
It took three months before the phone rang. By phone, I mean email. On January 3, 2020, we received an email from Bastiaan den Braber with a company called Zambezi Partners. Bastiaan found the video, our web page, and wrote us. It was a cold pitch from him explaining his business, and I don’t think he thought he would get a direct reply from me.

Zambezi Partners is a start-up focused on conservation with a partner ecosystem. The group wanted to build a platform to grow into a professional services firm that focused on conservation IoT as well as other sustainability use cases.
This was not who we thought would call. We didn’t know there were companies that wanted to focus on building IoT solutions in this area. This was interesting.
The second call.
Call number two came from Sonam Tashi Lama, Program Coordinator of the Red Panda Network. Sonam had been forwarded the Project 15 video and asked if we could help. Did you know that Red Pandas were discovered before Giant Pandas? They aren’t related.

We spent our nights meeting with Sonam, who is located at the base of the Himalayas in Tibet, to create what would be the digital transformation of the Red Panda Network.
The third call was Yoko Watanabe, Global Manager of the GEF Small Grants Programme implemented by the United Nations Development Program.

Yoko heard about Project 15 and asked for me and Daisuke to meet with her team. We knew that our engagement model was working as we were moving right along with our Red Panda Network project and were working with Zambezi Partners on their business model workshop and architectural design session, which is where we create the architecture of solutions on Azure with a partner.
Did I mention we did this on nights and weekends? Which is fine if you have a couple of projects.
The GEF Small Grants Programme has over 3,500 projects currently funded in a range of sustainability areas of focus from conservation of species to urban sustainability. They had 25,000 projects historically.
The goals we established with Yoko and her team were:
- Learn each other’s business language and processes
- Discover the patterns that match commercial solution engagements
- Design the engagement model for scale
Yoko proceeded to identify three projects for us to start with.
Part 3: Getting to Scale, the Project 15 Open Platform is born
So, to level set, by February 2020, Project 15 was just the two of us. A start-up named Zambezi Partners. An NGO saving red pandas. And, the UNDP’s GEF Small Grants Programme with their thousands of projects.
This is a scale problem to solve.
We started with the three projects from Yoko’s team: two in St. Lucia and one in Panama. We realized the developers didn’t need to learn the IoT “plumbing” every time, nor did they want to. Daisuke’s metaphor of not needing to know how to build a piano to write music is spot on.

The next “what if” was to build 80% of the IoT infrastructure that these solutions had in common and put it on GitHub. In building the Project 15 Open Platform, we wanted to spin up a solution that enabled scientific developers to push a button and share it with the open-source community and universities to leverage.
Part 4: Elephants, Graphs, and Platform Zero by Zambezi Partners – oh my
Two years ago, when Project 15 began, I started to apply graph theory to sustainability and conservation.
 The first “napkin drawing” of the Sustainability Graph – September 2019
About six months ago, Azure Digital Twins (ADT) became graph-based.
Daisuke updated the Project 15 Open Platform with ADT to give developers a choice to spin up the Azure Digital Twins version. It is a simple flag on the template that launches picking “true” for Azure Digital Twins.
Long story, short, Zambezi Partners took the graph version of the Project 15 Open Platform and commercialized it to make Platform Zero. We had already designed their system with them and one of their device partners. It was based on IoT Hub and other PaaS services in Azure. But when I was talking about my graph theory and then Azure Digital Twins became graph enabled, Bastiaan saw the potential immediately.
 Sustainability Graph : Animal Conservation Sub-Graph v1.0
A Graph model is a more sophisticated way to model systems in conservation. By putting the devices in this graph there is more awareness around the relationship of devices within an environment and the capabilities to model entities like the animals themselves. Recently I wrote a LinkedIn article that walks through the Sustainability Graph using the sub-graph of animal conservation as I describe here in more detail.
What is so exciting about the approach that Platform Zero is taking by putting conservation up on a graph is that it enables the crossing of the gap between park-side and justice-side systems and is prepared to integrate complex processes: the processes of protecting an animal with connected devices and the processes of detecting animal trafficking.
Part 5: Who is Kate Gilman Williams?
Kate is the founder of Kids Can Save Animals. At the age of nine, she co-authored a book, “Let’s Go on Safari,” to raise awareness and advocate for animals bringing attention to issues like poaching and human wildlife conflict.

Kate became aware of Project 15 from Microsoft and reached out to me on Instagram. She had an idea, and it was a good one. Should you meet her, you will hear the urgency in her voice. She will tell you that we are out of time. She will stress to you that there will be no elephants by the time she is out of college at the rate they are disappearing. She will inspire you to act.
Kate said, “What if I could break the timeline? What if I could build an army of kids that can learn to use tools like the Project 15 Open Platform and fight for the planet?”
 Kate Gilman Williams at the Care For Wild Rhino Sanctuary
She made three very important points in her pitch:
1. It will fall on her generation to fix the Earth.
2. “If you wait until I’m older to teach me, there will be nothing left to save.”
3. Given the opportunity, my generation will be part of the solution.
Her pitch was to make a learning club, called Club 15, that she could use as a platform to teach her generation technology through applied use cases in conservation and sustainability. Could I help her architect such a club?
The challenge was, of course, she wanted to create a club that she, herself, needed to join. It’s a Catch 22. So, I designed a game. I would play a kid in the future that had been a member of Club 15 and built a time machine to go back in time to teach her how to build the club so I could exist.
Kate was “in.” To teach her the concepts of IoT and ML, I started with the IoT Learning Path developed by our IoT Developer Advocacy team. Kate ordered a device and started to code. She then added a new element to her club, GitHub. She asked if we could use something like the Animal Detection System lab from Module 3 of the IoT Learning Path designed by Henk Boelman.
After she was up to speed on the concepts of Azure and IoT, we had an Architectural Design Session for what Club 15 would look like.
 Club 15 from Kids Can Save Animals Framework
Kate uses 15-minute interviews with experts from three categories of professionals to teach concepts: 1) Scientists double-click on a conservation topic and dig into how technology is used within their specialty; 2) Technologists expand on a tech topic; and 3) Advocates that may be working in other non-scientific fields or non-technical fields discuss finding interesting ways to weave advocacy into their lives and work.

Inspired by the Microsoft focus pillars of sustainability, Kate designed four clubhouses each with a sustainability focus topic: Biodiversity, Water, Waste, and Energy/CO2. The first Club 15 Clubhouse releases today, May 10th, focusing on Biodiversity and Machine Learning with the next one landing in the Fall of 2021 focusing on Water and Sensors.
We worked with Paul DeCarlo and Henk Boelman from our IoT Developer Advocacy group to contribute to Kate’s first lab to teach how to use Custom Vision. As her project grows, other technology partners will follow our example to contribute more learning labs.
Club 15 from Kids Can Save Animals is remarkable in that it is designed to speak to a spectrum of learners: From the tech side, learning the conservation use cases from advocates and scientists; for advocates, learning more about technology concepts and how they are applied to conservation and sustainability. Everyone is welcome.
Joining Kate in her launch of Club 15 are some incredible guests that will share their knowledge.
And the amazing elephants at the Sheldrick Wildlife Trust!
 Kate with the orphans at the Sheldrick Wildlife Trust
The Butterfly Effect of Innovation
You never know where an idea will come from. You never know where it will take you. Project 15, if you follow it all the way back, starts with my cat Thomas and me rescuing her from a burning building. That moment in time led to Project Edison, which in turn led to Project 15.
Every moment of our lives is created by countless events. Sometimes the conundrum is that some events may be regretful or painful but without them, you wouldn’t be where you are today. The moment we are in with the Earth was created by countless events. It’s dire and I would be remiss to not say that here.
But I’ll tell you a secret I have learned. With all the bad news and the terrible statistics that we can drown in if we aren’t careful, there is a discovery down the path if you choose to follow it. Hope. There is so much hope in this solutioning community. Together, we can fix this place.
There have been many incredible people who have joined us on the Project 15 journey, the ‘Friends of Project 15.’ Daisuke and I are excited to continue with Yoko and her team at GEF Small Grants Programme implemented by the UNDP as we work to unlock scale. Each day we work with our partners to innovate on IoT solutions for sustainability from smart cities to smart manufacturing to smart farms. “Smart” very often now becoming interchangeable with “Sustainable”.
Today, Daisuke and I pass the “what if” baton that was the original spirit of Project 15 to Kate Gilman Williams and Club 15 from Kids Can Save Animals.
What if you could make a club and asked everyone to join? You never know, kid… It just might work.


by Contributed | May 8, 2021 | Technology
This article is contributed. See the original author and article here.
PostgreSQL is an excellent database for a wide range of workloads. Traditionally, the only problem with Postgres is that it is limited to a single machine. If you are using the Azure Database for PostgreSQL managed service, that limitation no longer applies to you because you can use the built-in Hyperscale (Citus) option—to transparently shard and scale out both transactional and analytical workloads. And Hyperscale (Citus) just keeps getting better and better.
The heart of Hyperscale (Citus) is the open source Citus extension which extends Postgres with distributed database superpowers. Every few months we release a new version of Citus. I’m excited to tell you that the latest release, Citus 10, is now available in preview on Hyperscale (Citus) and comes with spectacular new capabilities:
- Columnar storage for Postgres: Compress your PostgreSQL and Hyperscale (Citus) tables to reduce storage cost and speed up your analytical queries!
- Sharding on a single Citus node (Basic Tier): With Basic Tier, you can shard Postgres on a single node, so your application is “scale-out ready”. Also handy for trying out Hyperscale (Citus) at a much lower price point, starting at $0.27 USD/hour.[1]
- Joins and foreign keys between local PostgreSQL tables and Citus tables: Mix and match PostgreSQL and Hyperscale (Citus) tables with foreign keys and joins.
- Function to change the way your tables are distributed: Redistribute your tables in a single step using new alter table functions.
- Much more: Better naming, improved SQL & DDL support, simplified operations.
These new Citus 10 capabilities change what Hyperscale (Citus) can do for you in some fundamental (and useful) ways.
With Citus 10, Hyperscale (Citus) is no longer just about sharding Postgres: you can use the new Citus columnar storage feature to compress large data sets. And Citus is no longer just about multi-node clusters: with Basic Tier in Hyperscale (Citus), you can now shard on a single node to be “scale-out-ready”. Finally, Hyperscale (Citus) is no longer just about transforming Postgres into a distributed database: you can now mix regular (local) Postgres tables and distributed tables in the same Postgres database.
In short, Hyperscale (Citus) in Azure Database for PostgreSQL now empowers you to run Postgres at any scale.
Let’s dive in!
One of our favourite Postgres memorabilia is the PostgreSQL 9.2 race car poster with the signatures of all the committers from the PGCon auction in 2013. Since Citus 9.2, our open source team has been creating a new racecar image for each new Citus open source release. With Citus 10 giving you columnar, single node (Basic tier), & so much more, the Postgres elephant can now go to any scale!
Columnar storage for PostgreSQL with Hyperscale (Citus)
The data sizes of some new Hyperscale (Citus) customers are truly gigantic, which meant we needed a way to lower storage cost and get more out of the hardware. That is why we implemented columnar storage for Citus. Citus Columnar can give you compression ratios of 3x-10x or more, and even greater I/O reductions. The new Citus columnar feature is available in:
- Citus 10 open source: you can download the latest Citus packages here
- Hyperscale (Citus) in Azure Database for PostgreSQL: at the time of writing, the Citus 10 features are in preview in Hyperscale (Citus). So if you want to try out the new Citus columnar feature, you’ll want to turn the preview features on in the portal when provisioning a new Hyperscale (Citus) server group. Of course, depending on when you read this blog post, these Citus 10 features might already be GA in Hyperscale (Citus).
The best part: you can use columnar in Hyperscale (Citus) with or without the Citus scale-out features! More details about columnar table storage can be found in our Hyperscale (Citus) docs.
Our Citus engineering team has a long history with columnar storage in PostgreSQL, as we originally developed the cstore_fdw extension which offered columnar storage via the foreign data wrapper (fdw) API. PostgreSQL 12 introduced “table access methods”, which allows extensions to define custom storage formats in a much more native way.
Citus makes columnar storage available in PostgreSQL via the table access method APIs, which means that you can now create Citus columnar tables by simply adding USING columnar when creating a table:
CREATE TABLE order_history (…) USING columnar;
If you provision a row-based (“heap”) table that you’d like to later convert to columnar, you can do that too, using the alter_table_set_access_method function:
-- compress a table using columnar storage (indexes are dropped)
SELECT alter_table_set_access_method('orders_2019', 'columnar');
When you use Citus columnar storage, you will typically see a 60-90% reduction in data size. In addition, Citus columnar will only read the columns used in the SQL query. This can give dramatic speed ups for I/O bound queries, and a big reduction in storage cost.
Compared to cstore_fdw, Citus columnar has a better compression ratio thanks to zstd compression. Citus columnar also supports rollback, streaming replication, archival, and pg_upgrade.
There are still a few limitations with Citus columnar to be aware of: Indexes and update/delete are not yet supported, and it is best to avoid single-row inserts, since compression only works well in batches. We plan to address these limitations in future Citus releases, but you can also avoid them using partitioning.
If you partition time series tables by time, you can use row-based storage for recent partitions to enable single-row, update/delete/upsert and indexes—while using columnar storage to archive data that is no longer changing. To make this easy, we also added a function to compress all your old partitions in one go:
-- compress all partitions older than 7 days
CALL alter_old_partitions_set_access_method('order_history', now() – interval '7 days', 'columnar');
This procedure commits after every partition to release locks as quickly as possible. You can use pg_cron to run this new alter function as a nightly compression job.
To learn more, check out Jeff Davis’ blog post: Citus 10 brings columnar compression to Postgres. Jeff also created a video demo, if you’re a more visual person this Citus columnar demo might be a good way to get acquainted.
Starting with Basic Tier in Hyperscale (Citus)—to be “scale-out ready”
We often think of Hyperscale (Citus) as “worry-free Postgres”, because Citus takes away the one concern you may have when choosing Postgres as your database: reaching the limits of a single node. However, when you migrate a complex application from Postgres to Hyperscale (Citus), you may need to make some changes to your application to handle restrictions around unique- and foreign key-constraints and joins, since not every PostgreSQL feature has an efficient distributed implementation.
In Azure, the easiest way to scale your application on Postgres without ever facing the cost of migration (and be truly worry-free) is to use Hyperscale (Citus) from day one, when you first build your application. Applications built on Citus are always 100% compatible with regular PostgreSQL, so there is no risk of lock-in. The only downside of starting on Hyperscale (Citus) so far was the cost and complexity of running a distributed database cluster, but this changes in Citus 10. With Citus 10 and the new Basic tier in Hyperscale (Citus), you can now shard your Postgres tables on a single Citus node to make your database “scale-out-ready”.
To get started with Hyperscale (Citus) on a single node, this post about sharding Postgres with Basic tier is a good place to start. Be sure to enable preview features in the Azure portal when provisioning Azure Database for PostgreSQL—and then select the new “Basic Tier” feature that’s available in preview on Hyperscale (Citus). As of today, you can provision Basic tier for $0.27 USD/hour in US East 1. This means that you can try out Hyperscale (Citus) at a much lower price point: about ~8 hours of kicking the tires and you’ll only pay $2-3 USD.
 Diagram 1: When provisioning the Hyperscale (Citus) deployment option in the Azure portal for Azure Database for PostgreSQL, you’ll now have two choices: Basic Tier and Standard Tier.
Once connected, you can create your first distributed table by running the following commands:
CREATE TABLE data (key text primary key, value jsonb not null);
SELECT create_distributed_table('data', 'key');
The create_distributed_table function will divide the table across 32 (hidden) shards that can be moved to new nodes when a single node is no longer sufficient.
You may experience some overhead from distributed query planning, but you will also see benefits from multi-shard queries being parallelized across cores. You can also make distributed, columnar tables to take advantage of both I/O and storage reduction and parallelism.
The biggest advantage of distributing Postgres tables with Basic tier in Hyperscale (Citus) is that your database will be ready to be scaled out using the Citus shard rebalancer.
Joins & foreign keys between PostgreSQL and Citus tables
With the new Basic Tier feature in Hyperscale (Citus) and the shard rebalancer, you can be ready to scale out by distributing your tables. However, distributing tables does involve certain trade-offs, such as extra network round trips when querying shards on worker nodes, and a few unsupported SQL features.
If you have a very large Postgres table and a data-intensive workload (e.g. the frequently-queried part of the table exceeds memory), then the performance gains from distributing the table over multiple nodes with Hyperscale (Citus) will vastly outweigh any downsides. However, if most of your other Postgres tables are small, then you might end up having to make additional changes without much additional benefit.
A simple solution would be to not distribute the smaller tables at all. In most Hyperscale (Citus) deployments, your application connects to a single coordinator node (which is usually sufficient), and the coordinator is a fully functional PostgreSQL node. That means you could organize your database as follows:
- convert large tables into Citus distributed tables,
- convert smaller tables that frequently JOIN with distributed tables into reference tables,
- convert smaller tables that have foreign keys from distributed tables into reference tables,
- keep all other tables as regular PostgreSQL tables local to the coordinator.
 Diagram 2: Example of a data model where the really large table (clicks) is distributed. Because the Clicks table has a foreign key to Ads, we turn Ads into a reference table. Ads also has foreign keys to other tables, but we can keep those other tables (Campaigns, Publishers, Advertisers) as local tables on the coordinator.
That way, you can scale out CPU, memory, and I/O where you need it. And minimize application changes and other trade-offs where you don’t. To make this model work seamlessly, Citus 10 adds support for 2 important features:
- foreign keys between local tables and reference tables
- direct joins between local tables and distributed tables
With these new Citus 10 features in Hyperscale (Citus), you can mix and match PostgreSQL tables and Citus tables to get the best of both worlds without having to separate them in your data model.
Alter all the things!
When you distribute a Postgres table with Hyperscale (Citus), choosing your distribution column is an important step, since the distribution column (sometimes called the sharding key) determines which constraints you can create, how (fast) you can join tables, and more.
Citus 10 adds the alter_distributed_table function so you can change the distribution column, shard count, and co-location of a distributed table. This blog post walks through how when and why to use alter_distributed_table with Hyperscale (Citus).
-- change the distribution column to customer_id
SELECT alter_distributed_table('orders',
                               distribution_column := 'customer_id');

-- change the shard count to 120
SELECT alter_distributed_table('orders',
                               shard_count := 120);

-- Co-locate with another table
SELECT alter_distributed_table('orders',
                               distribution_column := 'product_id',
                               colocate_with := 'products');
Internally, alter_distributed_table reshuffles the data between the worker nodes, which means it is fast and works well on very large tables. We expect this makes it much easier to experiment with distributing your tables without having to reload your data.
You can also use the alter_distributed_table function in production (it’s fully transactional!), but you do need to (1) make sure that you have enough disk space to store the table several times, and (2) make sure that your application can tolerate blocking all writes to the table for a while.
Many other features in Citus 10—now available in preview in Hyperscale (Citus)
And there’s more!
- DDL support
More DDL commands work seamlessly on distributed Citus tables, including CREATE STATISTICS, ALTER TABLE .. SET LOGGED, and ALTER SCHEMA .. RENAME.
- SQL support
Correlated subqueries can now be used in the SELECT part of the query, as long as the distributed tables are joined by their distribution column.
- New views to see the state of your cluster: citus_tables and citus_shards
citus_tables view shows Citus tables and their distribution column, total size, and access method. The citus_shards view shows the names, locations, and sizes of individual shards.
Two easy ways to start playing with Citus 10
If you are as excited as we are and want to play with these new Citus 10 features, doing so is now easier than ever.
- The Basic Tier in Hyperscale (Citus) makes it very cheap to get started with a managed Citus node in our Azure Database for PostgreSQL managed service. (There’s a Basic tier Quickstart in our Azure docs, too.)
- And you can also run Citus open source on your laptop as a single Docker container! Not only is the single docker run command an easy way to try out Citus—it gives you functional parity between your local dev machine and using Citus in the cloud.
# run PostgreSQL with Citus on port 5500
docker run -d --name citus -p 5500:5432 -e POSTGRES_PASSWORD=mypassword citusdata/citus

# connect
psql -U postgres -d postgres -h localhost -p 5500
You can also check out our lovely new Getting started with Citus page for more resources on how to get started—my teammates have curated some good learning tools there, whether your preferred learning mode is reading, watching, or doing.
More deep-dive blog posts about new Citus 10 capabilities
And since the Citus 10 open source release rolled out, we’ve also published a bunch of deep-dive blog posts (plus a demo!) about the spectacular new capabilities in Citus 10:
Finally, a big thank you to all of you who use Hyperscale (Citus) to scale out Postgres and who have taken the time to give feedback and be part of our journey. If you’ve filed issues on GitHub, submitted PRs, talked to our @citusdata or @AzureDBPostgres team on Twitter, signed up for our monthly Citus technical newsletter, or joined our Citus Public community Q&A… well, thank you. And please, keep the feedback coming. You can always reach our product team via the Ask Azure DB for PostgreSQL email address too.
We can’t wait to see what you do with the new Citus 10 features in Hyperscale (Citus)!
Footnotes
- As of the time of publication, in the East US region on Azure, the cost of a Hyperscale (Citus) Basic tier with 2 vCores, 8 GiB total memory, and 128 GiB of storage on the coordinator node is $0.27/hour or ~$200/month ↩
by Contributed | May 7, 2021 | Technology
This article is contributed. See the original author and article here.
Azure Sentinel Incidents contain detection details which enable security analysts to investigate using a graph view and gain deep insights into related entities. The responsiveness of a security analyst towards the triggered incidents (also known as Mean Time To Acknowledge – MTTA) is crucial as being able to respond to a security incident quickly and efficiently will reduce the incident impact and mitigate the security threats.
The newly introduced Automation Rules allow you to automatically assign incidents to an owner with the built-in action. This is extremely useful when you need to assign specific incidents to a dedicated SME. It will reduce the time of acknowledgement and ensure accountability for each incident.
However, some organizations have a group of analysts working on different shift schedules and required the ability to assign an incident to an analyst automatically based on the working schedule to improve the MTTA.
In this blog, I will discuss how to extend the incident assignment capability in Azure Sentinel by using a Playbook to rotate user assignments based on shift schedules. Plus, I will also discuss how you could manage incident assignments for multiple support groups at the end of the blog.
Considerations and design decisions
Before we dive into the Playbook, let’s discuss some of the important points taken into consideration and the design decisions when implementing this incident assignment Playbook.
- Scheduling tool
- Shifts for Teams is used as the scheduling tool because it is available as part of the Microsoft Teams and it provides the ability to create and manage employee schedules.
- It is easier to automate incident assignment when there is a centralized schedule management tool to keep track of employees’ timesheet or availability.
- Assignment criteria
- The goal is to assign the incidents equally across all analysts. Hence, the analyst with the least number of incidents in current shift will be assigned first.
- We also need to consider the average time a security analyst takes to resolve a security incident (also known as Mean Time To Resolve – MTTR). In this Playbook, I have set a default value of 1 hour as the MTTR (a configurable variable) and I am using it as a condition where a security analyst must have at least 1 hour remaining in the shift to be eligible for incident assignment. For example, if a security analyst is about to go off shift in 30 minutes, the incident won’t be assigned to that analyst as the remaining time is less than the default value of 1 hour.
- Notification
- It is important to notify the assignee when an incident is being assigned.
- In this Playbook, an email will be sent to the assignee and a comment will be added to the incident on the incident assignment.
What is Shifts for Teams?
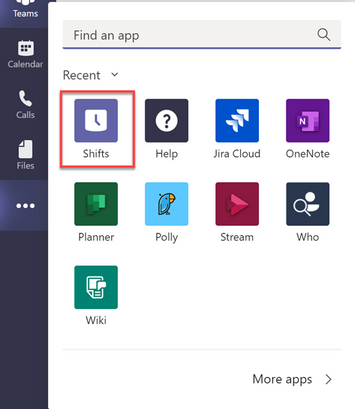
Shifts is a schedule management application in Microsoft Teams that helps you create, update, and manage schedules for your team. Shifts is enabled by default for all Teams users in your organization. You can add Shifts app to your Teams menu by clicking on the ellipses (…) and select Shifts from the app list.
The first step to get started in Shifts is to populate schedules for your team. You can either create a schedule from scratch (create for yourself or on behalf of your team members) or import an existing one from Excel. In terms of permission, you need to be an Owner of the team to create the schedule. The schedules will not be visible to your team members until you publish it by clicking “Share with team” button.
Here is an example of how a Shifts schedule looks like. If you’re an owner of multiple teams, you can toggle between different Shifts schedules to manage them.

The Logic App
Download link:
Here is the link to the Logic App template.
Prerequisites:
1. User account or Service Principal with Azure Sentinel Responder role
– Create or use an existing user account or Service Principal or Managed Identity with Azure Sentinel Responder role.
– The account will be used in Azure Sentinel connectors (Incident Trigger, Update incident and Add comment to incident) and a HTTP connector.
– This blog will walk you through using System Managed Identity for the above connectors.
2. Setup Shifts schedule
– You must have the Shifts schedule setup in Microsoft Teams.
– The Shifts schedule must be published (Shared with team).
3. User account with Owner role in Microsoft Teams
– Create or use an existing user account with Owner role in a Team.
– The user account will be used in Shifts connector (List all shifts).
4. User account or Service Principal with Log Analytics Reader role
– Create or use an existing user account with Log Analytics Reader role on the Azure Sentinel workspace.
– The user account will be used in Azure Monitor Logs connector (Run query and list results).
5. An O365 account to be used to send email notification.
– The user account will be used in O365 connector (Send an email).
Post Deployment Configuration:
1. Enable Managed Identity and configure role assignment.
a) Once the Playbook is deployed, navigate to the resource blade and click on Identity under Settings.

b) Select On under the System assigned tab. Click Save and select Yes when prompted.
c) Click on Azure role assignments to assign role to the Managed Identity.
d) Click on + Add role assignment.
e) Select Resource group under Scope and select the Subscription and Resource group where the Azure Sentinel Workspace is located.
(Note: it’s the subscription and resource group of the Azure Sentinel workspace, not the Logic App).
f) Select Azure Sentinel Responder under Role and click Save.

2. Configure connections.
a) Edit the Logic App to find the below connectors marked with  .
.
– When Azure Sentinel incident creation rule was triggered.
– List all shifts.
– Run query and list results – Get user with low assignment.
– Update incident.
– Add comment to incident.
– Send an email.
b) We will leverage the Managed Identity we configured in step 1 for the following Azure Sentinel Connectors
(hint: these are the ones with Azure Sentinel logo):
– When Azure Sentinel incident creation rule was triggered.
– Update incident.
– Add comment to incident.
i) On the first connector (trigger), select Add new

ii) Click “Connect with managed Identity”.

iii) Specify the connection name and click Create.

iv) On the remaining Azure Sentinel Connectors, select the connection you created earlier.

c) Next, fix the below remaining connectors by adding a new connection to each connector and sign in with the accounts described under prerequisites.
– List all shifts.
– Run query and list results – Get user with low assignment.
– Send an email.
3. Select the Shifts schedule
a) On the List all shifts connector, click on the X sign next to Team field for the drop-down list to appear.
.png")
b) Select the Teams channel with your Shifts schedule from the drop-down list.

c) Save the Logic App once you have completed the above steps.
Assign the Playbook to Analytic Rules using Automation Rules
1) Before you begin, ensure you have the following permissions:
– Logic App Contributor on the Playbook.
– Owner permission on the Playbook’s resource group (to grant Azure Sentinel permission to the playbooks’ resource groups).
2) Next, create an Automation Rule to assign the Playbook to your analytic rules with you specified conditions.
3) In the below example, I am creating an Automation Rule to run the incident assignment Playbook for selected Analytic rules and the severity equals to “High” and “Medium”.

4) Uder Actions -> select Run Playbook and choose the Playbook.
Note: If the Playbook appeared as grey-out in the drop-down list, that means Azure Sentinel doesn’t have permission to run this Playbook.

You can grant permission on the spot by selecting the Manage playbook permissions link and grant permission to the playbooks’ resource groups.

5) After that, you will be able to select the Playbook. Click Apply.

Note: If you received the error message “Caller is missing required Playbook triggering permissions” when saving the Automation Rule, that means you do not have the “Logic App Contributor” permission on the Playbook.
Incident Assignment Logic
1) When an incident is generated, it triggers the Logic app to get a list of analysts who are on-shift at that time (analysts with time-off will be excluded from the incident assignment).
2) Analyst with the least incidents assigned on the current shift will be assigned incident first. When there are multiple analysts with same incident count, the selection be will based on the order of the analyst’s AAD objectId.
3) Analysts must have at least 1 hour left (default value) in their shift to be eligible for assignment.
For example, if the shift of an analyst is ending at 6pm. The analyst will not be assigned between 5pm and 6pm.
You can change the variable value of “ExpectedWorkHoursPerIncident” to 0 if you want the analyst to be assigned during the final shift hour.

4) Here is a sample assignment flow for your reference:
In this example, the following shift schedules have been configured for 4 analysts.
User Object Id
|
Shift Schedule
|
A1
|
8am to 6pm
|
A2
|
8am to 6pm
|
A3
|
4pm to 2am
|
A4
|
4pm to 2am
|
Here is how the incident assignment would work based on the incident assignment logic:
Incident Creation Time
|
Assign to
|
Total
|
8:00am
|
A1
|
A1=1
A2=0
A3=0
A4=0
|
9:45am
|
A2
|
A1=1
A2=1
A3=0
A4=0
|
2:00pm
|
A1
|
A1=2
A2=1
A3=0
A4=0
|
4:00pm
|
A3
|
A1=2
A2=1
A3=1
A4=0
|
4:10pm
|
A4
|
A1=2
A2=1
A3=1
A4=1
|
5:00pm
|
A3
*A3 is assigned instead of A2 because ExpectedWorkHoursPerIncident is set to 1.
|
A1=2
A2=1
A3=2
A4=1
|
5:50pm
|
A4
*A4 is assigned instead of A2 because ExpectedWorkHoursPerIncident is set to 1.
|
A1=2
A2=1
A3=2
A4=2
|
11:20pm
|
A3
|
A1=2
A2=1
A3=3
A4=2
|
Notification
Email Notification:
- When an incident is assigned, the incident owner will be notified via email.
- The email body has a direct link to the incident page and a banner with color mapped to incident’s severity (High=red, Medium=orange, Low=yellow and Informational=grey).

Incident Comment:
- Comment will be added to the incident for the assignment with the name of the Playbook.

Managing Incident assignment for multiple Support Groups
There are times when you need to assign incidents based on different incident types and support groups. For example, Team A is responsible for Azure AD incidents, Team B is responsible for Office 365 incidents while the rest of the incidents will go to Team C.
This can be achieved by creating Shifts schedule for each support group and deploy a separate Playbook for each group. Then, assign the Logic App to the analytic rules accordingly as illustrated in the diagram below:

Below are the sample Automation Rules created for multiple Shifts channels (Support Groups).

Each Automation Rule is configured for different Team:

Automation Rule for Team A

Automation Rule for Team B
Summary
I hope you find this useful. Give it a try and hopefully it would help in reducing the time of acknowledgement (especially for critical incidents) in your environment.
Special thanks to @liortamir , @Yaniv Shasha , @edilahav and @Ofer_Shezaf for the review.
by Contributed | May 7, 2021 | Technology
This article is contributed. See the original author and article here.
As highlighted in my last blog posts (for Splunk and Qradar) about Azure Sentinel’s Side-by-Side approach with 3rd Party SIEM, there are some reasons that enterprises leverage Side-by-Side architecture to take advantage of Azure Sentinel capabilities.
For my last blog post I used the Microsoft Graph Security API Add-On for Splunk for Side-by-Side with Splunk. Another option would be to implement a Side-by-Side architecture with Azure Event Hub. Azure Event Hubs is a big data streaming platform and event ingestion service. It can receive and process events per second (EPS). Data sent to an Azure Event Hub can be transformed and stored by using any real-time analytics provider or batching/storage adapters.
This blog describes the usage of Splunk app Splunk Add-on for Microsoft Cloud Services in Side-by-Side architecture with Azure Sentinel.
For the integration, an Azure Logic app will be used to stream Azure Sentinel Incidents to Azure Event Hub. From there Azure Sentinel Incidents can be ingested into Splunk.
Let’s go with the configuration!
Preparation
The following tasks describe the necessary preparation and configurations steps.
- Onboard Azure Sentinel
- Register an application in Azure AD
- Create an Azure Event Hub Namespace
- Prepare Azure Sentinel to forward Incidents to Event Hub
- Configure Splunk to consume Azure Sentinel Incidents from Azure Event Hub
- Using Azure Sentinel Incidents in Splunk
Onboarding Azure Sentinel
Onboarding Azure Sentinel is not part of this blog post. However, required guidance can be found here.
Register an Application in Azure AD
The Azure AD app is later required to use it as service principle for the Splunk Add-on for Microsoft Cloud Services app.
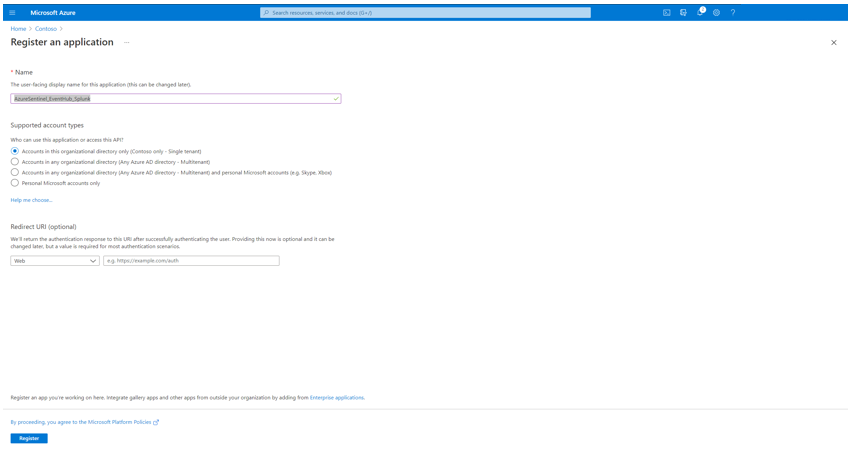
To register an app in Azure AD open the Azure Portal and navigate to Azure Active Directory > App Registrations > New Registration. Fill the Name and click Register.
Click Certificates & secrets to create a secret for the Service Principle. Click New client secret and make note of the secret value.

For the configuration of Splunk Add-on for Microsoft Cloud Services app, make a note of following settings:
- The Azure AD Display Name
- The Azure AD Application ID
- The Azure AD Application Secret
- The Tenant ID
Create an Azure Event Hub Namespace
As next step create an Azure Event Hub Namespace. You can use an existing one, however for this blog post I decided to create a new one.
To create an Azure Event Hub Namespace open the Azure Portal, and navigate to Event Hubs > New. Define a Name for the Namespace, select the Pricing Tier, Throughput Units and click Review + create.

Review the configuration and click Create.

Once the Azure Event Hub Namespace is created click Go to resource to follow the next steps.

Click Event Hubs, after to Event Hub to create an Azure Event Hub within the Azure Event Hub Namespace.

Define a Name for the Azure Event Hub, configure the Partition Count, Message Retention and click Create.

Navigate to Access control (IAM) and click to Role assignments. Click + Add to add the Azure AD Service Principle created before and delegate as Azure Event Hubs Data Receiver and click Save.

For the configuration of Splunk Add-on for Microsoft Cloud Services app, make a note of following settings:
- The Azure Event Hub Namespace Host Name
- The Azure Event Hub Name
Prepare Azure Sentinel to forward Incidents to Event Hub
For the forwarding for Azure Sentinel Incidents to Azure Event Hub you need to firstly configure an Azure Logic App, and secondly an Automation Rule in Azure Sentinel to trigger the playbook for any Incidents in Azure Sentinel.
For my scenario I configured an Azure Logic App as following shown:

Startwith the Azure Sentinel trigger When Azure Sentinel Incident Cration Rule was Triggered. Parse the output for later usage. For the Azure EventHub connection, define first the connection to Azure Event Hub and select the Azure EventHub name. Define a JSON format as content to send selected fields from an Azure Sentinel Incident to Azure EventHub. For my case I want to forward the fields Title, Severity, ProviderName and the IncidentURL to Azure EventHub.
You can also have the full Body from Parse JSON output as well, to forward all attributes of an Azure Sentinel Incident.

Save the Azure Logic App and navigate to Azure Sentinel > Automation. From here you can create an Automation rule to trigger the Azure Logic App, created in previous step.
Click to + Create and select Add new rule.

Define a Name for the Automation rule name and define the Conditions. As I want to trigger the Azure Logic App for any Analytics rule in Azure Sentinel, I let the Condition as is – “all” (for “all rules” is selected, you can choose specifc rules to inculde or exclude. Select the Run Playbook as Action and the Azure Logic App created before and click Apply.

Once the configuration is completed, you can review the Automation rule in Automation page.
Configure Splunk to consume Azure Sentinel Incidents from Azure Event Hub
To ingest Azure Sentinel Incidents forwarded to Azure Event Hub there is a need of to install the Splunk App, Splunk Add-on for Microsoft Cloud Services.
For the installation open the Splunk portal and navigate to Apps > Find More Apps. For the dashboard find the Splunk Add-on for Microsoft Cloud Services app and Install.

Once installed, navigate to App Splunk Add-on for Microsoft Cloud Services > Azure App Account to add the Azure AD Service Principles, and use the noted details from previous step. Click Add and define a Name for the Azure App Account, add the Client ID, Client Secret, Tenant ID and choose Azure Public Cloud as Account Class Type. Click Update to save and close the configuration.

Now navigate to Inputs within the Splunk Add-on for Microsoft Cloud Services app and select Azure Event Hub in Create New Input selection.

Define a Name for the Azure Event Hub as Input, select the Azure App Account created before, define the Event Hub Namespace (FQDN), Event Hub Name, let the other settings as default and click Update to save and close the configuration.

Using Azure Sentinel Incidents in Splunk
Once the ingestion is processed, you can query the data by using sourcetype=”mscs:azure:eventhub” in search field.

Summary
We just walked through the process of how to implement Azure Sentinel in Side-by-Side with Splunk by using the Azure Event Hub.
Stay tuned for more us cases in our Blog channel!
Thank you for
Many thanks to Clive Watson for brainstorming and ideas for the content.

Recent Comments