by Scott Muniz | Sep 16, 2020 | Azure, Technology, Uncategorized
This article is contributed. See the original author and article here.
Azure Stream Analytics is a full managed service for real-time analytics. In addition to the experience in Azure portal we have developer tools which make development and debugging easier. This blog will introduce a new debugging feature in Azure Stream Analytics tools extension for Visual Studio Code.
Have you ever faced a situation where your streaming job produces no result or unexpected results and you don’t know how to trouble shoot which parts go wrong? We are happy to announce the roll out of the newest debugging feature – job diagram debugging in Visual Studio Code extension for Azure Stream Analytics. This feature brings together job diagrams, metrics, diagnostic logs, and intermediate results to help you quickly isolate the source of a problem. You can not only test your query on your local machine but also connect to live sources such as Event Hub, IoT Hub. The job diagram helps you to understand how data flows between each step, and you can view the intermediate result set and metrics to debug issues. You can iterate fast because each local test of the job only takes seconds.
This blog will use a real example to show you how to debug an Azure Stream Analytics job using job diagram in Visual Studio Code.
Note
This job diagram only shows the data and metrics for local testing in a single node on your own machine. It should not be used for performance and scalability tuning.
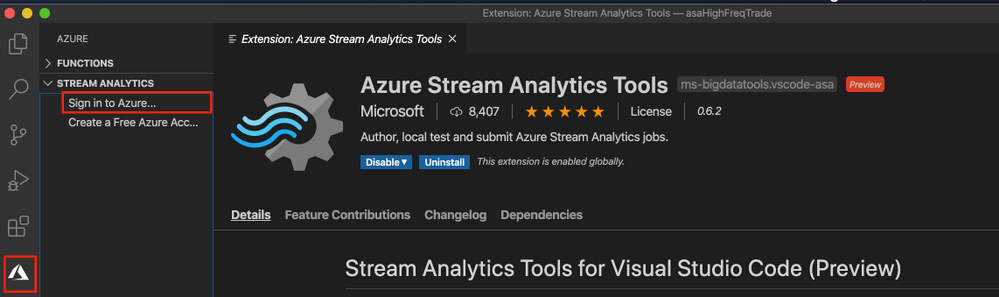
Step 1 Install the tools

Step 2 Open your job in Visual Studio Code
Please go to step 3 if you already have your Azure Stream Analytics project opened in Visual Studio Code.
Open the Azure Stream Analytics job you want to debug on the Query Editor on Azure portal. Select from drop down Open in Visual Studio and choose Visual Studio Code. Then choose Open job in Visual Studio Code. The job will be exported as an Azure Stream Analytics project in Visual Studio Code.


Step 3 Run job locally
Since the credentials are already auto-populated, only thing you need to do is to open the script and Run locally. Make sure the input data is sending to your job input sources.

Step 4 Debug using job diagram
The job diagram shown on the right window of the editor shows how data flows from input sources, like Event Hub or IoT Hub, through multiple query steps to output sinks. You can also view the data as well as metrics of each query step in each intermediate result set to find the source of an issue.
Now, let’s look at a real example job below. We have a job receiving stock quotes for different stocks. In the query there are filters on a few stocks but one output does not have any data.
We run the job locally against live input stream from Event Hub. Through job diagram we can see that the step ‘msftquotes’ does not have data flowing in.

To troubleshoot that, let’s zoom in the diagram and select the upstream step ‘typeconvertedquotes’ to see if there is any output. In the node it shows that there are 3135 output events. Also, from the Result tab below it is easy to find out that there are data been output from this step with symbol ‘MSFT’.

Then we select the step ‘msftquotes’ and locate to the corresponding script to take a closer look.

Now we find the root cause – there is a typo in the script, ‘%MSFT%’ is mistakenly typed as ‘%MSFA%’.
MSFTQuotes AS (
SELECT typeconvertedquotes.* FROM typeconvertedquotes
WHERE symbol like ‘%MSFA%’
AND bidSize > 0
),
Let’s fix the typo, stop the job and run again.
Look, the data is flowing into step ‘msftquotes’ and the other downstream steps.

Other than checking the result for each step, you can also view logs and metrics for the job.
Step 5 Submit to Azure
When local testing is done, submit the job to Azure to run in the cloud environment and further validate the job status in a distributed manner.
Hope you find these new features helpful, and please let us know what capabilities you’re looking for with regard to job debugging in Azure Stream Analytics!
by Scott Muniz | Sep 16, 2020 | Uncategorized
This article is contributed. See the original author and article here.
Wouldn’t it be nice if you could set up custom workflows with connectors to effectively index and generate captions from a large volume of video and audio files, without needing to write a single line of code? With Azure Media Services Video Indexer, you can utilize Logic Apps and Power Automate connectors that are compatible with our API, without coding! The resulting solution provides better visibility into the health of your workflow, while making debugging easier.
Azure Media Services Video Indexer v2 REST API supports both server-to-server and client-to-server communication. Video Indexer users can integrate video and audio insights (including captions) easily into their application logic, unlocking new experiences and monetization opportunities.
In this tutorial, you will learn how to:
- Trigger a Logic Apps / Power Automate flow every time a video file is added to a specific OneDrive or OneDrive Business folder.
- Use the flow to automatically index and generate captions for the video file.
- Set a second flow to save the video captions to a different OneDrive folder.
Prerequisites
- Create an Azure subscription if you do not have one. You can create a free account here.
- A Video Indexer account, with access to the APIs via API key.
- A One Drive or OneDrive Business Account. In your OneDrive, create two folders – one to store videos and the other to store the captions generated by Video Indexer.
In this tutorial, we will use the term “flow” to describe both Power Automate flows and Logic Apps automations. Since the editors and capabilities are almost identical in both solutions, please note that the diagrams and explanations are applicable to both Logic Apps and Power Automate.
Index video automatically by copying it to OneDrive
This scenario is comprised of two separate flows that work together. The first flow is triggered when a file is added to a OneDrive or OneDrive for Business account. The flow uploads the new file to Video Indexer with a callback URL to send a notification once the indexing operation is completed.
The second flow is triggered from the callback URL. It saves the generated captions back to a JSON file in OneDrive. This two-flow approach can effectively be used to support async upload and indexing of a large volume of files.
You can create a similar flow that will be triggered when a blob is added or modified in an Azure Storage account to save the captions to your blob.
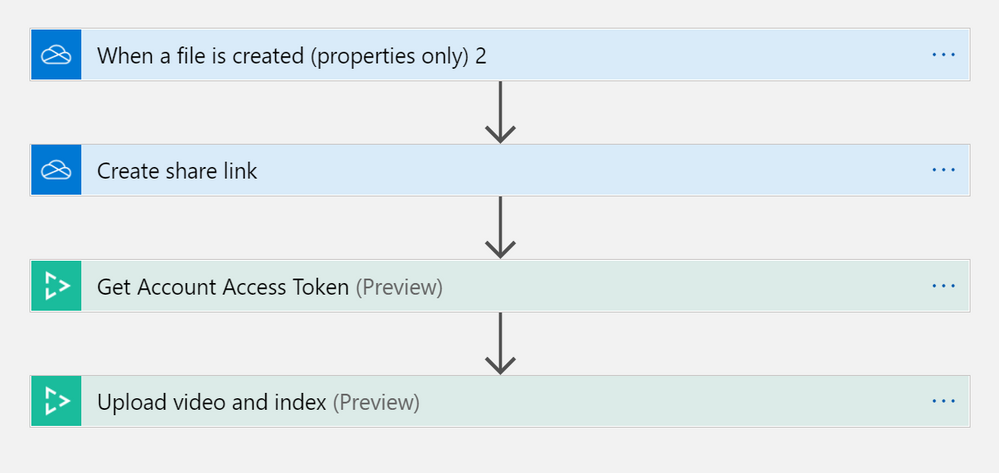
Set up the file upload flow
The first flow is triggered whenever a file is added to your OneDrive folder. When triggered, it will create a URL that enables you to upload and index your file in Video Indexer. Let’s start by creating the following flow in Logic Apps or Power Automate. Below is a workflow diagram from Logic Apps editor, but since the Power Automate editor is practically the same you can follow the steps in both solutions.

Note that every OneDrive trigger or action is available both for OneDrive and OneDrive for Business. Make sure to choose the one you use when you create the flow.
To set up the first flow, you will need to provide your OneDrive credentials and Video Indexer API Key.
“Connection name” can be a value of your choosing.


Once you are connected to your OneDrive and Video Indexer accounts, go to the “When a file is created” trigger and select the folder where you want your video files to be stored. In this example we’ve called the folder “VideoIndexer”.

Next, go to the “Create share link” action. Select “File identifier” from the Dynamic content options to send the new file to the “Create share link” action and set the Link type to “Direct” so Video Indexer could access the file in the next steps.

Fill out your account Location and ID to get the Video Indexer account token. Access tokens are needed to use the Video Indexer APIs for security purposes. This ensures that all calls are either coming from you or those who have access permissions to your account. You can read more about access tokens here.

For “Upload video and index”, fill out the required parameters and Video URL. Select “Add new parameter” and select “Callback URL”.

Leave the callback URL empty for now. You will add it after you have finished the second flow and when the callback URL is created.
Add the parameter “Indexing Preset” and set it to “AudioOnly”.
You can also choose the default value for the other parameters or set them according to your needs.
Click “Save”, and you are ready to move on to configuring the second flow, which will be used to generate the captions once the upload and indexing process is completed.
Set up the caption’s Generating flow
Once the uploading and indexing from the first flow is completed, it will send an HTTP request with the correct callback URL to trigger the second flow. It will also retrieve the captions generated by the Video Indexer. In this example, the output of your indexing job is stored in the OneDrive folder you set up. However, it is up to you to decide on how or where you would like to store the output.
Create the second flow separately from the first one:

To set up this flow, you will need to provide your Video Indexer API Key and OneDrive Business credentials again. Update the same parameters as you did for the first flow.
For your trigger, you will see the HTTP POST URL field. The URL will not be generated until after you save your flow; however, you will need the URL eventually. We will come back to this later.
Fill out your account Location and ID to get the Video Indexer account token.
Go to the “Get Video Index” action and fill out the required parameters. For Video ID, put in the following expression: triggerOutputs()[‘queries’][‘id’]

This expression tells the connector to get the Video ID from the output of your trigger. In this case, the output of your trigger will be the output of “Upload video and index” from your first trigger.
Note: This flow can be built without the “Get Video Index” action but using it will provide the “Video Name” field which we will use later to name the captions file.
Go to the “Get Video Captions” action and fill out the required parameters. For Video ID, put in the same value you used in the last action: triggerOutputs()[‘queries’][‘id’]

Go to the “Create file” action and select the folder in which you want the captions to be saved. Every video you upload will create a separate VTT caption file. You can set the caption file name to be identical to your video name by using the Name field from the “Get Video Index” action. For File Content, go to the Dynamic Fields of “Get Video Caption” and click on “See more”. Select the Body field.

Click “Save flow.”
Once the flow is saved, an HTTP POST URL is created in the trigger. Copy the URL from the trigger.

Now, go back to the first flow and paste the URL in the “Upload video and index” action for the Callback URL parameter.
Make sure both flows are saved, and you’re good to go!
Try out your newly created Logic App or Power Automate solution by adding a video to your OneDrive folder. Go back a few minutes later and you will see that the captions appear in the destination folder.
Clean up resources
After you are done with this tutorial, feel free to keep this Logic App or Power Automate solution up and running. However, if you do not want to keep this solution running, turn off both of your flows if you are using Power Automate or disable both flows if you’re using Logic Apps.
Next steps and further reading
For further exploration, read our tutorial on how to use Video Indexer with Logic Apps and Power Automate to automatically index videos on your blob storage and extract the insights JSON.
This tutorial showed an example of Video Indexer connectors. You can use the Video Indexer connectors for any API call provided by Video Indexer. For example, you can upload and retrieve insights, translate the results, get embed-able widgets and even customize your models. In addition, you can choose to trigger those actions based on different sources like updates to file repositories or emails sent. Next, choose to have the results updated to our relevant infrastructure/application or generate other action items.
by Scott Muniz | Sep 16, 2020 | Uncategorized
This article is contributed. See the original author and article here.
It’s time for some more container goodness coming your way! As you probably know, we have been adding some new capabilities into the Containers extension of Windows Admin Center. In recent months we added new capabilities to help not only better manage container images and containers, but to also help you build new container images based on the source of your application. With Windows Admin Center, customers can now containerize existing applications, even if you don’t have the code from which the app was built from and with no developer involvement.
Today we are adding some cool new functionality to the extension again!
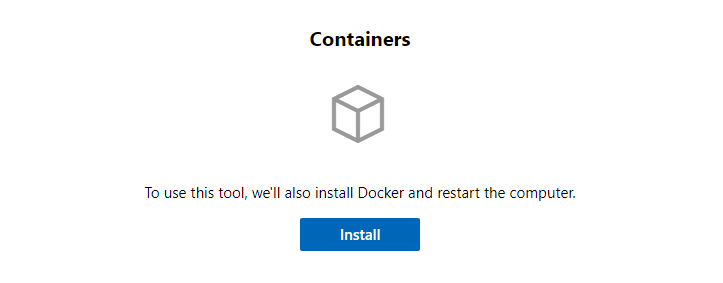
Install and configure the container host
Until now, the Containers extension assumed the container host was already configured and ready to go. If that was not the case, users would have to go to the server and install Docker and its dependencies. Now, we have a totally streamlined process inside of Windows Admin Center itself:

When you select the option to install Docker from Windows Admin Center, we will download the package, install the Docker module and the Containers feature, and restart the server. When the server is back online, we will ensure the Docker service is up and running so your container host is properly configured.
Common base container images to pull
When getting started with containers, the first thing you want to do is to ensure you have the base images pulled so when you run a new container or create a new image, you don’t have to wait for the image pull times. However, sometimes we’re not even sure which images to pull. To help with that, we’re adding an option to check the most common Windows base container images:

Keep in mind that while the Windows Admin Center UI allows you select any of the images available, the pull will fail if you try to pull an image that has an OS version higher than the container host you’re targeting. For example: If you have a Windows Server 2019 container host, you can pull LTSC 2019 images or older – not newer.
Disabling functionalities on Kubernetes nodes
One of the flexibilities of the Containers extension on Windows Admin Center is that you can target any Windows container host- even the ones that are part of a Kubernetes cluster. However, some actions on the Containers extension might cause issues in your Kubernetes environment.
For that reason, we are disabling destructive functionalities when Windows Admin Center finds the “kublet.exe” service running on a container host. The disabled functionalities when targeting a Kubernetes node are:
- On the containers tab:
- End containers
- Delete containers
- On the images tab:
- Delete container images
- Run container images
Containers extension now available on public extension feed
On previous updates, the Containers extension was available on the Insiders feed, which required users to manually add that feed to Windows Admin Center. As of today, new updates will go to the public extension feed, so you don’t have to do anything – other than install/update the extension:

We want your feedback!
We’ve been hammering this message over and over, but it is never too much! We need your feedback!
The team would love to understand how you are using the Containers extension, what is working and what is not, as well as what you would like to see added! Do you have an app you’d like to see containerized with Windows Admin Center that you currently can’t? Great! Let us know!
You can send your comments and feedback our way either via comments below, or our GitHub repo by opening a new issue.
Find on Twitter @vrapolinario


Recent Comments