
by Scott Muniz | Jul 23, 2020 | Alerts, Microsoft, Technology, Uncategorized
This article is contributed. See the original author and article here.
What a busy week for Azure Services! Microsoft Inspire took place this week and new announcements were shared. Announcements include: The next generation of Azure Stack HCI, Numerous Azure Kubernetes Service announcements, Azure IoT Connector to ingest data from Internet of Medical Things (IoMT) devices and Azure Monitor Logs connector.
The new Azure Stack HCI solution
The new Microsoft Azure Stack HCI provides the best-in-class hyper-converged infrastructure stack, which integrates seamlessly into existing on-premises environments using existing processes and tools. It also is delivered as an Azure hybrid service, which natively integrates into your Azure environment, comes with subscription-based billing, and a dedicated support team. It provides many Azure Hybrid services which can be leveraged to make on-premises environments better. More information regarding the Microsoft Inspire announcement can be found here: The next generation of Azure Stack HCI
Numerous Azure Kubernetes Service Announcements
- AKS-managed Azure Active Directory support is now generally available – Azure Kubernetes Service (AKS)-managed Azure Active Directory (Azure AD) support is now generally available. This simplifies AKS integration with Azure AD. Customers are no longer required to create client apps or service apps or require tenant owners to grant elevated permissions. AKS creates appropriate roles/role bindings with group memberships though delegated permissions to facilitate administration.
- Secure Azure Kubernetes Service (AKS) pods with Azure Policy (in preview) – To improve the security of your Azure Kubernetes Service (AKS) cluster, secure your pods with Azure Policy (in preview). Users can choose from a list of built-in options and apply those policies to secure pods.
- Azure Kubernetes Service (AKS) now supports bring-your-own control plane managed identity – Azure Kubernetes Service (AKS) now supports bring-your-own identities for the control plane managed identity. The Kubernetes cloud provider uses this identity to create resources like Azure Load Balancer, public IP addresses, and others on behalf of the user. Managed identities simplify overall management of authorization, as users don’t have to manage service principals on their own.
Azure IoT Connector for FHIR now in preview
IoT Connector enables a new set of scenarios like remote patient monitoring, telehealth, clinical trials, and smart hospitals by bringing PHI data from devices into Azure API for FHIR, which can be used along with other clinical data to enable newer insights and clinical workflows. It can accept JSON-based messages from IoMT devices, use mapping templates to transform device data into a FHIR standard resource, and finally persist the resource into Azure API for FHIR. Use it seamlessly with Azure IoT Central, Azure IoT Hub, and other IoT cloud gateways.
Azure Monitor Logs connector is now generally available
Create automated workflows using hundreds of actions for a variety of services with Azure Logic Apps and Power Automate. The Azure Monitor logs connector is now generally available and can be used to build workflows that retrieve data from the Azure Monitor Logs workspace or Application Insights component.
MS Learn Module of the Week
Implement hybrid identity with Windows Server
In this module, you’ll learn to configure an Azure environment so that Windows IaaS workloads requiring Active Directory are supported. You’ll also learn to integrate on-premises Active Directory Domain Services (AD DS) environment into Azure.
Let us know in the comments below if there are any news items you would like to see covered in next week show. Az Update streams live every Friday. Be sure to catch the next episode and join us in the live chat.
by Scott Muniz | Jul 23, 2020 | Alerts, Microsoft, Technology, Uncategorized
This article is contributed. See the original author and article here.
Monitoring your database is one of the most crucial tasks to ensure a continued healthy and steady workload. Azure Database for PostgreSQL, our managed database service for Postgres, provides a wealth of metrics to monitor your Postgres database on Azure. But what if the very metric that you are after is not yet available?
Worry not because there are ample options to easily create and monitor custom metrics with Azure Database for PostgreSQL. One solution you can use with Postgres on Azure is Datadog’s custom metrics.
If you are not familiar with Datadog, it is one of many solid 3rd party solutions that provides a set of canned metrics for various technologies, including PostgreSQL. Datadog also enables you to poll our databases with the help of custom queries to emit custom metrics data to a central location where you can monitor how well your workload is doing.
If you don’t yet have a Datadog account, no problem, you can use a free trial Datadog account to try out everything I’m going to show you in this post.
What is bloat in Postgres & why should you monitor it?
As a proud owner of a PostgreSQL database, you will inevitably have to experience and manage bloat, which is a product of PostgreSQL’s storage implementation for multi-version concurrency control. Concurrency is achieved by creating different versions of tuples as they receive modifications. As you can imagine, PostgreSQL will keep as many versions of the same tuple as the number of concurrent transactions at any time and make the last committed version visible to the consecutive transactions. Eventually, this creates dead tuples in pages that later need to be reclaimed.
To keep your database humming, it’s important to understand how your table and index bloat values progress over time—and to make sure that garbage collection happens as aggressively as it should. So you need to monitor your bloat in Postgres and act on it as needed.
Before you start, I should clarify that this post is focused on how to monitor bloat on Azure Database for PostgreSQL – Single Server. On Azure, our Postgres managed database service also has a built-in deployment option called Hyperscale (Citus)—based on the Citus open source extension—and this Hyperscale (Citus) option enables you to scale out Postgres horizontally. Because the code snippets and instructions below are a bit different for monitoring a single Postgres server vs. monitoring a Hyperscale (Citus) server group, I plan to publish the how-to instructions for using custom monitoring metrics on a Hyperscale (Citus) cluster in a separate/future blog post. Stay tuned! Now, let’s get started.
First, prepare your monitoring setup for Azure Database for PostgreSQL – Single Server
If you do not already have an Azure Database for PostgreSQL server, you may create one as prescribed in our quickstart documentation.
Create a read-only monitoring user
As a best practice, you should allocate a read-only user to poll your data from database. Depending on what you want to collect, granting pg_monitor role, which is a member of pg_read_all_settings, pg_read_all_stats and pg_stat_scan_tables starting from Postgres 10, could be sufficient.
For this situation, we will also need to GRANT SELECT for the role to all the tables that we want to track for bloat.
CREATE USER metrics_reader WITH LOGIN NOSUPERUSER NOCREATEDB NOCREATEROLE INHERIT NOREPLICATION CONNECTION LIMIT 1 PASSWORD 'xxxxxx';
GRANT pg_monitor TO metrics_reader;
--Rights granted here as blanket for simplicity.
GRANT SELECT ON ALL TABLES IN SCHEMA public to metrics_reader;
Create your bloat monitoring function
To keep Datadog configuration nice and tidy, let’s first have a function to return the bloat metrics we want to track. Create the function below in the Azure Database for PostgreSQL – Single Server database you would like to track.
If you have multiple databases to track, you can consider an aggregation mechanism from different databases into a single monitoring database to achieve the same objective. This how-to post is designed for a single database, for the sake of simplicity.
The bloat tracking script used here is a popular choice and was created by Greg Sabino Mullane. There are other bloat tracking scripts out there in case you want to research a better fitting approach to track your bloat estimates and adjust your get_bloat function.
CREATE OR REPLACE FUNCTION get_bloat ()
                RETURNS TABLE (
                                database_name NAME,
                                schema_name NAME,
                                table_name NAME,
                                table_bloat NUMERIC,
                                wastedbytes NUMERIC,
                                index_name NAME,
                                index_bloat NUMERIC,
                                wastedibytes DOUBLE PRECISION
)
AS $$
BEGIN
                RETURN QUERY SELECT current_database() as databasename, schemaname, tablename,ROUND((CASE WHEN otta=0 THEN 0.0 ELSE sml.relpages::FLOAT/otta END)::NUMERIC,1) AS tbloat,CASE WHEN relpages < otta THEN 0 ELSE bs*(sml.relpages-otta)::BIGINT END AS wastedbytes,iname, ROUND((CASE WHEN iotta=0 OR ipages=0 THEN 0.0 ELSE ipages::FLOAT/iotta END)::NUMERIC,1) AS ibloat,CASE WHEN ipages < iotta THEN 0 ELSE bs*(ipages-iotta) END AS wastedibytes FROM (SELECT schemaname, tablename, cc.reltuples, cc.relpages, bs,CEIL((cc.reltuples*((datahdr+ma-(CASE WHEN datahdr%ma=0 THEN ma ELSE datahdr%ma END))+nullhdr2+4))/(bs-20::FLOAT)) AS otta,COALESCE(c2.relname,'?') AS iname, COALESCE(c2.reltuples,0) AS ituples, COALESCE(c2.relpages,0) AS ipages,COALESCE(CEIL((c2.reltuples*(datahdr-12))/(bs-20::FLOAT)),0) AS iotta FROM (SELECT ma,bs,schemaname,tablename,(datawidth+(hdr+ma-(CASE WHEN hdr%ma=0 THEN ma ELSE hdr%ma END)))::NUMERIC AS datahdr,(maxfracsum*(nullhdr+ma-(CASE WHEN nullhdr%ma=0 THEN ma ELSE nullhdr%ma END))) AS nullhdr2 FROM (SELECT schemaname, tablename, hdr, ma, bs,SUM((1-null_frac)*avg_width) AS datawidth,MAX(null_frac) AS maxfracsum,hdr+(SELECT 1+COUNT(*)/8 FROM pg_stats s2 WHERE null_frac<>0 AND s2.schemaname = s.schemaname AND s2.tablename = s.tablename) AS nullhdr FROM pg_stats s, (SELECT(SELECT current_setting('block_size')::NUMERIC) AS bs,CASE WHEN SUBSTRING(v,12,3) IN ('8.0','8.1','8.2') THEN 27 ELSE 23 END AS hdr,CASE WHEN v ~ 'mingw32' THEN 8 ELSE 4 END AS ma FROM (SELECT version() AS v) AS foo) AS constants GROUP BY 1,2,3,4,5) AS foo) AS rs JOIN pg_class cc ON cc.relname = rs.tablename JOIN pg_namespace nn ON cc.relnamespace = nn.oid AND nn.nspname = rs.schemaname AND nn.nspname <> 'information_schema' LEFT JOIN pg_index i ON indrelid = cc.oid LEFT JOIN pg_class c2 ON c2.oid = i.indexrelid) AS sml WHERE schemaname NOT IN ('pg_catalog') ORDER BY wastedbytes DESC;
END; $$
LANGUAGE 'plpgsql';
Confirm your read-only Postgres user can observe results
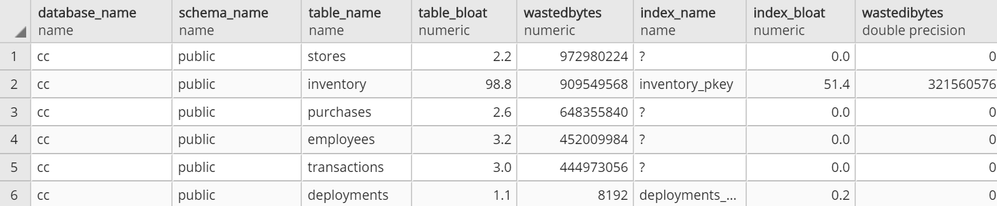
At this point, you should be able to connect to your Azure Database for PostgreSQL server with your read-only user and run SELECT * FROM get_bloat(); to observe results.
 get_bloat function’s sample output
If you don’t get anything in the output, see if the following steps remedy this:
- Check your pg_stat records with
SELECT * FROM pg_stats WHERE schemaname NOT IN ('pg_catalog','information_schema');
- If you don’t see your table and columns in there, make sure to run
ANALYZE <your_table> and try again
- If you still don’t see your table in the result set from #1, your user very likely does not have select privilege on a table that you expect to see in the output
Then, setup your 3rd party monitoring (in this case, with Datadog)
Once you confirm that your read-only user is able to collect the metrics you want to track on your Azure Postgres single server, you are now ready to set up your 3rd party monitoring!
For this you will need two things. First, a Datadog account. Second, a machine that will host your Datadog agent, to do the heavy lifting of connecting to your database to extract the metrics you want and to push the metrics into your Datadog workspace.
For this exercise, I had an Azure Linux virtual machine handy that I could use as the agent host, but you can follow quickstart guides available for Azure Virtual Machines to create a new machine or use an existing one. Datadog provides scripts to set up diverse environments, which you can find after you log in to your Datadog account and go to the Agents section in Datadog’s Postgres Integrations page. Following the instructions, you should get message similar to the following.
 datadog agent setup success state
Next step is to configure datadog agent for Postgres specific collection. If you aren’t already working with an existing postgres.d/conf.yaml, just copy the conf.yaml.example in /etc/datadog-agent/conf.d/postgres.d/ and adjust to your needs.
Once you follow the directions and set up your host, port, user, and password in /etc/datadog-agent/conf.d/postgres.d/conf.yaml, the part that remains is to set up your custom metrics section with below snippet.
custom_queries:
       - metric_prefix: azure.postgres.single_server.custom_metrics
         query: select database_name, schema_name, table_name, table_bloat, wastedbytes, index_name, index_bloat, wastedibytes from get_bloat();
         columns:
           - name: database_name
             type: tag
           - name: schema_name
             type: tag
           - name: table_name
             type: tag
           - name: table_bloat
             type: gauge
           - name: wastedbytes
             type: gauge
           - name: index_name
             type: tag
           - name: index_bloat
             type: gauge
           - name: wastedibytes
             type: gauge
Once this step is done, all you need to do is to restart your datadog-agent sudo systemctl restart datadog-agent for your custom metrics to start flowing in.
Setup your new bloat monitoring dashboard for Azure Database for PostgreSQL – Single Server
If all goes well, you should be able to see your custom metrics in Metrics Explorer shortly!
 azure postgresql custom metrics flowing successfully into datadog workspace
From above you can export these charts to a new or existing dashboard and edit the widgets to your needs to show separate visuals by dimensions as table or index or you can simply overlay them as below. Datadog documentation is quite rich to help you out.
 custom metrics added to a new dashboard
Knowing how your bloat metrics are trending will help you investigate performance problems and help you to identify if bloat is contributing to performance fluctuations. Monitoring bloat in Postgres will also help you evaluate whether your workload (or your Postgres tables) are configured optimally for autovacuum to perform its function.
Using custom metrics makes it easy to monitor bloat in Azure Database for PostgreSQL
You can and absolutely should track bloat. And with custom metrics and Datadog, you can easily track bloat in your workload for an Azure Database for PostgreSQL server. You can track other types of custom Postgres metrics easily in the same fashion.
One more thing to keep in mind: I recommend you always be intentional on what and how to collect, as metric polling can impact your workload.
If you have a much more demanding workload and are using Hyperscale (Citus) to scale out Postgres horizontally, I will soon have a post on how you can monitor bloat with custom metrics in Azure Database for Postgres – Hyperscale (Citus). I look forward to seeing you there!
by Scott Muniz | Jul 23, 2020 | Uncategorized
This article is contributed. See the original author and article here.
Monitor Air Pollution with a Raspberry Pi, a Particulate Matter sensor and IoT Central
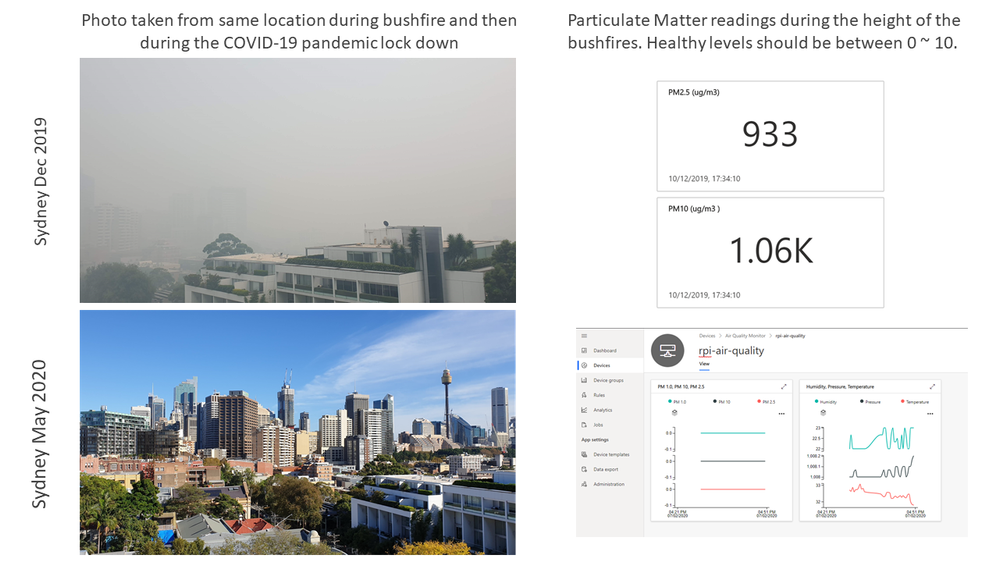
Background
Born of necessity, this project tracks the air quality over Sydney during the height of the Australian bushfires. I wanted to gauge when it was safe to go outside, or when it was better to close up the apartment and stay in for the day.

#JulyOT
This is part of the #JulyOT IoT Tech Community series, a collection of blog posts, hands-on-labs, and videos designed to demonstrate and teach developers how to build projects with Azure Internet of Things (IoT) services. Please also follow #JulyOT on Twitter.
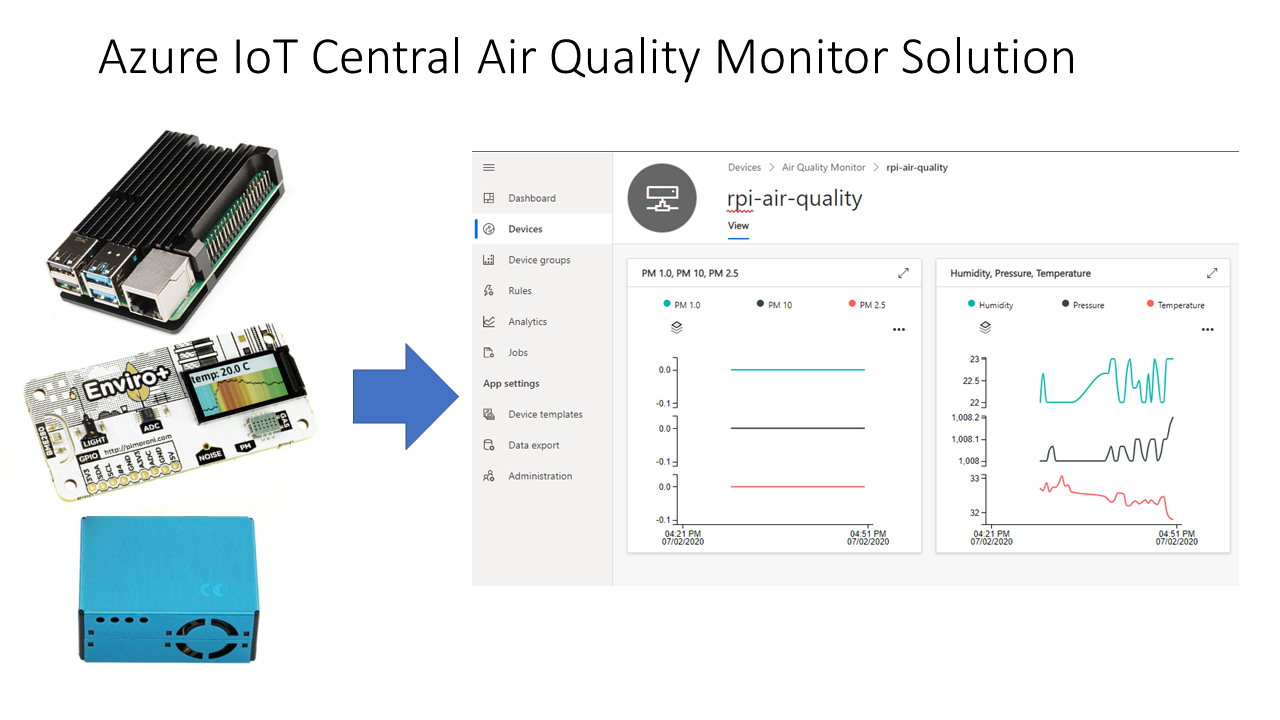
Introduction
In this hands-on lab, you will learn how to create and debug a Python application on a Raspberry Pi with Visual Studio Code and the Remote SSH extension. The app requires the Pimoroni Enviro+ pHAT, and reads data from the PMS5003 particulate matter (PM) and BME280 sensors and streams the data to Azure IoT Central.
Parts required
- Raspberry Pi 2 or better, SD Card, and Raspberry Pi power supply
- Pimoroni Enviro+ pHAT
- PMS5003 Particulate Matter Sensor with Cable available from Pimoroni and eBay.
This lab depends on Visual Studio Code and Remote SSH development. Remote SSH development is supported on Raspberry Pis built on ARMv7 chips or better. The Raspberry Pi Zero is built on ARMv6 architecture. The Raspberry Pi Zero is capable of running the solution, but it does not support Remote SSH development.
Solution Architecture
Let’s get started
Head to Raspberry Pi Air Pollution Monitor
There are five modules covering the following topics:
- Module 1: Create an Azure IoT Central application
- Module 2: Set up your Raspberry Pi
- Module 3: Set up your development environment
- Module 4: Run the solution
- Module 5: Dockerize the Air Quality Monitor solution
Source code
All source code available for the Raspberry Pi Air Pollution monitor
Acknowledgements
This tutorial builds on the Azure IoT Python SDK 2 samples.
Have fun and stay safe and be sure to follow us on #JulyOT.
by Scott Muniz | Jul 23, 2020 | Uncategorized
This article is contributed. See the original author and article here.
Are you looking for ways to fine-tune your model relevance? Sometimes developers create a customized ranking model to re-rank the results returned by Azure Cognitive Search. This allows them to use application-specific context as part of that model. To help facilitate this, Azure Cognitive Search is introducing a new query parameter called featuresMode. When this parameter is set, the response will contain information used to compute the search score of retrieved documents, which can be leveraged to train a re-ranking model using a Machine Learning approach.
We have created a new sample and tutorial that walks you through the learning to rank process end-to-end, with steps for designing, training, testing, and consuming a ranking model. The tutorial shows you how to extract features using the featuresMode parameter and train a ranking model to increase total search relevance as measured by the offline NDCG metric.
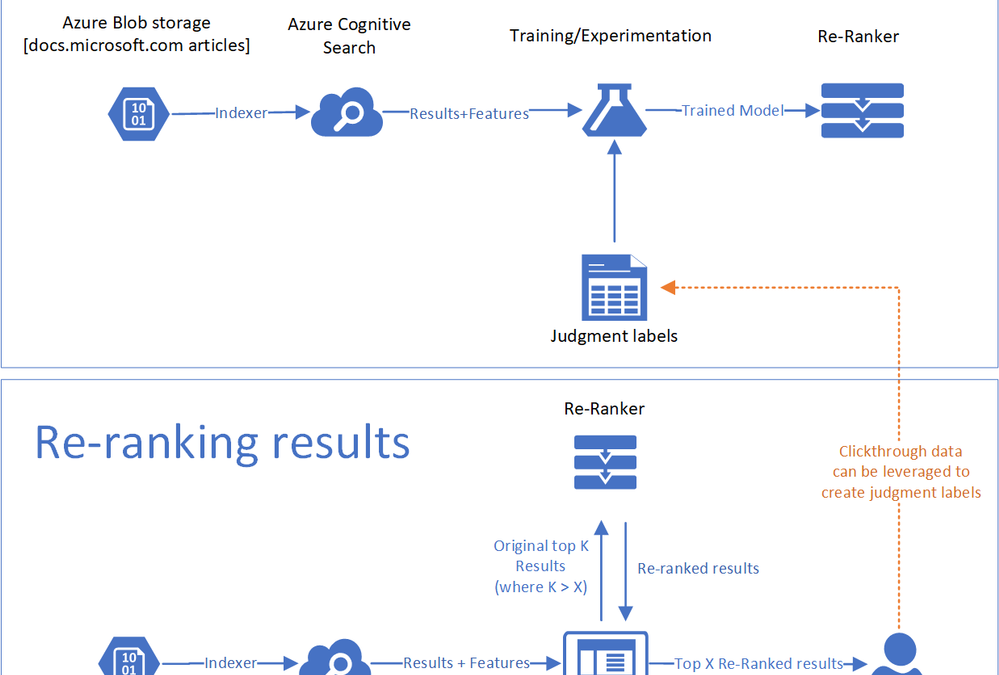
For customers who are less familiar with machine learning, a learn-to-rank method re-ranks top results based on a machine learning model. The re-ranking process can incorporate clickthrough data or domain expertise as a reflection of what is truly relevant to users. The is a visualization of the components of a learn-to-rank method used in the tutorial.

|
Legend
|
Description
|
|
Data
|
The articles and search statistics that reside in Azure Blob storage.
|
|
Search Index
|
Azure Cognitive Search ingests the data into a search index.
|
|
Re-ranker
|
Queries against the index produce scores and scoring features that are used to train a machine learning model based on labels derived from clickthrough data. After the model is trained, you can use it to re-rank your documents.
|
|
Judgement labels
|
To train the machine learning model, you need to have labeled data that contains signal for what documents are most relevant for different queries. One way to do this is to collect clickthrough data to understand which documents are most popular. Another mechanism may be to find human judges to label the most relevant documents.
|
The featuresMode parameter is currently in preview and can be accessed through the Azure Cognitive Search REST APIs.
Sample Request
POST https://[service name].search.windows.net/indexes/[index name]/docs/search?api-version=[api-version]
Content-Type: application/json
api-key: [admin or query key]
Request Body
{
“search”: “.net core”,
“featuresMode”: “enabled”,
“select”: “title_en_us, description_en_us”,
“searchFields”: “body_en_us,description_en_us,title_en_us,apiNames,urlPath,searchTerms, keyPhrases_en_us”,
“scoringStatistics”: “global”
}
Sample Response
{
“value”: [
{
“@search.score”: document_score (if a text query was provided),
“@search.highlights”: {
field_name: [ subset of text, … ],
…
},
“@search.features”: {
“field_name_1”: {
“uniqueTokenMatches”: 1.0,
“similarityScore”: 0.29541412,
“termFrequency”: 2
},
“field_name_2”: {
“uniqueTokenMatches”: 3.0,
“similarityScore”: 1.75345345,
“termFrequency”: 6
},
…
},
…
},
…
]
}
If you are interested in this new capability, contact us at azuresearchrelevance@microsoft.com
References
Search Ranking Tutorial Github
FeaturesMode REST API Reference
by Scott Muniz | Jul 23, 2020 | Uncategorized
This article is contributed. See the original author and article here.
Summer has always been a well-deserved break, but none more so than this year. To all teachers and educators who’ve been supporting our students—thank you. You deserve this chance to recharge. While you might not know if you’ll be teaching in classrooms or adopting a hybrid model, here are some quick ways that Microsoft Edge can help you save time and stay organized for the new school year.
Ready to try these out? Download the new Microsoft Edge and read on.
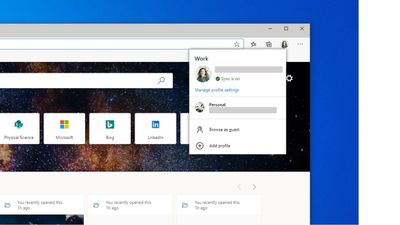
Keep teaching and personal browsing separate by creating your own teacher profile

Crafting a lesson on plants for your students and looking up how to make the perfect sourdough bread are two vastly different activities. Why mix the two in your browser? Keep your tabs, passwords, favorites, and extensions separate by creating a teacher profile for school and a personal profile for the rest of your day-to-day life. That way, you won’t mix (or lose) tabs as you go from exploring photosynthesis to learning how to bake bread.
How to set up profiles:
Step 1: Click the profile icon to the right of the address bar.
Step 2: From the flyout menu, click “add a new profile”.
Step 3: Enter your school email and password.
Step 4: Create a personal profile by repeating the previous steps but with your personal email and password.
Step 5: To switch between profiles, click on the profile icon and select the profile you want to use.
Access your files and lessons faster as you work from the browser

Remote teaching has meant going all-digital and keeping track of that content isn’t easy. In the new Microsoft Edge, you can set up an easy-to-use Office 3651 dashboard so every time you open a new tab you can quickly find the files you need. You can customize this dashboard to pin files and websites you always use, or you can launch an Office 365 app from the app menu. By connecting Office 365 to Microsoft Edge, you get a fast, intelligent way to access your files that will save you time.
How to set up the new tab page:
Step 1: Sign-in to Office 365 using your teacher account and profile.
Step 2: Open a new tab in the browser.
Step 3: Click on the gear icon in the top right corner of the frame (under where you see your profile picture).
Step 4: Select “Office 365” under Page Content.
Step 5: Chose which page layout you like by trying out Focused, Informational, or Inspirational.
Step 6: Explore the page to see what’s available!
Easily build a lesson plan (or collect anything) using Collections

The best lessons use great content but finding and organizing that content can be time-consuming. In the past, this has meant a lot of open tabs and a lot of copying and pasting from the web. With Collections, we hope to make lesson planning a little bit easier! Now you can easily grab the web content that you need and save it in one place without leaving the browser. You can save a link to an entire page or simply highlight pictures or text and drag them into your collection. Now, all your resources are in one, convenient location.
How to use Collections:
Step 1: Click on the  icon next to your profile icon to open the Collections pane.
Step 2: Click the blue + sign to start a new collection.
Step 3: Start adding content! Find a web page with something you want to save and click “Add current page”.
Step 4: Just want something specific on the page? Highlight text or pictures you want and drag it over to the pane to add it to the collection.
Step 5: Save your collection to a Word doc so you can share it with your students by clicking the  menu and then “Send to Word”. Voila!
We hope you found these tips helpful—we truly can’t thank you enough. If you found them useful, share them with your fellow teachers so they can save time and stay organized too!
Want to become even more familiar with the new Microsoft Edge? Check out our How To Get Started User Guide!
1 Azure Active Directory (AAD) and Office 365 subscription required.

Recent Comments