by Scott Muniz | Jun 18, 2020 | Uncategorized
This article is contributed. See the original author and article here.
Organizations are rapidly transforming to meet the needs of a virtual workforce and respond to changing industry conditions. Yammer has been repowered to enable two-way communication between leaders and employees to ensure everyone has the information they need to stay safe, align on priorities and get their work done, together.
We’re excited to share several changes to the All Company experience that give corporate communicators the tools to keep the entire organization informed and engaged, wherever they are.
Reach and engage all of your employees
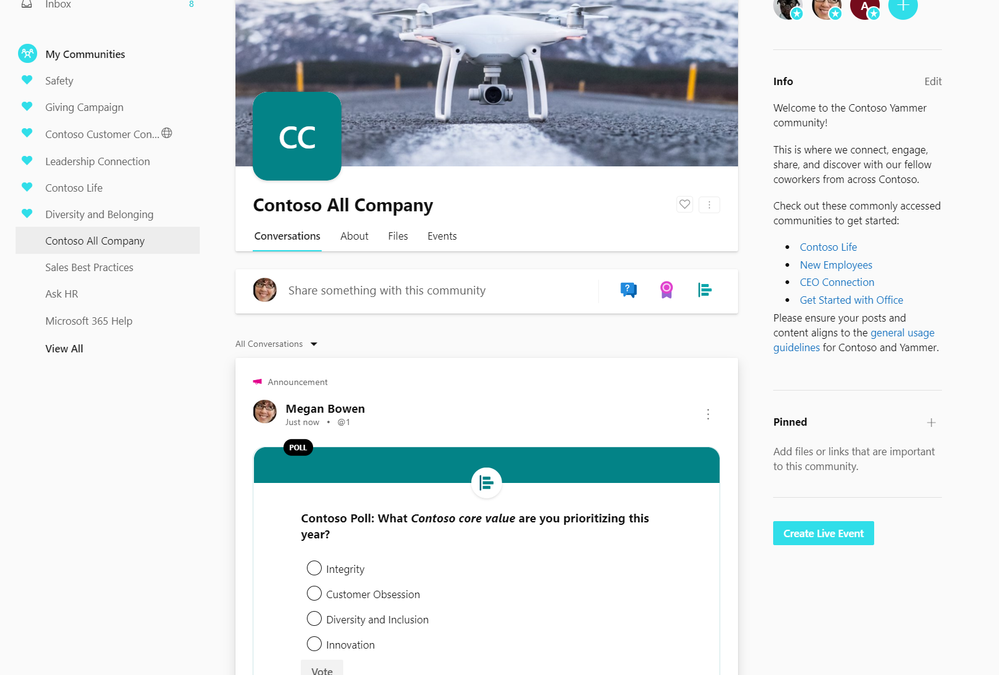
The new composing experience provides new ways for admins to share announcements at scale, including using questions and polls in the All Company community to spark engagement and feedback. Share important news and updates, streamline change management, and get input from employees with notifications that reach them in web, mobile, and in Outlook. Admins can also use the close conversations feature to post read-only announcements.
 Use the All Company to share announcements and gather feedback from the entire organization
Customize your All Company with a unique name, description, and image to create a strong identity for your All Company community. Upload a cover photo to All Company to drive campaigns across your organization or just reinforce your culture and values.

Host townhalls and company meetings in All Company using live events to align the organization and celebrate milestones. If your organization has enforced Office 365 identity in the network admin setting, then your tenant will now have an All Company that is backed by a Microsoft 365 Group, meaning you can host live events and utilize Microsoft 365 resources.

Control and co-curate conversations that take place in All Company by restricting who can post in the community with the new restricting post feature. This will restrict who can start a new conversation in All Company to be only admins of the community, all users can still react and reply to the admin started conversations.
Manage All Company by promoting users as admin. Today the community admins of All Company are network admins, but with these new set of changes you can promote any user in your organization as an admin of All Company. This enables a larger set of users with the ability to post if the restricted post feature is enabled.
 Set admins for the All Company
Looking ahead
The new Yammer is now in public preview. These changes pave the way for All Company to get new community features in the future. We will continue to listen to customer feedback and ideas for how to continue to improve the All Company experience and are investigating some new features in an effort to develop All Company into a true corporate communications channel.
– Tricia Lybrook
Tricia is a PM on the Yammer engineering team
by Scott Muniz | Jun 17, 2020 | Uncategorized
This article is contributed. See the original author and article here.
In an ever-changing climate, we find ourselves working remotely, many organizations were not prepared for such a change. There has been a vast cultural shift, but also a technical shift. IT teams are now almost entirely remote, prior to that many teams did have a remote option, but primarily worked onsite to access their IT systems.
Recent customer projects I have been working on have required the developer and operations teams to innovate remotely in an effort to deploy infrastructure as code and develop their application into Azure. While working alongside these customers, I noticed they were writing all of their code in Notepad++ (I mean everything – Bash, HCL, Go, PowerShell, C#, etc.). Source code repositories are not always used, and development is done locally on each persons’ laptop. Productivity was severely limit because of this and the project itself seemed to take longer than it should.
In introducing VS Code, the customer team was transfixed seeing all the features that enabled us to write code collaboratively. The plethora of extensions and the ability to use things like IntelliSense and LiveShare mase it easier for us to work together. This shift in development enabled the customer team to be productive from any location, share their sessions from their browser, and maintain data residency and compliance approval from the security and operations teams.
To get VS Codespaces setup it’s really quick and easy.
- Browse to https://online.visualstudio.com/login and click the ‘sign in’ button. Sign in with your login (this will be your Azure subscription login).
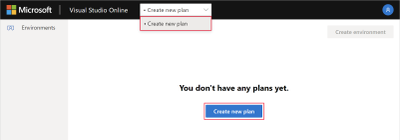
- Create a new Codespaces environment by selecting ‘Create new plan’. You can create a new plan from the blue button or the selector at the top of the page. Once you create a plan, you can create one or more actual codespaces. The plan is effectively your billing plan, where your codespace is an instance (billing is down to each codespace and its usage).

- Select the subscription and location where you would like to run your plan from. It is suggested that you choose the region that is geographically closest to you (or where your organization is permitted to deploy its resources into). Select ‘Advanced Options’ and give your plan a name, as well as assigning it its own resource group.

- Once the plan is created, you can create your Codespace by selecting the blue box, ‘Create Codespace’. Name your Codespace, you also have the option to add in the link for your Git repository here. This is where you’ll choose your ‘Instance Type’, you will have various size and performance options, varying in OS, RAM and CPU. Choose the performance that best suits your needs. Choose ‘Suspend Idle Codespace after..’, this will allow you to suspend an inactive session so that you are not getting billed for the Codespace being online and using compute. Once you’ve chosen your configuration, select ‘Create’
Note: You can choose a smaller instance and scale up when you need to, saving you spend on your Codespace

- Viola! Your Codespace will initialize and will be up and running in a matter of seconds.
- Customize your Codespace, add in extensions, and code away!

It is really that easy and quick to get a development environment up and running! Take the time to customize the environment to suit your needs, it will make developing on a cloud-hosted environment feel much more natural. You can bring your collection of dotfiles and synchronize your Git identity, themes and settings so that every environment you create is setup to what you like. You can also tailor Visual Studio Codespaces by bringing your own Dockerfile or images, making it a seamless and completely personal setup for the developer. Visit here to further learn about the latest features Visual Studio Codespaces has to offer.
by Scott Muniz | Jun 17, 2020 | Uncategorized
This article is contributed. See the original author and article here.
Az Update is coming to you a little earlier this week. This week’s news includes: New Azure Arc features, Azure Migrate updates, new memory-optimized Azure Virtual Machines, Update Baseline for Windows 10 and more. Be sure to tune in to our live stream today. Details for all news items can be found below.
The Az Update Show (Livestream)
Season 1 Episode 9:
Microsoft announces Azure Arc Server Extension Management
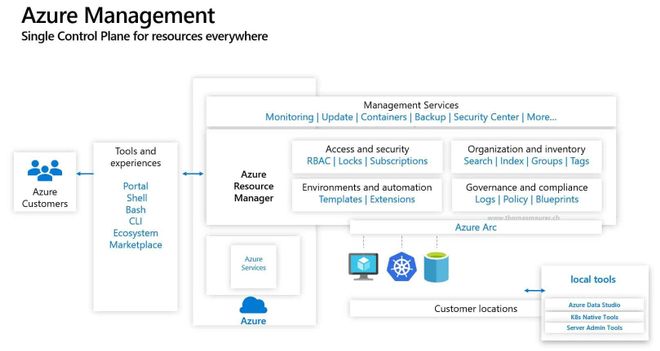
Azure Arc, designed to extend Azure Management to any infrastructure, will receives server extension management functionality as announced by Microsoft today. The new Azure Arc enabled server extension management features allows to deploy extensions like the Custom Script Extension, or the Microsoft Monitoring Agent and can enable features like Azure Update Management, Inventory, Change Tracking, and more for servers running in a hybrid environment.

New ways to assess imported servers via Azure Migrate
Azure Migrate now supports the assessment of servers imported using a CSV file no longer requiring the need to deploy an appliance. This comes in handy if you are looking for a quick assessment using configuration-management database (CMDB) inventory or are waiting for approvals to deploy the Azure Migrate appliance. Performance-based assessments can be run as well by specifying utilization values in the CSV. Further details surrounding the new Azure Migrate assessment capability can be found here.
New general purpose and memory-optimized Azure Virtual Machines with Intel now available
Microsoft announces the availability of new general purpose and memory-optimized Azure Virtual Machines based on the 2nd generation Intel Xeon Platinum 8272CL (Cascade Lake). This custom processor runs at a base speed of 2.5GHz and can achieve all-core turbo frequency of 3.4GHz. It features Intel® Deep Learning Boost Technology, Intel® Advanced Vector Extensions 512 (Intel® AVX-512), Intel® Turbo Boost Technology 2.0, and Intel® Hyper-Threading Technology.
Update Baseline for Windows 10 now available
Similar to Windows security baselines, the Update Baseline for Windows 10 offers recommended configuration settings plus guidance on customizing those settings to meet an organization’s unique needs. And, like the Windows security baselines, you can get to an optimized approach that’s right for you with just a few clicks. The Update Baseline for Windows 10 includes recommended policy settings across a number of areas, including: Configuring deadlines, Restart behavior, Accounting for low activity devices, Delivery optimization, Power policies and others. Download the Update Baseline for Windows 10 to start evaluating the proposed baselines.
MS Learn Module of the Week

Architect network infrastructure in Azure
This week’s module shares details on how to architect a secure, flexible, network infrastructure in Azure and connect on-premises networks to Azure resources.
Be sure to visit the Azure announcements blog for daily updates on all new announcements.
by Scott Muniz | Jun 17, 2020 | Uncategorized
This article is contributed. See the original author and article here.
Hello everyone, we are starting a new video tutorial series focusing on Application Deployment in Configuration Manager. This series is recorded by @Steve Rachui, a Microsoft principal premier field engineer. These tutorials are from our library and uses Configuration Manager 2012 in the demos, however the concepts are still relevant for Configuration Manager current branch.
The first session is an introduction and reviews concepts and infrastructure components key to understanding application deployment. It includes a discussion of boundaries, boundary group, roaming, distribution points, distribution point groups and more. This session is the groundwork for the remainder of the series.
Next in the series Steve focuses specifically on creating and deploying packages.
Posts in the series
- Introduction
- Packages
- Applications
- Client Experience Part 1
- Client Experience Part 2
- Packages Behind the Scenes
- Applications Behind the Scenes
- Distribution Points Behind the Scenes
- Clients and Packages Behind the Scenes
- Clients and Applications Behind the Scenes
- Task Sequences
- App-V overview
- App-V 5.0 Sequencer
- App-V 5.0 Client
Go straight to the playlist
by Scott Muniz | Jun 17, 2020 | Uncategorized
This article is contributed. See the original author and article here.
This is the second post of a series dedicated to the implementation of automated Continuous Optimization with Azure Advisor Cost recommendations. For a contextualization of the solution described in this and following posts, please read the introductory post.
Introduction
As we saw in the previous post, if we want to build higher confidence on Azure Advisor right-size recommendations and better inform decisions, we need to combine Advisor recommendations with additional data coming from other sources:
- First, we need Virtual Machines performance metrics to give visibility about why Advisor is recommending a downsize or shutdown. We need at least the last 7 days of aggregated metrics. There are many ways of collecting performance metrics for VMs in Azure – Azure Monitor platform metrics, Azure Log Analytics or Azure Diagnostics guest agent, or even a third-party monitoring solution. As we want to combine all data together into a single repository, using the Azure Log Analytics agent is the simplest approach, as performance metrics will automatically land where they will later be queried from. Of course, if you do not (or don’t want to) monitor your VMs with the Log Analytics agent, you can still ingest into Log Analytics the performance metrics aggregates coming from your favorite source. This series will only cover the Log Analytics agent scenario, though.
- To validate whether a SKU recommended by Advisor can actually be used for a specific VM, we must check how many data disks and network interfaces are being used, as all SKUs have limits regarding these resources. The quickest and simplest way to get that information is to query Azure Resource Graph (ARG) for all our VMs.
- Finally, if we want to validate if the current disk IOPS and throughput profile are supported in the recommended SKU, we must collect data about all VM disks, namely disk type (OS vs. data) and host caching options. Again, we will call ARG to the rescue! And having disks data, we can easily get an extra recommendation not yet supported by Advisor – guess what (more details in the next post :smiling_face_with_smiling_eyes:)!
Now let’s look at each of these data sources in detail and start building our Azure Optimization Engine pipeline.
Collecting Virtual Machine performance metrics
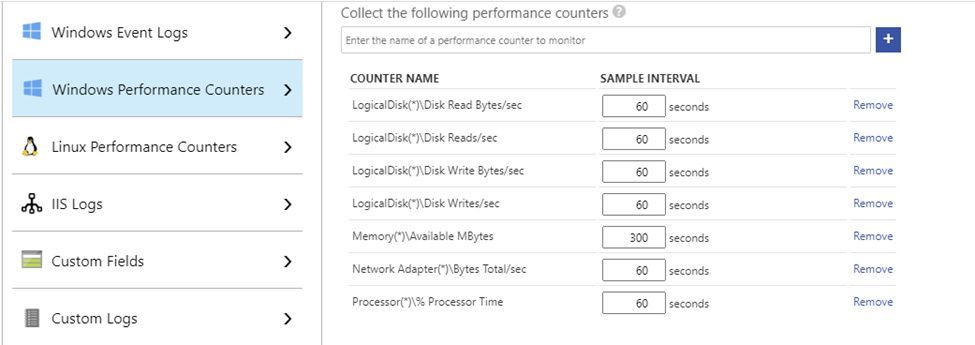
I am not going into the details of configuring the Log Analytics agent in your Azure Virtual Machines, as you have very good guidance in the official documentation. For collecting performance metrics with the Log Analytics agent, you have two options: the VM Insights solution and the agent native Perf solution. This series covers the latter option, as it provides more control over the metrics and collection intervals and we also want to optimize Azure consumption in the optimization tool itself ;) So, besides having all your VMs onboarded to Log Analytics, go to the Advanced Settings > Data blade and configure at least the following counters (if you already had your VMs being monitored by Log Analytics, then you just need to check if all needed counters are there):
- Windows
- LogicalDisk(*)Disk Read Bytes/sec
- LogicalDisk(*)Disk Reads/sec
- LogicalDisk(*)Disk Write Bytes/sec
- LogicalDisk(*)Disk Writes/sec
- Memory(*)Available MBytes
- Network Adapter(*)Bytes Total/sec
- Processor(*)% Processor Time
- Linux
- LogicalDisk(*)Disk Read Bytes/sec
- LogicalDisk(*)Disk Reads/sec
- LogicalDisk(*)Disk Write Bytes/sec
- LogicalDisk(*)Disk Writes/sec
- Memory(*)Available MBytes Memory
- Network(*)Total Bytes
- Processor(*)% Processor Time
Disk counters need to be separated in both read and write dimensions, because of the impact of read/write host caching definitions – when looking at disk performance, we must consider cached vs. non-cached virtual machine disk throughput/IOPS limits. For the same reason, we need to collect metrics for all disk instances, because host caching is defined per disk. Network throughput is collected as totals, because network bandwidth limits are independent of network adapter or direction. Processor metrics are collected for all CPU instances, because overall percentages can be misleading (e.g., 50% total CPU usage may be a result of 100% usage in 1 core and 0% in another). Each performance counter instance collected at a 60 second interval consumes about 430 KB per computer per day in Log Analytics. In a scenario with 4 logical disks and 4 CPU cores, each computer would generate 27 performance counter instances (20 for logical disk, 1 for memory, 1 for network adapter and 5 for processor). If all performance counters were collected at the same 60 seconds frequency, each computer would generate ~11 MB of data per day. Of course, you can adjust the collection interval for some counters, if you want your solution to be costs-savvy (see example below).

Collecting Virtual Machine and Managed Disks properties
Collecting VM and disks properties with ARG is super easy. The VM queries are straightforward and self-explanatory:
resources
| where type =~ ‘Microsoft.Compute/virtualMachines’
| extend dataDiskCount = array_length(properties.storageProfile.dataDisks), nicCount = array_length(properties.networkProfile.networkInterfaces)
| order by id asc
… for ARM VMs and …
resources
| where type =~ ‘Microsoft.ClassicCompute/virtualMachines’
| extend dataDiskCount = iif(isnotnull(properties.storageProfile.dataDisks), array_length(properties.storageProfile.dataDisks), 0), nicCount = iif(isnotnull(properties.networkProfile.virtualNetwork.networkInterfaces), array_length(properties.networkProfile.virtualNetwork.networkInterfaces) + 1, 1)
| order by id asc
… for Classic VMs.
For Managed Disks, the query is more complicated, because we want to distinguish between OS and Data disks:
resources
| where type =~ ‘Microsoft.Compute/disks’
| extend DiskId = tolower(id), OwnerVmId = tolower(managedBy)
| join kind=leftouter (
resources
| where type =~ ‘Microsoft.Compute/virtualMachines’ and array_length(properties.storageProfile.dataDisks) > 0
| extend OwnerVmId = tolower(id)
| mv-expand DataDisks = properties.storageProfile.dataDisks
| extend DiskId = tolower(DataDisks.managedDisk.id), diskCaching = tostring(DataDisks.caching), diskType = ‘Data’
| project DiskId, OwnerVmId, diskCaching, diskType
| union (
resources
| where type =~ ‘Microsoft.Compute/virtualMachines’
| extend OwnerVmId = tolower(id)
| extend DiskId = tolower(properties.storageProfile.osDisk.managedDisk.id), diskCaching = tostring(properties.storageProfile.osDisk.caching), diskType = ‘OS’
| project DiskId, OwnerVmId, diskCaching, diskType
)
) on OwnerVmId, DiskId
| project-away OwnerVmId, DiskId, OwnerVmId1, DiskId1
| order by id asc
No support for Classic VM disks, though, as they are unmanaged resources lying as a page blob in some Azure Storage container. Contributors are welcome!
For larger environments, we’ll need to implement pagination as ARG only returns the first 1000 rows for each query (the ARG runbooks scripts below will show you how).
Deploying the Azure Optimization Engine (data collection)
Now that we have some ground about the data we need to collect, we can finally start deploying the Azure Optimization Engine (AOE) solution! We are just looking at data collection for the moment – no augmented recommendations yet – but we will deploy here all the necessary foundations for the complete solution to be presented in the upcoming posts. In the links below, you’ll be directed to the AOE repository, where you’ll find sooner or later the complete working solution.
The AOE solution is made of the following building blocks:
- ARM template deploying Azure Automation account, runbooks and all required automation assets, Storage Account, SQL Database and, if needed, Log Analytics workspace. You can choose to reuse an existing Log Analytics workspace in case you were already monitoring your VMs before.
- Export-AdvisorCostRecommendationsToBlobStorage runbook – collects from Advisor API the most recent Cost recommendations and dumps them as CSV into a blob container.
- Export-ARGVirtualMachinesPropertiesToBlobStorage runbook – collects from ARG the whole list of VMs and respective properties and dumps them as CSV into a different blob container.
- Export-ARGManagedDisksPropertiesToBlobStorage runbook – collects from ARG the whole list of Managed Disks and respective properties and dumps them as CSV into a different blob container.
- Ingest-OptimizationCSVExportsToLogAnalytics runbook – scans a blob container and ingests all the unprocessed CSV blobs into a custom Log Analytics table (content type specific). To keep track of the CSV and number of CSV lines already processed, this runbook depends on a SQL Database, where it also gets details about the custom Log Analytics table corresponding to each CSV type.
- Deploy-AzureAutomationEngine.ps1 – full deployment script which kicks off the ARM template deployment and sets up the SQL Database at the end.
So, to deploy the AOE, you just need to run the Deploy-AzureAutomationEngine script in an elevated prompt and authenticating to Azure with a user account having Owner permissions over the chosen subscription and enough privileges to register Azure AD applications (see details). You’ll be asked several details about your deployment options, including whether you want to reuse an existing Log Analytics workspace or start with a new one.
The deployment will take some minutes to complete and you’ll be then be asked to enter a password for the Run As certificate for the Automation account. A couple of minutes more and the script will hopefully terminate successfully. In the event of an error, you can re-deploy with the same parameters, as the process is idempotent. You can check the Automation Account schedules created by the deployment (see picture below), which will trigger in a matter of a 1-2-hour timeframe.

Some minutes after all the ingestion runbooks run, you’ll be able to query in Log Analytics for those tables. We’ll make use of these records to generate our recommendations.

Once successfully deployed, and assuming you have your VMs onboarded to Log Analytics and collecting all the required performance counters, we have everything that is needed to start augmenting Advisor recommendations and even generate custom ones! Let it boil for some weeks and keep tuned – in the next post, we’re discussing how AOE produces the actual recommendations and we’ll going to finally see some light! 

Recent Comments