by Scott Muniz | Jun 18, 2020 | Uncategorized
This article is contributed. See the original author and article here.
Azure Synapse Analytics is a big data analytics service that enables you to analyze data on Azure storage using SQL language. You can use SQL endpoints (provisioned and serverless) to analyze your data using SQL language.
SQL is very powerful analytic language that can be used to implement various types of time series analysis on big data. In this article, you will see how to use some slightly advanced or not well known SQL language concepts to analyze COVID cases using Synapse SQL serverless endpoint and Azure Open Dataset.
Prerequisite
To try this sample, you need to have Azure Synapse Analytics workspace. If you don’t have one you can easily deploy it using Azure portal or this Deployment template. Synapse workspace automatically deploys one serverless Synapse SQL endpoint that is everything we need for this kind of analysis. With the workspace you are also getting easy-to-use web UI called Synapse Studio that enables you to start analyzing files in your browser.
NOTE: You need Synapse SQL serverless (on-demand) query endpoint to execute the code in this article. The functionalities used in this article are still not available in provisioned endpoint.
COVID dataset
In this sample is used the latest available public data on COVID-19 cases worldwide from the European Center for Disease Prevention and Control (ECDC). Each row/entry contains the number of new cases reported per day and per country. For more information about this dataset, see here. Dataset is updated on daily basis and placed as a part of Azure Open Dataset.
OPENROWSET function
Synapse SQL endpoint in Synapse Analytics enables you to use OPENROWSET T-SQL function to analyze data on Azure Data Lake storage. This is easy to use function where you need to provide URL of some publicly available file on Azure storage and you will get the content of the file. Example of OPENROWSET function that reads the content of a parquet file placed on Azure storage is shown in the following example:
select *
from openrowset(bulk 'https://****.blob.core.windows.net/.../cases.parquet',
                format='parquet') as cases
If you provide a file URL (for example https://pandemicdatalake.blob.core.windows.net/public/curated/covid-19/ecdc_cases/latest/ecdc_cases….) after the BULK keyword and specify that you are using parquet format, you will get the content of file.
This file is publicly available, so you don’t need some credential to read the content of the file. If the file is protected using Azure AD authentication or SAS token, follow the instructions in this article to setup permissions.
Analyzing COVID dataset
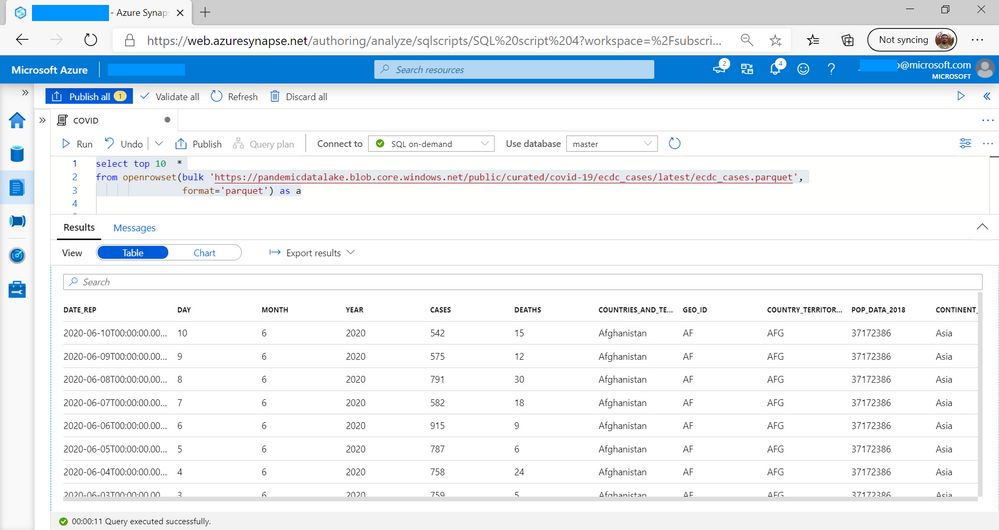
Probably the easiest tool that you can use to analyze the file is Synapse Studio – Web UI where you can write a T-SQL query and see the results in browser.
We can begin analysis by exploring the columns in data set on first 10 records:

Here I can see that some of the columns interesting for analysis are DATE_REP and CASES.
Synapse SQL provides powerful SQL query language where we can do any type of reporting on data set using standard where, group by, having, and order by SQL query option. As an example, the following report shows the number of cases per continents.

With rollup option is handy option that instructs Synapse SQL to automatically return sub-totals for each aggregated column, so you don’t need to calculate this on the client side. I can work with multiple categories (for example if you group by continent and country).
Now let’s see how we can analyze COVID data with SQL.
Displaying time series data
I would like to analyze number of cases reported in Serbia, so I would need to filter the results using GEO_ID column. Once I filter data and sort them by date reported, I can easily show number of daily reported cases as a chart in Synapse Studio:

Synapse Studio enables me to easily select few columns and display them on chart to do some easy data exploration.
Analyze cumulative data (running totals)
Analysis of the previous figure shows the daily cases, but we might want to see cumulative cases over time. Therefore, we would need to sum all cases up to current data and repeat this for every day. Fortunately, SQL has window aggregate function that can do this analysis:
CUMULATIVE = SUM(CASES) OVER (ORDER BY date_rep)
OVER clause instructs Synapse SQL to calculate sum on a window of rows relative to the current rows and sum all values ordered by date_rep. The result of the previous query with this window aggregate option are shown in the following figure:

Cumulative values are showing sum of cases up to the DATE_REP time. We can easily show these values on the chart in Synapse Studio:

Calculating daily changes
SQL language provides two useful window functions LAG and LEAD that enable us to fetch some value from one of the previous or next rows and compare them with the value in current row. As an example, let’s assume that we want to find daily over day changes in the number of reported cases in Serbia. Using the following formula (tomorrow_cases – today_cases)/today_cases, or simplified tomorrow_cases/today_cases -1. We can use the following functions to get the values from the surrounding rows:
LEAD(CASES) OVER (ORDER BY date_rep)
LAG(CASES) OVER (ORDER BY date_rep)
In the OVER clause we need to specify sort order of the rows so these functions can know what criterion to use to find the previous row. By default, they find 1 previous or next row, but this can be changed by adding parameter in LAG/LEAD functions.
I will use these functions to find DoD change in Serbia based on formula above:

I have removed days with number of cases less than 50 to avoid noise because DoD rates have high peaks and variations in these days due to small denominators and big day-to-day variations.
Conclusion
SQL language enables you to do powerful analytics over data stored on your Azure Data Lake. In this examples you have seen how to use Synapse SQL endpoint in Azure Synapse Analytics to perform some advanced analytics on your COVID data.

by Scott Muniz | Jun 18, 2020 | Uncategorized
This article is contributed. See the original author and article here.
|
Microsoft partners like CadDo, INSTANDA, and Sepio Systems deliver transact-capable offers, which allow you to purchase directly from Azure Marketplace. Learn about these offers below:
 |
CadDo ESG: The CadDo platform provides an investment-grade index score of environmental, social, and governance (ESG) factors to guide the financial services industry. Everything from institutional holdings by portfolio to individual investor positions can be dynamically managed and modeled by entity investment value on a real-time basis for ESG and financial performance.
|
 |
INSTANDA: INSTANDA is a responsive, low-risk, and no-code insurance product design and distribution platform. Insurers, managing general agents, and brokers worldwide use it to launch products and change existing books without having to write a single line of code. Complete with full underwriting capabilities, all classes of insurance are covered.
|
 |
SepioPrime: SepioPrime, a rogue device mitigation solution from Sepio Systems, protects organizations from hardware-based threats. Using a combination of physical fingerprinting technology and device behavior analytics, SepioPrime offers instant detection and response to any threat or breach attempt coming from a manipulated or infected element.
|
|
by Scott Muniz | Jun 18, 2020 | Uncategorized
This article is contributed. See the original author and article here.
Every spring I attend the Women in Cloud Summit which is hosted on Microsoft’s Redmond campus. The Summit brings together entrepreneurs and other members of the community to connect small business owners to people that can help. Listening to the stories this year inspired my team and I to recommend Azure Active Directory (Azure AD) as an opportunity for women entrepreneurs to reach an enterprise audience. When a solution is integrated with Azure AD, entrepreneurs can promote them in the Azure AD App Gallery. This makes it easy for enterprises to find and adopt Azure AD-enabled solutions.
“What makes Women in Cloud powerful is our community. By sharing our stories, we inspire innovation. By banding together, we change laws. By leveraging our personal networks, we create new opportunities. It is through collective action that we will help women entrepreneurs access $1 billion in economic access by 2030.” –Chaitra Vedullapalli, President, Women in Cloud
Women in Cloud is an independent, community-led economic development organization that aims to help women entrepreneurs create $1 billion in economic access and opportunity by 2030. Core to its strategy is a focus on helping women sell their solutions to enterprises. Small businesses that sell solutions to large companies can build momentum faster because enterprises provide a steadier revenue stream and bigger contracts. But selling to enterprises isn’t easy. Microsoft recognized that we could play a role in this mission, which is why we invested in the Women in Cloud Microsoft Cloud Accelerator. Together, Women in Cloud and the accelerator help female-led small business access the right people and knowledge to make inroads in large companies.
Enabling digital transformation in fashion and décor
Stylyze is a great example of a Women in Cloud member. Before they founded Stylyze, Kristen Miller, Stylyze CEO, ran a home improvement and décor business, while Lisa Perrone, Chief Creative Officer at Stylyze, was an interior design architect. Through first-hand experience, they knew that fashion and home décor retailers have struggled to translate the personal touch of a knowledgeable designer or stylist to digital. This results in lost revenue.
“No matter how big or small the company, everyone we spoke to said they didn’t know how to scale customer service with digital.” —Kirsten Miller, CEO, Stylyze
Kristen and Lisa believed they could use cloud technology and machine learning to give retail sales staff the tools to virtually curate fashion and décor styles based on a customer’s aesthetic. They raised money and brought on Sophie Huang, Stylyze Chief Technology Officer to help them build the first merchandising-as-a-service platform for the home and fashion verticals.
Leveraging partnerships to grow sales
Stylyze had a viable enterprise solution, but the problem for many entrepreneurs is that great ideas aren’t enough. The executive team didn’t have a lot of experience selling software-as-a-service apps to large companies. Procurement processes at enterprises are complex. It can take hours of precious time navigating the layers of decision makers.
Kristen joined Women in Cloud and applied for the Women in Cloud Microsoft Cloud Accelerator (WiC: MCA) to get support for her business. The accelerator is a six-month immersion program that helps women entrepreneurs start and build their businesses through Microsoft and its cloud partners and channels. Since its inception, 22 companies have graduated with 25 enterprise-ready solutions. Thanks to a Microsoft sponsorship, the program will soon scale to eight countries: Canada, United Kingdom, France, Germany, India, Africa, United States, and UAE. In March WiC: MCA welcomed Cohort 3.0. I’m looking forward to seeing how this group benefits from access to the right technology, capital, and people.
“We hadn’t considered selling through a partner before we got involved in the program. It created a great opportunity for us to use Microsoft’s horsepower to access other go-to-market channels.” —Kirsten Miller, CEO, Stylyze
As members of Cohort 1.0, Stylyze realized immediate benefit. The founders learned how to package deals for an enterprise audience. They discovered how a paid proof of concept can accelerate the sales process. Most importantly they learned that partnering with a company like Microsoft builds credibility for their brand and expands their reach.
Accessing support through community
Beyond the connections and access that Women in Cloud provides, entrepreneurs get real value from talking to people with similar experiences. The Stylyze executive team is accustomed to working with a lot of men, but they couldn’t help but notice that when they met with potential clients or investors, they were frequently the only women in a room of 10-20 people. The Women in Cloud network is a great reminder that women belong in technology leadership. As Women in Cloud has moved its programming online in response to the COVID-19 outbreak, entrepreneurs like Kristen can lean on her connections.
“The Women in Cloud community and my cohort look out for each other. It’s helped me feel less isolated during this time of social distancing.” —Kirsten Miller, CEO, Stylyze
Stylyze’s hard work has paid off. Large brands have deployed the Stylyze app to elevate the sales experience for customers. The pandemic has hit retail hard, but at least one customer has used the Stylyze merchandising-as-a-platform solution to maintain over four thousand members of its sales staff. These employees continue to make an income, remotely, by helping customers find complete looks that match their personal style.
Learn more
If you’re interested in building more power for women in technology, I encourage you to get involved in Women in Cloud. The next cohort for the Cloud Accelerator will launch August 26. Applications are open.
Read how Azure AD integration can accelerate adoption of your app.
by Scott Muniz | Jun 18, 2020 | Uncategorized
This article is contributed. See the original author and article here.
School closures during COVID-19 led to a movement from classroom to online education, utilizing Microsoft Teams for Education as a platform to manage school learning activities. In this situation, teachers needed the capability to take attendance within Teams.
The Attendance app on Teams for Education allows teachers to take student attendance and generate simple attendance reports to answer frequent class attendance related questions. This app resides within the Teams environment, allowing teachers to manage attendance without needing to move to another tool.
Built using Power Apps within Teams, the attendance reports are generated using Power Automate. Raw data for attendance is available on SharePoint lists and can be easily surfaced by reporting and data visualization tools such as Power BI.
This simple-to-use app is available on GitHub and can be extended/customized to meet a school’s changing needs.
The key features of the app are:
- Teachers can take and save the attendance of students.
- The list of students in a class is auto populated from Office 365 groups.
- Teachers can edit attendance for up to 30 days into the past.
- Teachers can generate class attendance reports and obtain the percentage of classes that a student has or has not attended.
- Teachers can generate student specific attendance reports to get the dates that a student was present or absent for a class.
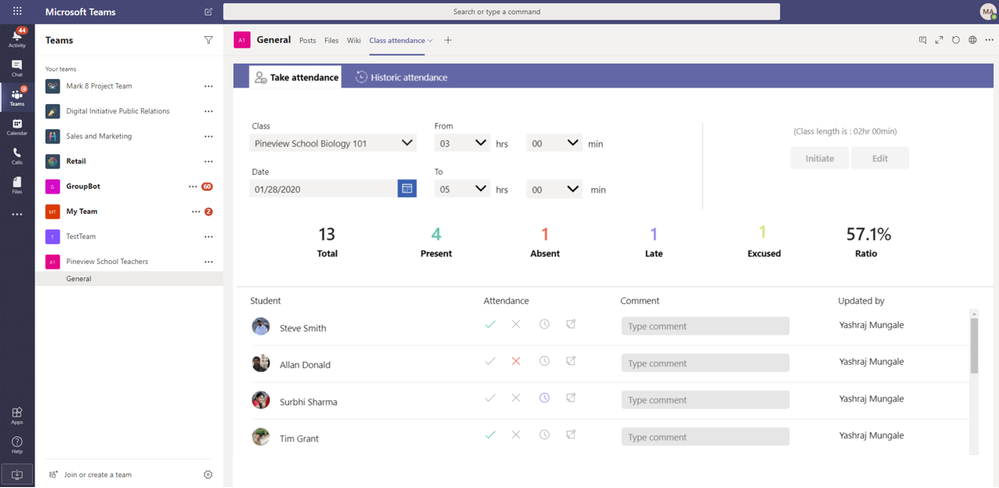
Take Attendance tab allows teachers to take student attendance.

This screen comprises of three sections:
- Input fields: where the teacher selects a class, enters the start and end times, and initiates a class by loading the list of students (automatically pulled through Office 365 groups).
- Summarized metrics: shows the high-level metrics of the class for ready reference, such as total number of students, number of students present, absent, etc.
- Student list: where the teacher marks attendance.
The Historic Attendance tab allows teachers to generate simple attendance reports for a class of student for a desired date range. This helps answer simple questions such as the number of classes or percentage of classes attended by a student, the list of dates that a student was absent for a specific class, etc.

This screen comprises of three sections:
- Input fields: where the teacher selects the class and the desired date range for the report.
- Summarized metrics: shows the high-level metrics of the class for ready reference, such as total classes held.
- Report: provides the number of classes where the student was present, absent, late, excused, and the percentage of classes attended by the student, and are exported to OneDrive.
The steps to install this app are as follows. Detailed step-by-step instructions with screenshots are also available on GitHub.
- Create a team with staff members and make this group a security enabled group to enable sharing the app to any member added to the staff team.
- Create a SharePoint list, which has been automated using Power Automate.
- Install Attendance Power Apps and Power Automate zip, and create SharePoint, Office 365 and OneDrive connections.
- Add Power App to Teams and get started.
The Attendance app uses the following connectors:
- SharePoint to save and read data from a SharePoint list.
- Power Automate to process student records from the SharePoint list and export the CSV file to OneDrive.
- Office 365 Groups to read group member list.
- Office 365 Users to read user profile information.
- OneDrive to place export file information.
by Scott Muniz | Jun 18, 2020 | Uncategorized
This article is contributed. See the original author and article here.
The Azure Sentinel Ninja training is not static and always updated. If you want to refresh your knowledge and get updated, here is the list of updates for you:
Module 2: How is Azure Sentinel used?
Module 3: Cloud architecture and multi-workspace/tenant support
Module 6: Threat Intelligence
Connect ThreatConnect TIP with Azure Sentinel
Module 7: KQL
The Azure Sentinel KQL Lab – an interactive lab teaching KQL focusing on what you need for Azure Sentinel: Youtube, MP4, Slides, Lab URL
Module 8: Write rules
Approximate, partial and combined lookups
Module 11: Use cases
Use cases focus: working from home.
Module 13: Hunting
Threat Hunting – AWS using Sentinel (MP4, YouTube, Presentation).
Module 14: Extending and integrating Azure Sentinel
Using the Sentinel API to view data in a Workbook
Module 15: Roadmap
We have a new exciting roadmap! Since roadmap information is provided under NDA, reach out to your Microsoft account team to discuss an Azure Sentinel roadmap presentation.

Recent Comments