This article is contributed. See the original author and article here.
Azure Synapse Analytics is a limitless data analytics service that enables you to analyze data on Azure Data Lake storage. It provides managed Apache Spark and T-SQL engines (provisioned and serverless) for analyzing data.
In this article, you will see how you can find the countries with highest weekly increase of COVID cases by analyzing data from the parquet files stored on Azure storage using Synapse SQL endpoint in Synapse Analytics. Synapse SQL engine is the perfect choice for ad-hoc data analytics for the data analysts with T-SQL skills.
Prerequisite
To try this sample, you need to have Azure Synapse Analytics workspace. If you don’t have one you can easily deploy it using Azure portal or this Deployment template. Workspace automatically deploys one serverless Synapse SQL endpoint that is everything we need for this kind of analysis. With the workspace you are also getting easy-to-use Web UI called Synapse Studio that enables you to start analyzing the files directly from your browser.
NOTE: You need Synapse SQL serverless (on-demand) query endpoint to execute the code in this article. The functionalities used in this article are still not available in provisioned endpoint.
COVID data set
In this sample is used the latest available public data on geographic distribution of COVID-19 cases worldwide from the European Center for Disease Prevention and Control (ECDC). Each row/entry contains the number of new cases reported per day and per country. For more information about this dataset, see here. Data set is updated on daily basis and placed as a part of Azure Open Dataset.
Data exploration with OPENROWSET function
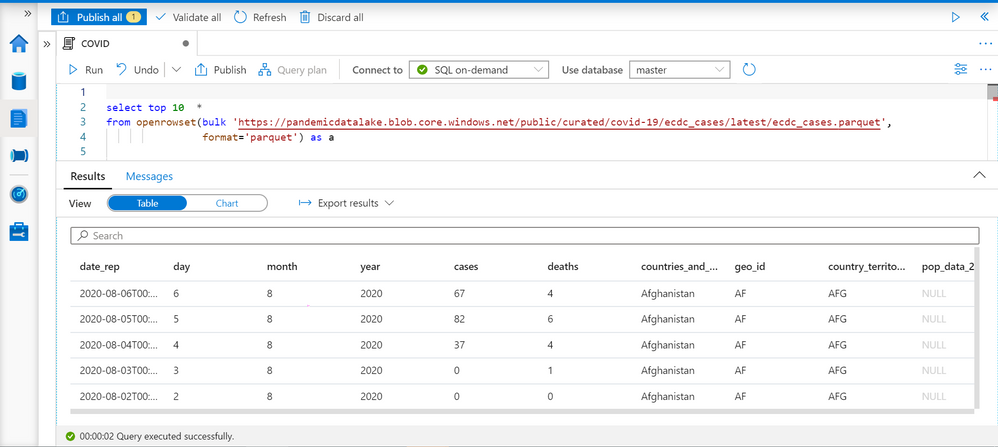
Synapse SQL endpoint in Synapse Analytics enables you to use OPENROWSET T-SQL function to analyze data in Azure Data Lake storage. This is easy to use function where you just need to provide URL of some file on Azure storage and you will get the content of the file. Example of OPENROWSET function that reads the content of a parquet file placed on Azure storage is shown in the following example:

If you provide a file URL after the bulk keyword and specify that you are using parquet format, you will get the content of that parquet file. In this result set we can see some interesting columns:
- date_rep – date when the COVID cases are reported.
- countries_and_territories/geo_id identifies the country where the COVID cases are reported.
- cases – number of reported cases in the country on a date_rep
Current and past week cases per country
We can easily get the number of cases reported for each country on a given day. TSQL LAG function enables us to get the number of cases reported 7 days ago:

LAG function will return a value of COVID cases reported in the record with the same geo_id (see PARTITION BY geo_id in OVER clause) column, and return 7th previous record ordered by date_rep (see ORDER BY date_rep in OVER clause). This is the number of cases reported seven days ago in the country.
As you can see on the picture above in Finland is reported 29 cases on 6th august, and 10 cases seven days before. This is exactly what we need to have to compare currently reported number of cases with the number of cases reported seven days ago to calculate the increase per each year.
Average weekly cases
Number of COVID cases might vary if we look at daily values. In some cases, you can see daily variations like 10, 23, 9, 17 that might provide misleading conclusions especially if the variation is close to actual value.
More reliable metric would be to calculate average number of reported cases per week (or any 7-day time window). We can use windowing extension of AVG function for this purpose:
AVG(<value>)
       OVER(partition by <paritition value>
            order by <sort value>
            ROWS BETWEEN <start> AND <end>  )
For each record this window function will get the records that have the same <partition value> (for example country id since we are finding average value within the country), order them by <sort value> (for example date when the cases are reported), and get the records between <start> and <end> in this. Then it will calculate average value (for example cases in our case).
You can find more information about window function in the article Advanced analytics of COVID data using Synapse SQL endpoint.
The following query returns average number of reported cases in past seven days and the average number of cases in previous 7-day period:

Now we have reports with the data like the previous case, but more reliable metric.
The countries with the highest increase of COVID cases
We have information about the countries, number of reported cases this week, and number of reported cases a week ago, so we are ready to compare these values and find the countries with the highest increase of COVID cases.
I will put the query that returns average weekly cases as CTE named query, and do analyze data on the result of this named query:

I’m filtering results on some specific date (5th August), ignoring countries with less than 100 cases, and ordering by percentage of increase. You can see the results with the countries where the number of COVID cases is increased. You can easily modify that report to change time periods or get the report for some point in time in the past.
Conclusion
Synapse SQL endpoint and Synapse Studio in Azure Synapse Analytics are tools for easy data exploration that enable you to easily read the content of a file and do basic data exploration. In this example, we have seen how to leverage T-SQL language and charting features in Synapse Analytics to identify the countries with highest weekly increase of COVID cases. The similar analysis can be repeated on any other data set. You can find more information about querying files in Azure Data Lakes Storage in this article.
If you want to try these queries, the scripts are below:
select top 10  *
from openrowset(bulk 'https://pandemicdatalake.blob.core.windows.net/public/curated/covid-19/ecdc_cases/latest/ecdc_cases.parquet',
                format='parquet') as a;

select  TOP 10 date_rep, countries_and_territories,
        cases,
        prev = LAG(CASES, 7) OVER(partition by geo_id order by date_rep )
from openrowset(bulk 'https://pandemicdatalake.blob.core.windows.net/public/curated/covid-19/ecdc_cases/latest/ecdc_cases.parquet',
                        format='parquet') as a
order by date_rep desc;
GO

select  TOP 10 date_rep, countries_and_territories,
        current_avg = AVG(CASES) OVER(partition by geo_id order by date_rep ROWS BETWEEN 7 PRECEDING AND CURRENT ROW  ),
        prev_avg = AVG(CASES) OVER(partition by geo_id order by date_rep ROWS BETWEEN 14 PRECEDING AND 7 PRECEDING  )
from openrowset(bulk 'https://pandemicdatalake.blob.core.windows.net/public/curated/covid-19/ecdc_cases/latest/ecdc_cases.parquet',
                 format='parquet') as a
order by date_rep desc;
GO
with weekly_cases as (
        select  geo_id, date_rep, countries_and_territories,
                current_avg = AVG(CASES) OVER(partition by geo_id order by date_rep ROWS BETWEEN 7 PRECEDING AND CURRENT ROW  ),
                prev_avg = AVG(CASES) OVER(partition by geo_id order by date_rep ROWS BETWEEN 14 PRECEDING AND 7 PRECEDING  )
        from openrowset(bulk 'https://pandemicdatalake.blob.core.windows.net/public/curated/covid-19/ecdc_cases/latest/ecdc_cases.parquet',
                             format='parquet') as a )
select countries_and_territories, current_avg, prev_avg, [WoW%] = 100*(1.* current_avg / prev_avg - 1)
from weekly_cases
where date_rep = '2020-08-05'
and prev_avg > 100
order by (1. * current_avg / prev_avg -1)  desc
Brought to you by Dr. Ware, Microsoft Office 365 Silver Partner, Charleston SC.

Recent Comments