How To Use Cache for Re-platform to Azure

How To Use Cache for Re-platform to Azure

This article is contributed. See the original author and article here.

Overview


Moving to Cloud is a crucial part of digital transformation as business grows. As a leading Cloud provider, Azure provides intuitive, guided, and repeatable support for migrating an on-prem application to Azure cloud. You can learn more at Reliable web app pattern – Azure Architecture Center.


To ensure a web application runs performantly and resiliently, you can use Azure Cache for Redis. This blog zooms into caching best practices and guidance in the Reliable Web App Pattern.


Moving In-Memory Cache to Distributed Cache in Azure


Suppose your online order web app saves shopping cart items in a user’s session data in memory. As you migrate a web application from on-prem to Azure Cloud, caching in-memory no longer works because the virtual servers may scale-in or shut down to save cost. In such cases, in-memory data will be gone. Distributed caching persists cached data by decoupling cache from the web server instances to support scalability and resiliency. In addition, if you were self-hosting Redis Cache, re-platform to use Azure Cache for Redis removes operational overhead from self-hosting. Azure resources located within the same data center have negligible network latency, and the in-memory nature of Azure’s Cache service ensures accessing data is fast.  


Azure Cache for Redis is the 1st party caching solution in Azure. Developed in partnership with Redis Inc, Azure Cache for Redis provides the unparalleled up to 99.999% SLA with Enterprise SKUs, data replication across geographic locations, and scenario-drive cost effective hosting options to meet your business needs.


Patterns and Best Practices to Use Distributed Caching in Azure


To help customers successfully re-platform from on-prem to Azure, the Reliable web app pattern offers reference architecture scenarios to guide the process. Currently, the Reliable Web App Pattern for .NET and Java are available. Without losing generosity, we will look at the recently announced Java support for how to apply caching when migrating an application.


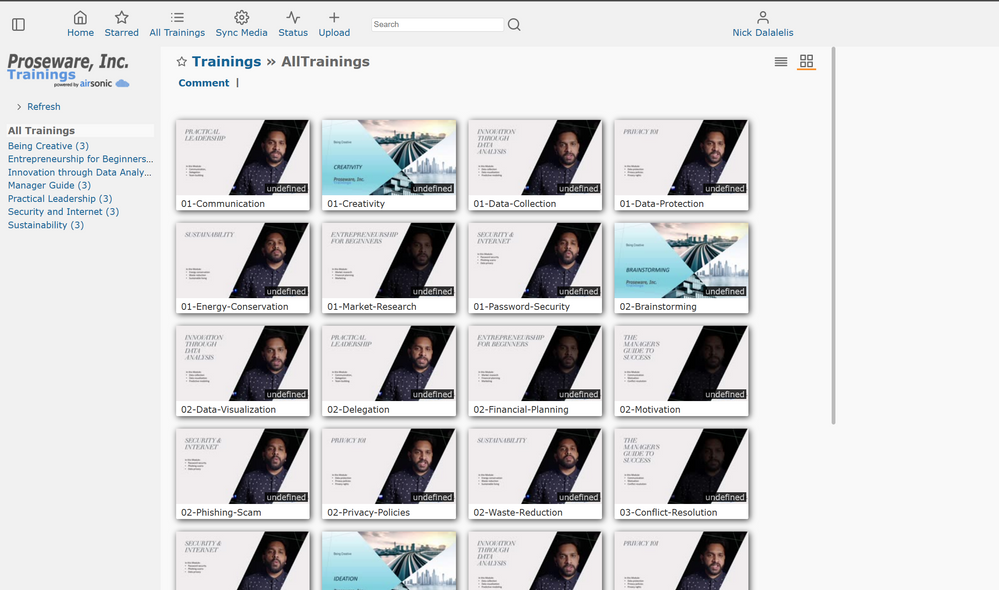
We recently announced GA for the Java version of Reliable Web App pattern, which is a set of architectural recommendations and guided, repeatable process with Reference Architecture applications to ensure customers can successfully migrate to Azure. You can learn more at Reliable web app pattern for Java – Plan the implementation – Azure Reference Architectures. In the example reference application, an online training web app written in Java Spring Framework is transformed to run on Azure. Figure 1 shows a screenshot of the web application, which is a real-world and production-ready training web application that shows a series of educational tutorials. The playlist of video tutorials might be different for each user and can be cached for quick access and saving a user’s training progress.


Figure 1: Java sample application homepage that shows training video playlist


CawaMS_2-1694059109486.png


In the reference architecture caching is applied to multiple scenarios such as logged in user settings, security settings, and displaying the playlist on the homepage as shown in Figure 1. Let’s look at how smooth it is to transition from local cache to Azure with our example.


Per Figure 2, initializing Redis in a Java application only takes a few lines of code, and the configuration is very flexible. You can find it at RedisConfig.java.


Figure 2: Initializing Redis client in a Java Spring web application.


CawaMS_3-1694059143541.png


Java Spring Caching abstraction allows tag annotations to be used for indicating if a method’s return value should be cached and how. In Figure 3, the tag annotations hide all the details on interacting with Redis Cache and allows developers to focus on business logic. Referring back to the video playlist shown in Figure 1 above, in its implementation from the PlaylistService.java, the playlist and playlist per user are cached for saving user progress and performantly and query-efficiently loading the result next time.


Figure 3: Java Spring Caching Abstraction for caching method return results.


CawaMS_4-1694059224852.png


Deploying the application to use Azure Cache for Redis is straight forward. Just point the app configuration to the right Azure Cache for Redis endpoints to get your app working! Follow the README.md instructions to deploy the app.


Use the Cache-Aside pattern for data consistency


As a user’s playlist is part of the session data and is saved in cache, what if the overall playlist gets updated? How do we make sure information in cache stays consistent with the backend database?


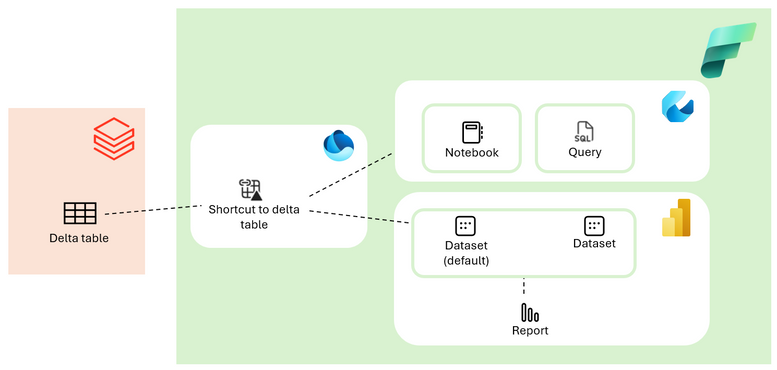
The cache-aside pattern guarantees application data consistency. It would attempt to read from cache every time, upon a cache miss it reads from the database and put the value in cache for the next read, and upon an update in database all related cache records will be cleared to keep data up-to-date. Figure 4 illustrates how the cache-aside pattern keeps data from cache to the backend data store to be consistent. You can learn more at Cache-Aside pattern – Azure Architecture Center.


Figure 4: cache-aside pattern keeps cache and datastore consistent


CawaMS_5-1694059326147.png


Referring to our Java sample application, the Spring Caching Abstraction hides the details as this algorithm is a highly repeatable process.


Next steps


You can learn more about the .NET reference application at Introducing the Reliable Web App Pattern for .NET – .NET Blog. Read more about the Reliable Web App Pattern at Reliable web app pattern – Azure Architecture Center.


See how Sage uses Viva Glint and Viva Insights to improve retention and performance

This article is contributed. See the original author and article here.

In today’s fast-paced business world, embracing technology and prioritizing employee engagement are key to staying ahead. Sage, a global leader in payroll, HR and finance software, understands this well. Their partnership with Microsoft Viva Glint and Viva Insights is a compelling example of how utilizing a comprehensive employee listening strategy can drive business performance within organizations. 


Delivering exceptional customer service and prioritizing engineering time is critical for Sage to stay ahead in a competitive market. Sage addressed challenges to retention and productivity by understanding the voice of the employee and meeting patterns. With this knowledge in hand, leaders at Sage were able to address root causes and improve retention by 30% in their customer service department, improve engineering productivity by 10% by reducing unnecessary meetings and improve customer service performance by 10%.  


Take a look at the full customer story here and video highlights below.  


Conditional Access Overview and Templates are now Generally Available!

Conditional Access Overview and Templates are now Generally Available!

This article is contributed. See the original author and article here.


Today, we are excited to announce the general availability of Conditional Access overview dashboard and templates. Conditional Access protects thousands of organizations across the globe daily and customers often ask us about best practices and how to improve security coverage. Conditional Access overview dashboard and templates empower Microsoft Entra ID customers to gain insights into their security posture, assess the impact of individual policies, and simplify deployment of Microsoft’s recommendations.


I’ve invited Krishna Venkit and Lisa Huang-North, product managers on the Identity Security team to share more details about these two features.


Best Regards,


Nitika Gupta


Group Product Manager, Identity Security


Microsoft Identity Division


————————————————————


Hi everyone!


The Conditional Access overview is a built-in dashboard that offers a comprehensive view of your Conditional Access posture. As an administrator, it provides a concise summary of your policies, identifies any gaps in your policy coverage, and provides valuable insights based on sign-in activity within your tenant. This feature enables you to swiftly pinpoint areas where you can enhance the enforcement of Zero Trust principles, ultimately bolstering your defense mechanisms.


Figure 1 Conditional Access overviewFigure 1 Conditional Access overview


The dashboard is now the default landing page of Conditional Access. As the first entry point into Conditional Access, the overview page lets you quickly create new policies using one of the Conditional Access templates which capture commonly used policies and best practices.


The dashboard also offers the following insights and reporting capabilities:


  •  The “See all unprotected sign-ins” link under the Users tile helps you rapidly identify users that are signing in without the protections of a Conditional Access policy.


Figure 2 Sign-ins without CA coverage during the last 7 daysFigure 2 Sign-ins without CA coverage during the last 7 days


  • The ‘See all non-compliant devices’ and ‘See all unmanaged devices’ links under the Devices tile help you identify device compliance gaps.


Figure 3 Non-compliant devicesFigure 3 Non-compliant devices


  • You can discover the top 10 most accessed apps without Conditional Access coverage using the coverage tab and go one step further and identify the users without coverage for that app by clicking on the numbers in the ‘Users without coverage’ column.


Figure 4: Top accessed applications without CA coverageFigure 4: Top accessed applications without CA coverage


You can discover security alerts generated based on sign-in activity in your tenant and take quick action on the alerts by deploying recommended zero trust conditional access policies using the Conditional Access templates. Speaking of which, let’s take a brief walkthrough of Conditional Access templates.


Conditional Access templates are a pre-defined set of conditions and controls that provide a convenient method to deploy new policies aligned with Microsoft recommendations. Customers are assured that their policies reflect modern best practices for securing corporate assets, promoting secure, optimal access for their hybrid workforce.


Conditional Access templates are organized across five scenarios:


  • Secure foundation

  • Zero Trust

  • Remote work

  • Protect administrators

  • Emerging threats


Organizations can choose from 16 predefined Conditional Access templates based on their specific needs. Here is an example!


With the “Require phishing-resistant multifactor authentication for admins” Conditional Access template, customers can reduce the risk of compromise and phishing attacks on privileged users. This powerful template uses Conditional Access authentication strengths to help you choose the right authentication method requirements for specific scenarios, making it easier than ever for organizations to move their most critical users towards more secure, modern, and strong authentication.


Figure 5: Conditional Access template - Require phishing-resistant multifactor authentication for adminsFigure 5: Conditional Access template – Require phishing-resistant multifactor authentication for admins


Learn more about the Conditional Access overview dashboard: https://aka.ms/CAOverviewDashboard


Learn more about Conditional Access templates: https://aka.ms/ConditionalAccessTemplateDocs


Tell us what you think


Give it a try and let us know if you have questions or feedback at https://aka.ms/AzureADFeedback. We hope you will love it as much as we do!


Krishna Venkit


Product Manager


Microsoft Identity Division


Lisa Huang-North (@lisaychuang),


Senior Product Manager


Microsoft Identity Division


Learn more about Microsoft identity:   


Utilizando Log Analytics para monitorar logs de auditoria do Azure RedHat OpenShift

Utilizando Log Analytics para monitorar logs de auditoria do Azure RedHat OpenShift

This article is contributed. See the original author and article here.

Utilizando Log Analytics para monitorar logs de auditoria do Azure RedHat OpenShift


Introdução


Por padrão, os clusters Azure Red Hat OpenShift possuem uma forma de monitorar os logs de auditoria através do OpenShift Logging, que envolve a instalação do OpenShift Elasticsearch Operator e OpenShift Cluster Logging. Embora essa solução seja eficiente, ela não permite a integração com o Azure Monitor, a solução de monitoramento da Microsoft, nem a centralização dos logs de auditoria de diversos clusters em um único local.


Para demonstrarmos uma solução personalizada, é necessário possuir um cluster Azure Red Hat OpenShift. Caso você não possua um cluster, é possível seguir o tutorial Criando um cluster Azure Red Hat OpenShift e lembre-se de utilizar a opção do pull secret para baixar as imagens da RedHat Pull Secret


Pré-requisitos


Fluent Bit


Fluent Bit é um sistema de coleta e encaminhamento de registros e logs (logs de eventos e mensagens) desenvolvido como parte do ecossistema Fluentd. É uma solução leve e eficiente projetada para coletar, filtrar e encaminhar logs em ambientes distribuídos.


Azure Red Hat OpenShift


Após a criação do cluster, vamos analisar as pastas que estão os logs de auditoria do cluster.


  • Faça o login no cluster, você pode pegar o endereço do cluster no portal do Azure, na aba Overview do cluster criado e clicando no botão Connect238048625-6f564954-2705-49c7-be99-8a3c8035037f.png

  • Clique na URL e utilize o username kubeadmin como user e o password como senha.


Instalando o Fluent Bit no cluster


Para fazer a instalação no Azure Red Hat OpenShift, precisamos setar o security context constraints (SCC), para isso você precisa estar logado via cli e ter um usuário com permissão de cluster-admin.


Execute o comando abaixo para criar o SCC:


kubectl create -f https://raw.githubusercontent.com/fluent/fluent-bit-kubernetes-logging/master/fluent-bit-openshift-security-context-constraints.yaml

A instalação do Fluent Bit é feita via helm charts, para isso, vamos adicionar o repositório do helm charts do Fluent Bit:


helm repo add fluent https://fluent.github.io/helm-charts

Por padrão a instalação do Fluent Bit os DaemonSets são instalados somente nos workers nodes, mas para ter acesso aos logs de auditoria, precisamos fazer a instalação somente no master node, para isso, vamos criar um arquivo chamado values.yaml com o seguinte conteúdo:


# kind — DaemonSet or Deployment
kind: DaemonSet

# replicaCount — Only applicable if kind=Deployment
replicaCount: 1

image:
repository: cr.fluentbit.io/fluent/fluent-bit
# Overrides the image tag whose default is {{ .Chart.AppVersion }}
tag: “latest-debug”
pullPolicy: Always

testFramework:
enabled: true
image:
repository: busybox
pullPolicy: Always
tag: latest

imagePullSecrets: []
nameOverride: “”
fullnameOverride: “”

serviceAccount:
create: true
annotations: {}
name:

rbac:
create: true
nodeAccess: false

# Configure podsecuritypolicy
# Ref: https://kubernetes.io/docs/concepts/policy/pod-security-policy/
# from Kubernetes 1.25, PSP is deprecated
# See: https://kubernetes.io/blog/2022/08/23/kubernetes-v1-25-release/#pod-security-changes
# We automatically disable PSP if Kubernetes version is 1.25 or higher
podSecurityPolicy:
create: false
annotations: {}

openShift:
# Sets Openshift support
enabled: true
# Creates SCC for Fluent-bit when Openshift support is enabled
securityContextConstraints:
create: true
annotations: {}

podSecurityContext: {}
# fsGroup: 2000

hostNetwork: false
dnsPolicy: ClusterFirst

dnsConfig: {}
# nameservers:
# – 1.2.3.4
# searches:
# – ns1.svc.cluster-domain.example
# – my.dns.search.suffix
# options:
# – name: ndots
# value: “2”
# – name: edns0

hostAliases: []
# – ip: “1.2.3.4”
# hostnames:
# – “foo.local”
# – “bar.local”

securityContext:
privileged: true
runAsUser: 0
readOnlyRootFilesystem: false
# capabilities:
# drop:
# – ALL
# readOnlyRootFilesystem: true
# runAsNonRoot: true
# runAsUser: 1000

service:
type: ClusterIP
port: 2020
loadBalancerClass:
loadBalancerSourceRanges: []
labels: {}
# nodePort: 30020
# clusterIP: 172.16.10.1
annotations: {}
# prometheus.io/path: “/api/v1/metrics/prometheus”
# prometheus.io/port: “2020”
# prometheus.io/scrape: “true”

serviceMonitor:
enabled: false
# namespace: monitoring
# interval: 10s
# scrapeTimeout: 10s
# jobLabel: fluentbit
# selector:
# prometheus: my-prometheus
# ## metric relabel configs to apply to samples before ingestion.
# ##
# metricRelabelings:
# – sourceLabels: [__meta_kubernetes_service_label_cluster]
# targetLabel: cluster
# regex: (.*)
# replacement: ${1}
# action: replace
# ## relabel configs to apply to samples after ingestion.
# ##
# relabelings:
# – sourceLabels: [__meta_kubernetes_pod_node_name]
# separator: ;
# regex: ^(.*)$
# targetLabel: nodename
# replacement: $1
# action: replace
# scheme: “”
# tlsConfig: {}

## Beare in mind if youn want to collec metrics from a different port
## you will need to configure the new ports on the extraPorts property.
additionalEndpoints: []
# – port: metrics
# path: /metrics
# interval: 10s
# scrapeTimeout: 10s
# scheme: “”
# tlsConfig: {}
# # metric relabel configs to apply to samples before ingestion.
# #
# metricRelabelings:
# – sourceLabels: [__meta_kubernetes_service_label_cluster]
# targetLabel: cluster
# regex: (.*)
# replacement: ${1}
# action: replace
# # relabel configs to apply to samples after ingestion.
# #
# relabelings:
# – sourceLabels: [__meta_kubernetes_pod_node_name]
# separator: ;
# regex: ^(.*)$
# targetLabel: nodename
# replacement: $1
# action: replace

prometheusRule:
enabled: false
# namespace: “”
# additionalLabels: {}
# rules:
# – alert: NoOutputBytesProcessed
# expr: rate(fluentbit_output_proc_bytes_total[5m]) == 0
# annotations:
# message: |
# Fluent Bit instance {{ $labels.instance }}’s output plugin {{ $labels.name }} has not processed any
# bytes for at least 15 minutes.
# summary: No Output Bytes Processed
# for: 15m
# labels:
# severity: critical

dashboards:
enabled: false
labelKey: grafana_dashboard
annotations: {}
namespace: “”

lifecycle: {}
# preStop:
# exec:
# command: [“/bin/sh”, “-c”, “sleep 20”]

livenessProbe:
httpGet:
path: /
port: http

readinessProbe:
httpGet:
path: /api/v1/health
port: http

resources: {}
# limits:
# cpu: 100m
# memory: 128Mi
# requests:
# cpu: 100m
# memory: 128Mi

## only available if kind is Deployment
ingress:
enabled: false
className: “”
annotations: {}
# kubernetes.io/ingress.class: nginx
# kubernetes.io/tls-acme: “true”
hosts: []
# – host: fluent-bit.example.tld
extraHosts: []
# – host: fluent-bit-extra.example.tld
## specify extraPort number
# port: 5170
tls: []
# – secretName: fluent-bit-example-tld
# hosts:
# – fluent-bit.example.tld

## only available if kind is Deployment
autoscaling:
vpa:
enabled: false

annotations: {}

# List of resources that the vertical pod autoscaler can control. Defaults to cpu and memory
controlledResources: []

# Define the max allowed resources for the pod
maxAllowed: {}
# cpu: 200m
# memory: 100Mi
# Define the min allowed resources for the pod
minAllowed: {}
# cpu: 200m
# memory: 100Mi

updatePolicy:
# Specifies whether recommended updates are applied when a Pod is started and whether recommended updates
# are applied during the life of a Pod. Possible values are “Off”, “Initial”, “Recreate”, and “Auto”.
updateMode: Auto

enabled: false
minReplicas: 1
maxReplicas: 3
targetCPUUtilizationPercentage: 75
# targetMemoryUtilizationPercentage: 75
## see https://kubernetes.io/docs/tasks/run-application/horizontal-pod-autoscale-walkthrough/#autoscaling-on-multiple-metrics-and-custom-metrics
customRules: []
# – type: Pods
# pods:
# metric:
# name: packets-per-second
# target:
# type: AverageValue
# averageValue: 1k
## see https://kubernetes.io/docs/tasks/run-application/horizontal-pod-autoscale/#support-for-configurable-scaling-behavior
behavior: {}
# scaleDown:
# policies:
# – type: Pods
# value: 4
# periodSeconds: 60
# – type: Percent
# value: 10
# periodSeconds: 60

## only available if kind is Deployment
podDisruptionBudget:
enabled: false
annotations: {}
maxUnavailable: “30%”

nodeSelector:
node-role.kubernetes.io/master: ”

tolerations:
– key: node-role.kubernetes.io/master
operator: Exists
effect: NoSchedule

affinity: {}

labels: {}

annotations: {}

podAnnotations: {}

podLabels: {}

## How long (in seconds) a pods needs to be stable before progressing the deployment
##
minReadySeconds:

## How long (in seconds) a pod may take to exit (useful with lifecycle hooks to ensure lb deregistration is done)
##
terminationGracePeriodSeconds:

priorityClassName: “”

env: []
# – name: FOO
# value: “bar”

# The envWithTpl array below has the same usage as “env”, but is using the tpl function to support templatable string.
# This can be useful when you want to pass dynamic values to the Chart using the helm argument “–set =”
# https://helm.sh/docs/howto/charts_tips_and_tricks/#using-the-tpl-function
envWithTpl: []
# – name: FOO_2
# value: “{{ .Values.foo2 }}”
#
# foo2: bar2

envFrom: []

extraContainers: []
# – name: do-something
# image: busybox
# command: [‘do’, ‘something’]

flush: 1

metricsPort: 2020

extraPorts: []
# – port: 5170
# containerPort: 5170
# protocol: TCP
# name: tcp
# nodePort: 30517

extraVolumes: []

extraVolumeMounts: []

updateStrategy: {}
# type: RollingUpdate
# rollingUpdate:
# maxUnavailable: 1

# Make use of a pre-defined configmap instead of the one templated here
existingConfigMap: “”

networkPolicy:
enabled: false
# ingress:
# from: []

luaScripts: {}

## https://docs.fluentbit.io/manual/administration/configuring-fluent-bit/classic-mode/configuration-file
config:
service: |
[SERVICE]
Daemon Off
Flush {{ .Values.flush }}
Log_Level {{ .Values.logLevel }}
Parsers_File parsers.conf
Parsers_File custom_parsers.conf
HTTP_Server On
HTTP_Listen 0.0.0.0
HTTP_Port {{ .Values.metricsPort }}
Health_Check On

## https://docs.fluentbit.io/manual/pipeline/inputs
inputs: |
[INPUT]
Name tail
Path /var/log/kube-apiserver/*.log
multiline.parser docker, cri
Tag audit.kube-apiserver.*
DB /tmp/kube_apiserver.db
Mem_Buf_Limit 50MB
Refresh_Interval 10
Skip_Empty_Lines On
Buffer_Chunk_Size 5M
Buffer_Max_Size 50M
Skip_Long_Lines Off

[INPUT]
Name tail
Path /var/log/openshift-apiserver/*.log
multiline.parser docker, cri
Tag audit.openshift-apiserver.*
DB /tmp/openshift-apiserver.db
Mem_Buf_Limit 50MB
Refresh_Interval 10
Skip_Empty_Lines On
Buffer_Chunk_Size 5M
Buffer_Max_Size 50M
Skip_Long_Lines Off

[INPUT]
Name tail
Path /var/log/oauth-apiserver/*.log
multiline.parser docker, cri
Tag audit.oauth-apiserver.*
DB /tmp/oauth-apiserver.db
Mem_Buf_Limit 50MB
Refresh_Interval 10
Skip_Empty_Lines On
Buffer_Chunk_Size 5M
Buffer_Max_Size 50M
Skip_Long_Lines Off

## https://docs.fluentbit.io/manual/pipeline/filters
filters: |
[FILTER]
Name kubernetes
Match kube.*
Merge_Log On
Keep_Log Off
K8S-Logging.Parser On
K8S-Logging.Exclude On

## https://docs.fluentbit.io/manual/pipeline/outputs
outputs: |
[OUTPUT]
Name stdout
Match *

## https://docs.fluentbit.io/manual/administration/configuring-fluent-bit/classic-mode/upstream-servers
## This configuration is deprecated, please use `extraFiles` instead.
upstream: {}

## https://docs.fluentbit.io/manual/pipeline/parsers
customParsers: |
[PARSER]
Name docker_no_time
Format json
Time_Keep Off
Time_Key time
Time_Format %Y-%m-%dT%H:%M:%S.%L

# This allows adding more files with arbitary filenames to /fluent-bit/etc by providing key/value pairs.
# The key becomes the filename, the value becomes the file content.
extraFiles: {}
# upstream.conf: |
# [UPSTREAM]
# upstream1
#
# [NODE]
# name node-1
# host 127.0.0.1
# port 43000
# example.conf: |
# [OUTPUT]
# Name example
# Match foo.*
# Host bar

# The config volume is mounted by default, either to the existingConfigMap value, or the default of “fluent-bit.fullname”
volumeMounts:
– name: config
mountPath: /fluent-bit/etc/fluent-bit.conf
subPath: fluent-bit.conf
– name: config
mountPath: /fluent-bit/etc/custom_parsers.conf
subPath: custom_parsers.conf

daemonSetVolumes:
– name: varlog
hostPath:
path: /var/log
– name: varlibdockercontainers
hostPath:
path: /var/lib/docker/containers
– name: etcmachineid
hostPath:
path: /etc/machine-id
type: File

daemonSetVolumeMounts:
– name: varlog
mountPath: /var/log
– name: varlibdockercontainers
mountPath: /var/lib/docker/containers
readOnly: true
– name: etcmachineid
mountPath: /etc/machine-id
readOnly: true

args: []

command: []

# This supports either a structured array or a templatable string
initContainers: []

# Array mode
# initContainers:
# – name: do-something
# image: bitnami/kubectl:1.22
# command: [‘kubectl’, ‘version’]

# String mode
# initContainers: |-
# – name: do-something
# image: bitnami/kubectl:{{ .Capabilities.KubeVersion.Major }}.{{ .Capabilities.KubeVersion.Minor }}
# command: [‘kubectl’, ‘version’]

logLevel: info


Se desejar comparar o arquivo que está sendo criado com o arquivo oficial do Fluent Bit, você pode acessar o repositório do Fluent Bit, o arquivo yaml acima também tem a configuração para as pastas abaixo de logs do Azure Red Hat OpenShift que usam a tag [INPUT].


  • /var/log/kube-apiserver

  • /var/log/openshift-apiserver

  • /var/log/oauth-apiserver


Nessa configuração acima estão também estamos usando a imagem com a tag “latest-debug”, com essa tag é possível ver os logs do Fluent Bit no console do pod após a instalação do Fluent Bit no cluster, para isso basta executar o comando abaixo:


ls /var/log/kube-apiserver
ls /var/log/openshift-apiserver
ls /var/log/oauth-apiserver

Para realizar a instalação, esteja na mesma pasta em que o arquivo values.yaml foi criado e execute o comando abaixo.


kubectl create namespace logging
helm install fluent-bit fluent/fluent-bit –namespace logging –values values.yaml

Logo após instalado, vá ao dashboard do seu cluster, selecione workloads e pods na aba lateral e selecione o project como logging, você deve ter a mesma quantidade de pods que o cluster tem de worker nodes, no meu caso são três workers nodes.


1.png

Com a configuração atual estamos somente lendo os arquivos de logs e mostrando no terminal.


9.png


Criando um Log Analytics workspace


Para enviarmos os logs para o Azure Monitor precisamos criar um Log Analytics workspace, para isso acesse siga os passos


Após a criação do Log Analytics workspace e acesse o mesmo e na menu lateral nos settings clique no Agents.


2.png

Salve o Workspace ID e o Primary Key, pois vamos usar os mesmo para a nova configuração.


Agora precisamos adicionar mais um output na configuração do ConfigMap do Fluent Bit.


  • Vá no ConfigMap(fluent-bit) e adicione o output abaixo no final do arquivo e clique no salvar.


      ## https://docs.fluentbit.io/manual/pipeline/outputs

    [OUTPUT]
    Name azure
    Match *
    Customer_ID ${WorkspaceId}
    Shared_Key ${SharedKey}
    Log_Type AuditOpenshift


  • Execute o comando abaixo para criar uma Secret com o WorkspaceId e SharedKey (que é o seu Primary Key). Mude o xxxx para o seus valores


    kubectl create secret generic fluentbit-secret –from-literal=SharedKey=”xxxx” –from-literal=WorkspaceId=”xxxx” -n logging


  • Após criar a secret você pode verificar a mesma rodando o comando abaixo.


    kubectl get secret fluentbit-secret  -n logging


  • Agora precisamos adicionar secret no DaemonSet, para isso vá no menu lateral e selecione DaemonSets e clique no fluent-bit e  selecione Enviroments


  • 0.png


  • Clique no Add from ConfigMap or Secret3.png


  • Adicione as environments SharedKey e WorkspaceId e no Select a resource , selecione o Secret que foi criado anteriormente fluent-bit-secret, deixe igual a imagem abaixo e clique no save.4.png


  • Para que a nova configuração seja aplicada, é necessário excluir os Pods atuais; execute o comando abaixo.


    kubectl delete pods -l app.kubernetes.io/instance=fluent-bit  -n logging


  • Após deletar os pods, você pode verificar que os novos pods já estão sendo criados com a nova configuração, para isso execute o comando abaixo.


    kubectl get pods -l app.kubernetes.io/instance=fluent-bit  -n logging
    # Utilize o nome do primeiro de pod que aparecer e execute o comando abaixo para ver os logs do pod.
    kubectl logs fluent-bit-xxxx -n logging | grep “customer_id=”


  • Vai mostrar os logs como abaixo, mostrando que o output para o Log Analytics workspace a foi enviado com sucesso.


      [2023/06/06 16:37:07] [ info] [output:azure:azure.1] customer_id=247446f4-e70c-4338-87d3-ba4f902a82c9, HTTP status=200
    [2023/06/06 16:37:07] [ info] [output:azure:azure.1] customer_id=247446f4-e70c-4338-87d3-ba4f902a82c9, HTTP status=200
    [2023/06/06 16:37:08] [ info] [output:azure:azure.1] customer_id=247446f4-e70c-4338-87d3-ba4f902a82c9, HTTP status=200
    [2023/06/06 16:37:08] [ info] [output:azure:azure.1] customer_id=247446f4-e70c-4338-87d3-ba4f902a82c9, HTTP status=200
    [2023/06/06 16:37:09] [ info] [output:azure:azure.1] customer_id=247446f4-e70c-4338-87d3-ba4f902a82c9, HTTP status=200


Vizualizando os logs de auditoria no Log Analytics workspace


  1. Entre no portal da azure, busque na barra de pesquisa do Log Analytics workspace e na lista selecione o Log Analytics workspace que foi criado nos passos anteriores.


  2. No menu lateral selecione logs como na imagem abaixo.


  3. Vai abrir uma tela de queries e feche a mesma.


  4. Em tables, abra custom logs e deve ter uma tabela com no nome AuditOpenshift_CL


  5. Vá no campo e coloque o comando abaixo e clique no Run


    AuditOpenshift_CL |
    take 100


  6. Após rodar o comando, irá mostrar todos os logs de auditoria que estão sendo enviados para o Log Analytics workspace6.png


Conclusão


Em resumo, o Fluent Bit é uma ferramenta poderosa para coletar e enviar logs para o Log Analytics Workspace da Azure. Com a configuração correta, você pode coletar logs de vários serviços e aplicativos em execução em seu cluster Kubernetes(OpenShift) e enviá-los para o Log Analytics Workspace para análise e monitoramento. Além disso, o Fluent Bit é altamente configurável e pode ser personalizado para atender às suas necessidades específicas. Esperamos que este guia tenha sido útil para você começar a usar o Fluent Bit em seu ambiente Kubernetes(OpenShift).


Referências


Integrating Microsoft Fabric with Azure Databricks Delta Tables

Integrating Microsoft Fabric with Azure Databricks Delta Tables

This article is contributed. See the original author and article here.

Introduction


Microsoft Fabric is a powerful unified analytics solution that allows users to seamlessly connect to various data sources, including Azure Databricks, and create insightful reports and visualizations without the need to move the data.


In this tutorial, we’ll show you step-by-step how to connect to Azure Databricks generated Delta Tables and create a report in Microsoft Fabric.


By the end of this tutorial, you’ll have the knowledge needed to read Azure Databricks generated Delta Tables from a Microsoft Fabric using Notebook and SQL query. You will also learn how to create a Power BI report that can help drive business decisions. So, let’s get started!


Anu_Singh_6-1693676822491.png


Prerequisites


Before you connect, complete these steps:


  • An Azure Databricks workspace

  • An ADLS Gen2 account to store delta table and a parquet file

  • A Fabric workspace. For more information, see Fabric trial docs.

  • A lakehouse in Fabric workspace. For more information, see Create a lakehouse with OneLake.


Create Delta Table in Databricks


  1. Create a delta table from Databricks Notebook.


   In this case, I am using parquet files stored in ADLS Gen2 account to create a delta table.


%SQL

--create external table from parquet files stored in ADLS Gen2
CREATE TABLE fact_internet_sales
LOCATION 'abfss://demo@[yourdatalake].dfs.core.windows.net/fact_internet_sales'
AS
SELECT * FROM PARQUET.`abfss://data@[yourdatalake].dfs.core.windows.net/fact_internet_sales`;


Anu_Singh_1-1693605529594.png


%Python

#Read parquet files stored in ADLS Gen2
df = spark.read.format('parquet')
    .load("abfss://data@[yourdatalake].dfs.core.windows.net/fact_internet_sales")

#Write to an external delta table
df.write 
    .format("delta") 
    .option("path", "abfss://demo@[yourdatalake].dfs.core.windows.net/fact_internet_sales") 
    .saveAsTable("fact_internet_sales")


Anu_Singh_2-1693605761876.png


Read the Delta Table in Fabric


Open the Fabric workspace to read, analyse and visualise the data.


Create shortcut to delta table


  1. In the lakehouse, click on ellipses (…) next to the Tables and select New Shortcut.

     Anu_Singh_1-1693606671369.png


  2. In the New shortcut wizard, select Azure Data Lake Storage Gen2 tile. For more information, see Create an Azure Data Lake Storage Gen2 shortcut                                                                                                                Anu_Singh_2-1693606905366.png


  3. Enter the storage account URL in Connection settings.


    Field


    Details


    URL


    https://StorageAccountName.dfs.core.windows.net


     Anu_Singh_3-1693607504533.png                                               


  4. Enter the connection details (sign in if required) and select Next

    In this case, I am using ‘Organization Account’ Authentication kind and hence need to sign in.


    Field


    Details


    Connection


    Existing connections for the specified storage location will appear in the drop-down. If none exist, create a new connection.


    Connection name


    The Azure Data Lake Storage Gen2 connection name.


    Authentication kind


    The supported models are: Organizational account, Account Key, Shared Access Signature (SAS), and Service principal. For more information, see ADLS shortcuts.


     Anu_Singh_4-1693607697749.png                                                                                   


  5. Enter the Shortcut Name and Sub path details and then click Create


    Field


    Details


    Shortcut Name


    Name of your shortcut


    URL


    The Azure Data Lake Storage Gen2 URL from the last page.


    Sub Path


    The directory where the delta table resides.


    Anu_Singh_5-1693607870447.png


  6. The shortcut pointing to the delta table (fact_internet_sales) created in the last section will now appear as a delta table under Tables in the Explorer pane.                                                                                                        


  7. Click on the table (fact_internet_sales) and the data in the table will show up.


    Anu_Singh_2-1693671634119.png


Read the data from Notebook – Lakehouse mode


The data in the table can now be queried directly from the notebook in Fabric.


  1. Right-click on the table or click on ellipses (…) next to the table, click Open in notebook and then New notebook.


    Anu_Singh_2-1693839332613.png


  2. New notebook will appear with the query automatically generated to read the data in the table.


  Select the Run Cell button or press Ctrl+Enter to execute the query and view the data.


Anu_Singh_8-1693673096446.png


Read the data using SQL – SQL Endpoint mode


The data in the table can also be queried directly using T-SQL query in Fabric.


  1. Browse to the SQL Endpoint created as part of Lakehouse provisioning from your workspace.


  2. After opening SQL Endpoint from the workspace, expand the database, schema and tables folder in the object Explorer to see all tables listed.


  3. Right-click on the table (fact_internet_sales) or click on ellipses (…) next to the table, click New SQL Query and then Select TOP 100 rows


    Anu_Singh_2-1693674552264.png


  4.  The script will be automatically generated and executed to show the data in the table or click on Run to execute the query.


    Anu_Singh_4-1693675947483.png


Visualise the data in Fabric using Power BI


The data in delta table can now be accessed and analysed in Power BI. You can either create a new dataset or use the default dataset created as part of lakehouse provisioning for a new report. For more information, see Direct Lake in Power BI and Microsoft Fabric


Using new dataset


  1. If you are in the Lakehouse mode, click on New Power BI dataset


      Anu_Singh_9-1693677766359.png


If you are in the SQL endpoint mode, click on New Power BI dataset from Reporting tab.


Anu_Singh_8-1693677639859.png


  1. In the New Dataset dialog, select the table to be included in the dataset and click Confirm.


Anu_Singh_12-1693599480206.png


  1. The dataset is automatically saved in the workspace, and then opens the dataset. In the web modelling experience page, click on New Report


Anu_Singh_5-1693839480214.png


  1. In the report authoring page, drag or select the attributes from Data pane to the left-hand side pane to be included in the visualization.


Anu_Singh_3-1693839409972.png


Using default dataset


  1. Select your workspace and open the default dataset.


Anu_Singh_10-1693677984415.png


  1. On the dataset page, click on Start from scratch to create a new report.


Anu_Singh_11-1693678126559.png


  1. In the report authoring page, drag or select the attributes from Data pane to the left-hand side pane to be included in the visualization.


Anu_Singh_4-1693839429999.png


Summary


In conclusion, this guide provides a seamless solution for accessing Azure Databricks generated delta tables from Microsoft Fabric and visualizing the data in Power BI without the need to move the data. By following the steps outlined in this guide, you can easily connect to your delta tables and extract valuable insights from your data. With the power of Azure Databricks and Microsoft Fabric combined, you can take your data analysis to the next level and make informed decisions that drive business success.


Give it a try and let me know if this was helpful.