by Scott Muniz | Aug 19, 2021 | Security, Technology
This article is contributed. See the original author and article here.
Cisco has released security updates to address vulnerabilities in multiple Cisco products. An attacker could exploit some of these vulnerabilities to take control of an affected system. For updates addressing lower severity vulnerabilities, see the Cisco Security Advisories page.
CISA encourages users and administrators to review the following Cisco advisories and apply the necessary updates:
by Contributed | Aug 18, 2021 | Technology
This article is contributed. See the original author and article here.
If you didn’t grow up in the ’90s in France like yours truly, you probably wouldn’t be familiar with the animated kids show named Petit Potam, which was based on the books of the same name by Christine Chagnoux.
While I could talk about the TV series for days, the reason Petit Potam came to the news lately is because of a vulnerability that was recently published with the same name which can potentially be used in an attack on Windows domain controllers. PetitPotam is a tool that can exploit the Encrypting File System Remote (EFSRPC) Protocol.
Exploiting the MS-EFSRPC
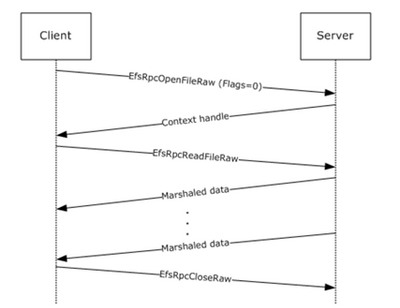
The EFSRPC protocol that PetitPotam exploits is typically used to maintain and manage encrypted data that is stored remotely and accessed over a network. It’s mainly used to manage Windows files that reside on remote file servers and are encrypted using the Encrypting File System (EFS).
Figure 1. Message sequence for opening a file using EFS
Using the PetitPotam vector, an adversary can manipulate MS-EFSRPC API functions without authentication using the OpenEncryptedFileRaw calls. This allows the adversary to force a domain controller to authenticate to an NTLM relay server under the attacker’s control.
NTLM Relay attack
NTLM relay attacks allow the malicious actor to access services on the network by positioning themselves between the client and the server and usually intercepting the authentication traffic and then attempting to impersonate the client.
To prevent NTLM relay attacks on networks with NTLM enabled, domain administrators must ensure that services that permit NTLM authentication utilize protections such as Extended Protection for Authentication (EPA), or signing features, like SMB signing.
PetitPotam takes advantage of servers where Active Directory Certificate Services (AD CS) is not configured with protections for NTLM relay attacks.
Microsoft Defender for Identity detection
Starting from version 2.158 onwards, Microsoft Defender for Identity will trigger a security alert whenever an attacker is trying to exploit the EFS-RPC against the domain controller, which is the preliminary step of the PetitPotam attack.
.png")
Figure 2. Suspicious Network Connection over EFS-RPC alert information
The alert provides visibility into network activity over the protocol and when an attacker is trying to force the domain controller to authenticate against a remote device. The alert will contain the following information:
- Source context – which can be the user and/or the device originating the request
- The target domain controller
- The remote device – including the file the attacker was trying to read
How to protect your organization further
On August 10, 2021, Microsoft published CVE-2021-36942 which addresses this vulnerability, named Windows LSA Spoofing Vulnerability. We highly recommend prioritizing updating the domain controllers with this CVE.
To learn more about the CVE, see the details in the MSRC portal with the following link: https://msrc.microsoft.com/update-guide/vulnerability/CVE-2021-36942
What next?
If you haven’t already got access to Defender for Identity, you can start a trial using this link.
We’re always adding new capabilities to Defender for Identity and we’ll make announcements about great new features here in this blog, so check back regularly to see what the latest updates bring to your security teams.
We’re always keen on hearing your feedback, so please let us know in the comments section below if you have anything to share with us about this detection.
by Contributed | Aug 18, 2021 | Technology
This article is contributed. See the original author and article here.
You can refer to below steps for scenarios in which you have an application special requirement and need to call raw Storage table REST API from your dev environment via Postman. It consists of two main HTTP requests: first, to authenticate directly using AD security principal to get access token, second an authenticated storage REST API call for Table Storage.
Documentation related
Prerequisites
To follow the steps in this article you must have:
- Azure subscription
- An Azure AD tenant
- Registered application (AD Service principal)
Steps to reproduce this scenario:
- Acquire oAuth 2.0 token:
- Created security principal for application (Azure portal > AAD > app registrations). Documentation reference: https://docs.microsoft.com/en-us/rest/api/servicebus/get-azure-active-directory-token#register-your-app-with-azure-ad
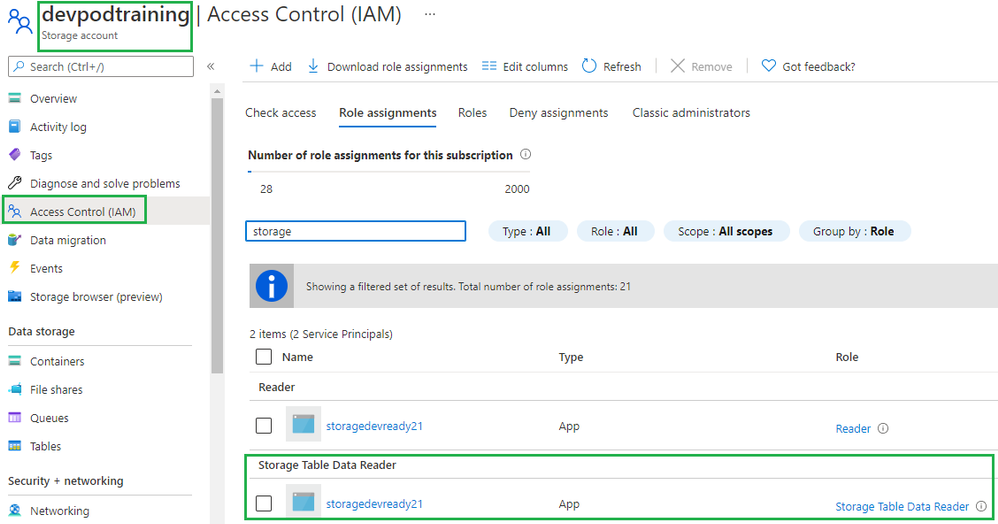
- Assigned Storage Table Data Reader role at storage account level to SP created in step #1 (waited for 30 mins)
- Used Postman to get the Azure AD token:
- Launch Postman.
- For the method, select GET.
- For the URI, enter https://login.microsoftonline.com/<TENANT ID>/oauth2/token. Replace <TENANT ID> with the tenant ID value you copied earlier.
- On the Headers tab, add Content-Type key and application/x-www-form-urlencoded for the value.

- Switch to the Body tab and add the following keys and values.
- Select form-data.
- Add grant_type key, and type client_credentials for the value.
- Add client_id key, and paste the value of client ID you noted down earlier.
- Add client_secret key, and paste the value of client secret you noted down earlier.
- Add resource key, and type https://storage.azure.com/ for the value

- Select Send to send the request to get the token. You see the token in the result. Save the token (excluding double quotes). You will use it later

- Called Query Entities storage REST API and passed the oAuth 2.0 token from previous step
- In Postman, open a new tab.
- Select GET for the method.
- Enter URI in the following format: https://<account>.table.core.windows.net /<table>(). Replace <account> with the name of the Storage Account name. Replace <table> with the name of the table.
- On the Headers tab, add the following three headers.
- Add Authorization key and value for it in the following format: Bearer <TOKEN from Azure AD>. When you copy/paste the token, don’t copy the enclosing double quotes.

- Select Send to get the entities from table. You see the status as OK with the code 200 as shown in the following image.

by Contributed | Aug 18, 2021 | Technology
This article is contributed. See the original author and article here.
Azure Lab Services costs are integrated with Cost Management on the lab account level. However, sometimes it’s useful to create a custom report for your team. We can do this using the line item data from Cost Management. In this blog post we will use Power BI desktop to create a basic report that shows total cost, total number of virtual machines and total number of labs. The report will also include a table that shows cost per lab and cost per virtual machine.
To create this report, we need to complete four major tasks.
- Get the data. We need to import data into PowerBI.
- Transform the data. Each cost line item has all the information we need, but it will need to be separated, so we can work with lab and lab virtual machine information individually.
- Create the data visualization.
- Publish the report for others to see.
Get the data
There are couple options to import the Cost Management data into PowerBI. Which one to use will depend on your type of Azure agreement and your permission level.
Azure Cost Management connector
The first option is the Azure Cost Management connector. Follow the instructions at Create visuals and reports with the Azure Cost Management connector in Power BI Desktop. You will need to provide a billing scope which could cover from a billing agreement to a specific resource group. See understand and work with Azure Cost Management scopes for more information about scopes. See identify resource id for a scope for instructions to get billing scope based on the type of scope you are using.
The Azure Cost Management connector currently supports customers with a Microsoft Customer Agreement or an Enterprise Agreement (EA). There are also some unsupported subscription types. To successfully use the connector, you must have correct permissions and the ability for users to read cost management data must be enabled by the tenant administrator. You can check your access by calling the cost management usage detail api directly.
Azure Cost Management exports
The second option is to export costs to a storage account fromAzure Cost Management. Follow instructions at Tutorial – Create and manage exported data from Azure Cost Management | Microsoft Docs to create the recurring export. You can choose to have data exported daily, weekly or monthly. Each export will be a CSV file saved in blob storage.
In PowerBI Desktop, we will use the Azure Blob Storage connector to import this data. Select the usage detail data from the storage account container you used when scheduling the cost management data exports. Choose to combine the files when importing the CSV file data.
Transform the data
Each usage detail line item has the information for the full resource id of the virtual machine (either template or student) associated with the cost. As explained in cost management guide for Azure Lab Services, these resources will follow one of two patterns.
For templates virtual machines:
/subscriptions/{subscription-id}/resourceGroups/{resource-group}/providers/Microsoft.LabServices/labaccounts/{lab-account-name}/environmentsettings/default
For student virtual machines:
/subscriptions/{subscription-id}/resourceGroups/{resource-group}/providers/Microsoft.LabServices/labaccounts/{lab-account-name}/environmentsettings/default/environments/{vm-name}
For our report, we will need to extract the required data the from the InstanceId property of the Cost Management usage details. Complete the following steps in Power Query.
- Filter on ConsumedService equal to microsoft.labservices.
- Remove duplicate rows. We do this to avoid any issues if using Cost Management exports and data is accidentally exported multiple times. Select all columns except the Source.Name.
- Duplicate InstanceId column and rename it ResourceId.
- Split the InstanceId column on the ‘/’ character.
- Clean up split columns.
- Delete InstanceId.1 to InstanceId.8. We already have the SubscriptionGuid and ResourceGroup columns, so the InstanceId.3 and InstanceId.5 columns aren’t needed.
- Rename InstanceId.9 to LabAccount.
- Delete InstanceId.10.
- Rename InstanceId.11 to Lab.
- Delete InstanceId.12 to InstanceId.14.
- Rename InstanceId.15 to VirtualMachine.
- Replace ‘null’ values with ‘template’. Any rows that don’t have a value for VirtualMachine are costs associated with running the template virtual machine for the lab.
- Save transformations.
Schema for the table should look something like the picture below. Depending on your Azure subscription type, there may be more columns not seen in this example.

Visualize the data
First, let’s create some cards for high-level information. Our cards will show the total cost, number of labs and number of virtual machines used.
Total Cost
The total cost is held in the PreTaxCost column. PowerBI already recognizes that PreTaxCost is number and will automatically add all the column values to create a sum. Add a card to the visual and add PreTaxCost to the Field property of the card visualization. Optionally change the name for the visualization from PreTaxCost to Total Cost.

Number of Labs
Next, let’s display the number labs. We’ll need to create a new measure for this. For instructions explaining how to create a new measure, see create your own measures in Power BI Desktop tutorial.
For the most accurate reporting, we can’t just create a measure that counts all the distinct values in the Lab column because it is possible to have two labs with the same name in different lab accounts. So, for our measure named NumberOfLabs we will count the number of rows when grouped by all the identifying columns for a lab, which are subscription, resource group, lab account and lab name. Note, in this example the table name is dailyexports.
NumberOfLabs = COUNTROWS(GROUPBY(dailyexports, dailyexports[SubscriptionGuid], dailyexports[ResourceGroup], dailyexports[LabAccount], dailyexports[Lab]))
Now we can create a card for the NumberOfLabs measure by following instructions at create card visualizations (big number tiles).
Total Number of Virtual Machines
Creating a card for the total number of virtual machines used will be similar to creating a card for total number of labs. We need to create a measure that counts the unique combination of subscription, resource group, lab account, lab and virtual machine name. Our new measure is
NumberOfVMs = COUNTROWS(GROUPBY(dailyexports, dailyexports[SubscriptionGuid], dailyexports[ResourceGroup], dailyexports[LabAccount], dailyexports[Lab], dailyexports[VirtualMachine]))
Now we can create a card for NumberOfVMs measure by following instructions at create card visualizations (big number tiles) .
Matrix
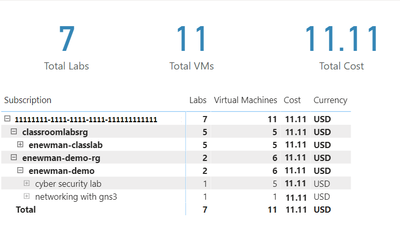
Now let’s create a matrix visual to allow us to drill down into our data. For instructions how to create a matrix visualization, see create a matrix visual in Power BI. For our matrix visualization, we’ll add the Subscription, ResourceGroup, Lab Account, Lab, VirtualMachine for the rows. NumberOfLabs, NumberOfVMs, PreTaxCost and Currency will be our values. Note, for the currency column, the first value for currency will be shown with the matrix is collapsed.
After of renaming the columns for the visuals and applying some theming, our report now looks like the following picture. I’ve expanded the subscription, resource groups and the ‘enewman-demo’ lab account. Under the lab account you can see the two labs and total cost for each lab. As you can see by the plus sign next to the lab’s names, each lab could be expanded to list the virtual machines for the lab as well as the cost for each virtual machine.

Publish the data
Last step is to publish the report! See publish datasets and reports from Power BI Desktop for further instructions.
Happing Reporting!
The Lab Services Team
by Scott Muniz | Aug 18, 2021 | Security, Technology
This article is contributed. See the original author and article here.
Mozilla has released security updates to address vulnerabilities in Firefox 91.0.1 and Thunderbird 91.0.1. An attacker could exploit some of these vulnerabilities to take control of an affected system.
CISA encourages users and administrators to review Mozilla Security Advisory 2021-37 and apply the necessary updates.

Recent Comments