by Contributed | Sep 13, 2021 | Technology
This article is contributed. See the original author and article here.
Today, we are excited to announce the integration of the Dynatrace Software Intelligence Platform in Azure Spring Cloud.
Over the past 18 months, we worked with many enterprise customers to learn about the scenarios they face. Many of these customers have thousands of Spring Boot applications running in on-premises data centers. As they migrate these applications to the cloud, they need to instrument them for application performance monitoring (APM) using solutions their developers are familiar with and have been using for years. In addition, they must ensure continuity for desktop and mobile applications that are already pre-instrumented for end-to-end monitoring using agents like Dynatrace OneAgent, which automatically discovers and maps all applications, microservices, and infrastructure as well as any dependencies in dynamic hybrid, multi-cloud environments. With the integration of Dynatrace OneAgent in Azure Spring Cloud, you can continue your journey and easily instrument your Spring Boot applications with Dynatrace.
Continue your Dynatrace journey. Most organizations that deploy Spring Boot applications today share a similar goal: maximize the benefits of running Spring Boot applications at virtually any scale, using automation and APM. While Azure Spring Cloud excels at abstracting away much of the toil associated with managing containerized workloads, the challenge of monitoring and maintaining the performance and health of these applications, or of troubleshooting issues when they occur, can be daunting—especially as organizations deploy these applications at massive scale. To help you succeed and continue your Dynatrace journey, we integrated and upgraded your ability to instrument, monitor and deliver observability using Dynatrace OneAgent across your Azure Spring Cloud instances. That begins with setting up instrumentation quickly and easily. Then you can analyze the performance and health of your applications, JVMs, transactions, and more.
“For Liantis, true hybrid monitoring across both our on-premises and cloud-based Spring Boot microservices is key, but we also require simple and straightforward implementation – which is in line with the true Azure Spring Cloud philosophy of abstracting complexity. Doing so allows Liantis to spend more time on developing innovative applications, rather than building and operating infrastructure, which enables us to deliver true value for our customers and employees. Building on our in-house expertise with both Spring and Dynatrace technology, combined with our previous investments, the Dynatrace integration with Azure Spring Cloud was the obvious choice for Liantis.” — Nicolas Van Kerschaver, CIO, Liantis
“Being able to scale is critical for today’s digital business, as organizations have made the shift to cloud-native workloads and microservices. While cloud-native technologies and microservices have tremendous advantages, dynamic environments bring complexity that makes it difficult to understand the relationships and dependencies across an organization’s cloud ecosystem. Dynatrace’s strategic partnership with Microsoft allows us to extend the impact of our automatic and intelligent observability even further to accelerate digital transformation. Through the Dynatrace integration with Azure Spring Cloud, we are enabling full visibility into application data for Spring Boot applications, which means more time innovating and a better product for end-users.” – Eric Horsman, Global Director of Strategic Alliances, Dynatrace
“At Microsoft, we are committed to helping our customers modernize their applications and innovate faster than ever before. By integrating a software intelligence solution like Dynatrace with Azure Spring Cloud, we can enable our customers with easy implementation of end-to-end observability, including automatic and continuous root-cause analysis, for their Spring Boot applications.” — Julia Liuson, Corporate Vice President, Developer Division, Microsoft
Instrument your Spring Boot applications. Run a “provisioning” automation pipeline for a complete hands-off experience to instrument and monitor any new applications that you create and deploy – using Terraform or ARM Template. Or you can run it on-demand using the Azure CLI for greater flexibility and control.
az spring-cloud app update --name customers-service
      --env DT_TENANT=<your-tenant> DT_TENANTTOKEN=<your-tenant-token>
      DT_CONNECTION_POINT=<your-connection-point>
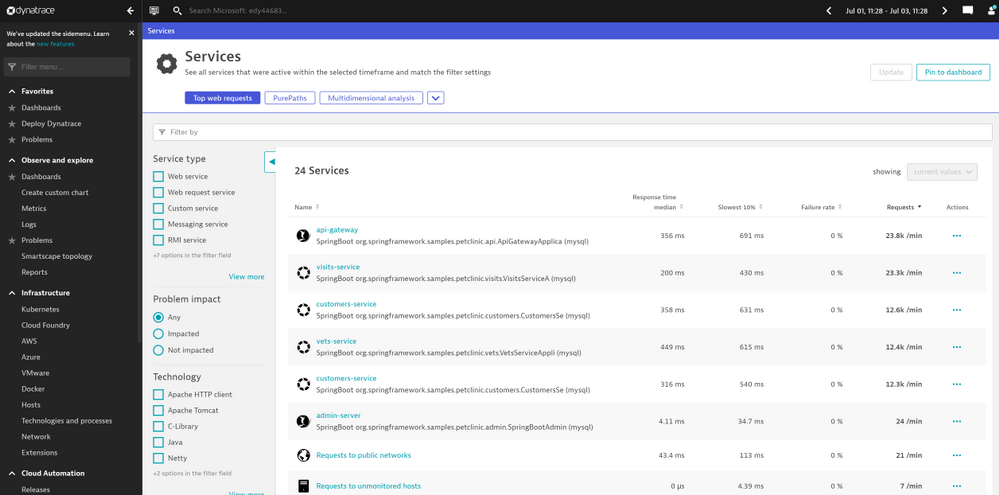
Automatic discovery and mapping of applications and their dependencies. To maintain real-time awareness in dynamic environments, Dynatrace automatically discovers and maps application components (including application servers, frameworks and microservices), databases, messaging and eventing systems, and their relationships. In the view shown below, the Dynatrace Portal shows all the Spring Boot applications running in a production workload.
Screenshot 1 – shows all the Spring Boot applications running in a production workload
End-to-end observability of Spring Boot applications’ complete HTTP/S transactional behavior to understand the effect on business outcomes and user experiences. In the example view below, Dynatrace provides developers with all the transaction traces implemented in code without any code change to applications.

Screenshot 2 – shows transaction traces implemented in code without any code change to applications
Endpoint monitoring, API monitoring, DB calls monitoring, end-user experience monitoring. Dynatrace captures all the database queries initiated by your Spring Boot applications, including Azure database services. In the example view below, Dynatrace Portal shows all the active REST API operations within a production workload.

Screenshot 3 – shows all the active REST API operations within a production workload
In the example view below, the Dynatrace Portal shows all the database queries initiated by a production workload.

Screenshot 4 – shows all the database queries initiated by a production workload
Root-cause and impact analysis of application performance problems and business outcomes for faster, more reliable incident resolution. Dynatrace provides deep-code level visibility with end-to-end traces and the integration provides AI-assisted problem detection and automatic root-cause analysis allowing you to stay on top of your deployments and distinguish between healthy and unhealthy applications.

Screenshot 5 – shows results from stack trace analysis
Detect anomalies in your Spring Boot application instances. Dynatrace passes the collected data through an AI engine for automated root cause analysis, code level hotspot analysis, top database queries, and exception analysis. In the example screenshot below, Dynatrace automatically identifies code modules that are CPU intensive so that you do not have to dig through the data.

Screenshot 6 – code modules that are CPU intensive so that you do not have to dig through the data
You can find all the top database queries initiated, how expensive these queries are, and how many times these queries are called by applications. In the example screenshot below, Dynatrace shows top database queries initiated by a production workload.

Screenshot 7 – shows top database queries initiated by a production workload
All application code level exceptions are logged along with many details into the stack traces of where the exception occurred. In the example screenshot below, Dynatrace portal shows the top exceptions thrown by a production workload.

Screenshot 8 – shows the top exceptions thrown by a production workload
The Dynatrace Software Intelligence Platform automatically baselines all the performance metrics of Spring Boot applications. When the response times of an application increase beyond the auto detected baseline, the platform creates an alert with information like how much response times have breached from baselines. In the example screenshot below, Dynatrace shows response time degradation for a few services in a production workload.

Screenshot 9 – shows response time degradation for a few services in a production workload
Dynatrace gives you insights on what caused these increases in response time, particularly the time taken to make a connection to a database service. In the example below, the Dynatrace portal calls out the time taken to make connections to a database.

Screenshot 10 – shows time taken to make connections to a database
Dynatrace automatically detects all the failures. In the example below, Dynatrace signals an increase in failure rates to reach an external network.

Screenshot 11 – signals an increase in failure rates to reach an external network
Focus on delivering value to your end-users. Once instrumented, as you scale out to multiple Spring Boot application instances, any new application instances are automatically monitored for you. Dynatrace enables application developers to observe Spring Boot applications end-to-end. You spend less time managing the agent installation and maintenance and more energy on identifying and resolving incidents faster. Azure Spring Cloud service is on-point for periodically updating the Dynatrace OneAgent.
Build your solutions and monitor them today!
Azure Spring Cloud is jointly built, operated, and supported by Microsoft and VMware. It is a fully managed service for Spring Boot applications that abstracts away the complexity of infrastructure and Spring Cloud middleware management, so you can focus on building your business logic and let Azure take care of dynamic scaling, patches, security, compliance, and high availability. With a few steps, you can provision Azure Spring Cloud, create applications, deploy, and scale Spring Boot applications and start monitoring in minutes. We will continue to bring more developer-friendly and enterprise-ready features to Azure Spring Cloud.
We would love to hear how you are building impactful solutions using Azure Spring Cloud. Start monitoring your Spring Boot applications with Dynatrace.
Resources
by Contributed | Sep 10, 2021 | Technology
This article is contributed. See the original author and article here.
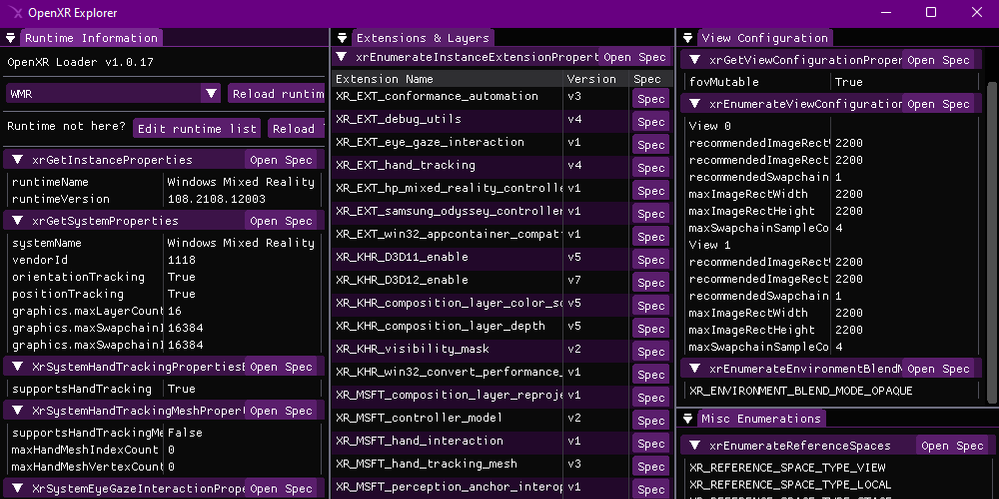
Screenshot of the OpenXR Explorer application.
If you’re a Unity or Unreal developer that’s building an experience atop OpenXR, or a lower level developer that might be interacting with OpenXR directly, then OpenXR Explorer is a tool that may be of interest to you! There are numerous OpenXR runtimes out there, and OpenXR Explorer can help you find your way around each of these separately maintained implementations.
OpenXR Runtimes
OpenXR is unfortunately not a singular library that simply handles all XR headsets, instead it’s a common API that many different companies agree upon and implement. There are currently 5 conformant OpenXR runtimes available on Windows alone! These runtimes do have to pass a conformance test that assures a base level of consistent behavior, and this means that a well designed OpenXR application should run on any OpenXR runtime it encounters on its target platforms!
In reality, this is easier said than done, especially once you consider extensions. Right now, much of the really interesting XR behavior is present in the form of optional OpenXR extensions. For example, XR_MSFT_spatial_anchor is a MSFT extension that’s currently only implemented in Microsoft OpenXR runtimes like Windows Mixed Reality! In time, extensions like these may graduate to KHR extensions, officially recognized by Khronos as a common, yet still optional extension. You can read about how extensions are adopted into the standard over in the spec.
For the thorough developer, this means a lot of testing. And for the developer working directly with OpenXR, understanding what differences to expect can help with designing your code. OpenXR Explorer helps you peek at information provided by each runtime, see the extensions it implements, as well as inspect some common properties and enumerations that can be queried. In addition to this, OpenXR Explorer provides some functionality for easily changing active runtimes, by a visual user interface, or via command line.
Runtime Switching
Each OpenXR runtime has its own way of setting itself as active! This is generally fine for normal users, but as a developer, it can be nice to have some options. On Windows, the active runtime is indicated using a registry key, and while you could modify this directly yourself, OpenXR Explorer provides a simple way to do this with just a click!
 User changing runtime using the OpenXR Explorer GUI
Alternatively, you can use xrsetruntime.exe via the Command Prompt directly. Runtime switching is performed with a separate executable to prevent the main OpenXR Explorer application from requiring admin access to the computer when modifying the OpenXR registry key.
# To list all available OpenXR runtimes
xrsetruntime.exe --list

# From a Command Prompt with Admin permissions
xrsetruntime.exe -WMR
Extensions and Properties
A quick glance at a runtime’s extension support can tell you a lot about what to expect! For example, the Windows Mixed Reality runtime on Windows currently supports the XR_KHR_D3D11_enable and XR_KHR_D3D12_enable extensions, but not XR_KHR_opengl_enable, XR_KHR_vulkan_enable, or XR_KHR_vulkan_enable2. This would be an important thing to know about for a certain subset of developers!
 OpenXR Explorer’s extension view, with links to the spec
OpenXR Explorer can also attempt to spin up an instance of the runtime and query OpenXR for any easily accessible properties it provides. Knowing what the recommended display resolution is, or what type of positioning/reference spaces the runtime supports can also be quite handy! In addition, OpenXR runtimes often list enumerations in order of preference, so it can be quite insightful to see, for example, what swapchain formats are listed towards the top of the enumeration list.
And for those interested in the gritty details about the information they’re seeing, the GUI provides quick links to the relevant portions of the OpenXR specification! The spec is an invaluable resource for the native developer, or those curious about the exact behavior indicated by a particular enumeration.
OpenXR explorer also provides a Command Line Interface that will allow you to gather all the same information via the Command Prompt! When provided command line arguments, OpenXR Explorer will skip the GUI, and just print out information.
# To list what arguments are available
openxr-explorer.exe -help

# To show the runtime's extension list, you can pass in either the name of the
# function, or the structure that contains the data.
openxr-explorer.exe -xrEnumerateInstanceExtensionProperties
# Or
openxr-explorer.exe -XrExtensionProperties
Try it out!
You can download the latest Windows or Linux builds of OpenXR Explorer here. It’s also open source under the MIT license, and you can find the code as well as additional instructions here! We hope you’ll find this tool useful along your OpenXR journey, and welcome any feedback or contributions :)
by Contributed | Sep 10, 2021 | Technology
This article is contributed. See the original author and article here.
Are you looking to validate your applications on Microsoft’s latest Windows Server release? Test Base for Microsoft 365 can help you validate your apps and workloads against the new Windows Server 2022 product.
On Test Base for Microsoft 365, you can have your applications validated against upcoming Windows updates. So, if you are a software vendor or test engineer looking to confirm the compatibility of your applications with upcoming security update releases for Windows Server 2022 or its Server Core version, simply upload your application to our Azure cloud test environment and start testing today!
Not sure how to get started? Check out the step-by-step guide below to find out how to opt in your app for testing.
Not yet using Test Base for Microsoft 365? Sign up today to start using our service.
Upload an application for testing against Windows Server 2022
To get started with validating your applications against pre-release security updates for Windows Server 2022 operating systems on Test Base for Microsoft 365, log on to our self-service onboarding portal.
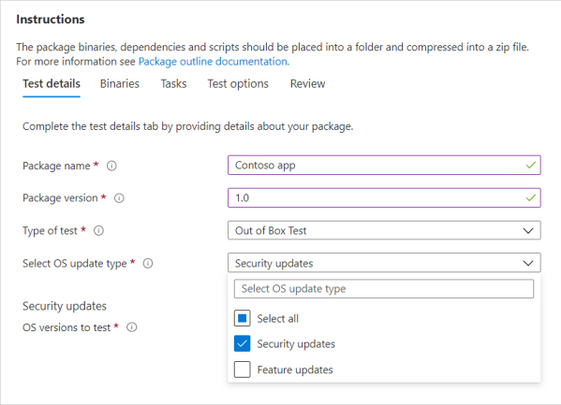
From the left-side navigation menu, select Upload new package under Package catalog and fill out the Test details:
- Select Security updates as the OS update type:
Selecting the OS update type in the Test Base for Microsoft 365 service
Note: We do not support feature update testing for Windows Server at this time.
|
- Under OS versions to test, select Windows Server 2022 and/or the Server Core version. You can also select other applicable Windows Server OS versions or a combination of server and client OS versions.
Note: If you select to test your application against both server and client products, please make sure that the app is compatible and can run seamlessly on both.
|
 Selecting the OS versions for which testing should occur
- Provide other required information, review the details provided, and upload your application package. After uploading, you can view package status on the Manage packages menu tab.
- To view test results and app insights from the validation of your application against pre-release security updates for Windows Server 2022, go to the Test summary page or the Security update results page.
 Locating test summaries and security update test results in Test Base for Microsoft 365
We are continuously gathering and collaborating on feedback to prioritize and improve on the future for Test Base. Email us at testbasepreview@microsoft.com, we look forward to hearing your feedback and comments!
Join the Test Base community
If you are interested in onboarding your applications to Test Base, please sign up today.
We are actively engaging with application developers and enterprise customers now to add more value and help solve additional use cases. We would also like to invite you to come join us on the new Test Base for Microsoft 365 community on Tech Community so you can share your experiences and connect with others using the service.

Recent Comments