
by Contributed | Jan 18, 2023 | Technology
This article is contributed. See the original author and article here.
Postgres is one of the most widely used databases and supports a number of operating systems. When you are writing code for PostgreSQL, it’s easy to test your changes locally, but it can be cumbersome to test it on all operating systems. A lot of times, you may encounter failures across platforms and it can get confusing to move forward while debugging. To make the dev/test process easier for you, you can use the Postgres CI.
When you test your changes on CI and see it fail, how do you proceed to debug from there? As a part of our work in the open source Postgres team at Microsoft, we often run into CI failures—and more often than not, the bug is not obvious, and requires further digging into.
In this blog post, you’ll learn about techniques you can use to debug PostgreSQL CI failures faster. We’ll be discussing these 4 tips in detail:
Before diving into each of these tips, let’s discuss some basics about how Postgres CI works.
Introduction to the PostgreSQL CI
PostgreSQL uses Cirrus CI for its continuous integration testing. To use it for your changes, Cirrus CI should be enabled on your GitHub fork. The details on how to do this are in my colleague Melih Mutlu’s blog post about how to enable the Postgres CI. When a commit is pushed after enabling CI; you can track and see the results of the CI run on the Cirrus CI website. You can also track it in the “Checks” GitHub tab.
Cirrus CI works by reading a .cirrus.yml file from the Postgres codebase to understand the configuration with which a test should be run. Before we discuss how to make changes to this file to debug further, let’s understand its basic structure:
# A sequence of instructions to execute and
# an execution environment to execute these instructions in
task:
  # Name of the CI task
  name: Postgres CI Blog Post

  # Container where CI will run
  container:
    # Container configuration
    image: debian:latest
    cpu: 4
    memory: 12G

  # Where environment variables are configured
  env:
    POST_TYPE: blog
    FILE_NAME: blog.txt

  # {script_name}_script: Instruction to execute commands
  print_post_type_script:
    # command to run at script instruction
    - echo "Will print POST_TYPE to the file"
    - echo "This post's type is ${POST_TYPE}" > ${FILE_NAME}

  # {artifacts_name}_artifacts: Instruction to store files and expose them in the UI for downloading later
  blog_artifacts:
    # Path of files which should be relative to Cirrus CI’s working directory
    paths:
      - "${FILE_NAME}"
    # Type of the files that will be stored
    type: text/plain
 Figure 1: Screenshot of the Cirrus CI task run page. You can see that it run script and artifacts instructions correctly.
 Figure 2: Screenshot of the log file on Cirrus CI. The gathered log file is uploaded to the Cirrus CI.
As you can see, the echo commands are run at script instruction. Environment variables are configured and used in the same script instruction. Lastly, the blog.txt file is gathered and uploaded to Cirrus CI. Now that we understand basic structure, let’s discuss some tips you can follow when you see CI failures.
Tip #1: Connect to the CI environment with a terminal
When Postgres is working on your local machine but you see failures on CI, it’s generally helpful to connect to the environment where it fails and check what is wrong.
You can achieve easily that using the RE-RUN with terminal button on the CI. Also, typically, a CI run can take time as it needs to find available resources to start and rerun instructions. However, thanks to this option, that time is saved as the resources are already allocated.
After the CI’s task run is finished, there is a RE-RUN button on the task’s page.
 Figure 3: There is an arrow on the right of the RE-RUN button, if you press it the “Re-Run with Terminal Access” button will appear.
You may not have noticed it before, but there is a small arrow on the right of the RE-RUN button. When you click this arrow, the “Re-Run with Terminal Access” button will appear. When this button is clicked, the task will start to re-run and shortly after you will see the Cirrus terminal. With the help of this terminal, you can run commands on the CI environment where your task is running. You can get information from the environment, change configurations and re-test your task.
Note that the re-run with terminal option is not available for Windows yet, but there is ongoing work to support it.
Tip #2: Enable build-time debug options and use them on CI
Postgres and meson provide additional build-time debug options to generate more information to find the root cause of certain types of errors. Some examples of build options which might be useful to set are:
-Dcassert=true [defaults to false]: Turns on various assertion checks. This is a debugging aid. If you are experiencing strange problems or crashes you might want to turn this on, as it might expose programming mistakes.
-Dbuildtype=debug [defaults to debug]: Turns on basic warnings and debug information and disables compiler optimizations.
-Dwerror=true [defaults to false]: Treat warnings as errors.
-Derrorlogs=true [defaults to true]: Whether to print the logs from failing tests.
While building Postgres with meson, these options can be setup using the meson setup [] [] or the meson configure commands.
These options can either be enabled with the “re-running with terminal access” option or by editing the cirrus.yml config file. Cirrus CI has a script instruction in the .cirrus.yml file to execute a script. These debug options could be added to the script instructions in which meson is configured. For example:
configure_script: |
  su postgres <<-EOF
    meson setup
      -Dbuildtype=debug
      -Dwerror=true
      -Derrorlogs=true
      -Dcassert=true
      ${LINUX_MESON_FEATURES}
      -DPG_TEST_EXTRA="$PG_TEST_EXTRA"
      build
  EOF
Once it’s written as such, the debug options will be activated next time CI runs. Then, you can check again if the build fails and investigate the logs in a more detailed manner. You may also want to store these logs to work on them later. To gather the logs and store them, you can follow the tip below.
Tip #3: Gathering Postgres logs and other files from CI runs
Cirrus CI has an artifact instruction to store files and expose them in the UI for downloading later. This can be useful for analyzing test or debug output offline. By default, Postgres’ CI configuration gathers log, diff, regress log, and meson’s build files—as can be seen below:
testrun_artifacts:
  paths:
    - "build*/testrun/**/*.log"
    - "build*/testrun/**/*.diffs"
    - "build*/testrun/**/regress_log_*"
  type: text/plain

meson_log_artifacts:
  path: "build*/meson
If there are other files that need to be gathered, another artifact instruction could be written or the current artifact instruction could be updated at the .cirrus.yml file. For example, if you want to collect the docs to review or share with others offline, you can add the instructions below to the task in the .cirrus.yml file.
configure_script: su postgres -c 'meson setup build'

build_docs_script: |
  su postgres <<-EOF
    cd build
    ninja docs
  EOF

docs_artifacts:
  path: build/doc/src/sgml/html/*.html
  type: text/html
Then, collected logs will be available in the Cirrus CI website in html format.
 Figure 4: Screenshot of the uploaded logs on the Cirrus CI task run page. Logs are uploaded to the Cirrus CI and reachable from the task run page.
Tip #4: Running specific commands on failure
Apart from the tips mentioned above, here is another tip you might find helpful. At times, we want to run some commands only when we come across a failure. This might be to avoid unnecessary logging and make CI runs faster for successful builds. For example, you may want to gather the logs and stack traces only when there is a test failure. The on_failure instruction helps to run certain commands only in case of an error.
on_failure:
  testrun_artifacts:
    paths:
      - "build*/testrun/**/*.log"
      - "build*/testrun/**/*.diffs"
      - "build*/testrun/**/regress_log_*"
    type: text/plain

  meson_log_artifacts:
    path: "build*/meson-logs/*.txt"
    type: text/plain
As an example, in the above, the logs are gathered only in case of a failure.
Making Postgres Debugging Easier with CI
While working on multi-platform databases like Postgres, debugging issues can often be difficult. Postgres CI makes it easier to catch and solve errors since you can work on and test your changes on various settings and platforms. In fact, Postgres automatically runs CI on every commitfest entry via Cfbot to catch errors and report them.
These 4 tips for debugging CI failures should help you speed up your dev/test workflows as you develop Postgres. Remember to use the terminal to connect CI environment, gather logs and files from CI runs, use build options on CI, and run specific commands on failure. I hope these tips will make Postgres development easier for you!
by Scott Muniz | Jan 18, 2023 | Security, Technology
This article is contributed. See the original author and article here.
Mozilla has released security updates to address vulnerabilities in Firefox ESR and Firefox. An attacker could exploit some of these vulnerabilities to take control of an affected system.
CISA encourages users and administrators to review Mozilla’s security advisories for Firefox ESR 102.7 and Firefox 109 for more information and apply the necessary updates.
by Scott Muniz | Jan 17, 2023 | Security, Technology
This article is contributed. See the original author and article here.
CISA has added one new vulnerability to its Known Exploited Vulnerabilities Catalog, based on evidence of active exploitation. This type of vulnerability is a frequent attack vector for malicious cyber actors and poses a significant risk to the federal enterprise. Note: To view the newly added vulnerabilities in the catalog, click on the arrow in the “Date Added to Catalog” column, which will sort by descending dates.
Binding Operational Directive (BOD) 22-01: Reducing the Significant Risk of Known Exploited Vulnerabilities established the Known Exploited Vulnerabilities Catalog as a living list of known CVEs that carry significant risk to the federal enterprise. BOD 22-01 requires FCEB agencies to remediate identified vulnerabilities by the due date to protect FCEB networks against active threats. See the BOD 22-01 Fact Sheet for more information.
Although BOD 22-01 only applies to FCEB agencies, CISA strongly urges all organizations to reduce their exposure to cyberattacks by prioritizing timely remediation of Catalog vulnerabilities as part of their vulnerability management practice. CISA will continue to add vulnerabilities to the Catalog that meet the specified criteria.
by Contributed | Jan 17, 2023 | Technology
This article is contributed. See the original author and article here.
Authentication is a key step in the user journey of any application. Going about designing the authentication flow can be confusing and not straightforward. When load testing an application, this generally is the first step in the user journey. Supplying client credentials through a UI is not possible when load testing an application, so is evaluating how to implement specific authentication flows available on Azure, as they can be tedious and time consuming as well.
Within this series, we will cover the authentication flows and scenarios that are possible with Azure Active Directory (Azure AD) as the identity provider.
At the end of the blog, you will be able to
- Use Azure AD to Authenticate a web application hosted on Azure App Service using the client credential grant flow.
- Parametrize the client credentials in JMeter to retrieve them at run-time in Azure Load Testing.
Prerequisites
- A webapp with authentication enabled with Azure AD.
- An Azure Load Testing resource.
- Azure key vault for storing secrets.
- Azure Load Testing resource configured to fetch the secrets during runtime. Visit here to learn how to do it.
- JMeter
Authenticating to your web app with a shared secret
When you are using a shared secret to authenticate to an application on, you essentially pose yourself as a trusted principal with a valid token that can be used to authenticate you to the application which is registered with azure active directory. The token helps establish a trust, that you can access and make modifications to the resource (application).
- To get the access token from Azure AD, we need to pass 4 parameters to get the access token:
- client_id
- client_secret
- grant_type
- and the tenant_id
For more information you can see authentication using shared secret
- Retrieve client_id, tenant_id for the app registered with Azure AD by going to Azure Active Directory >>App Registrations >>Overview on the azure portal.
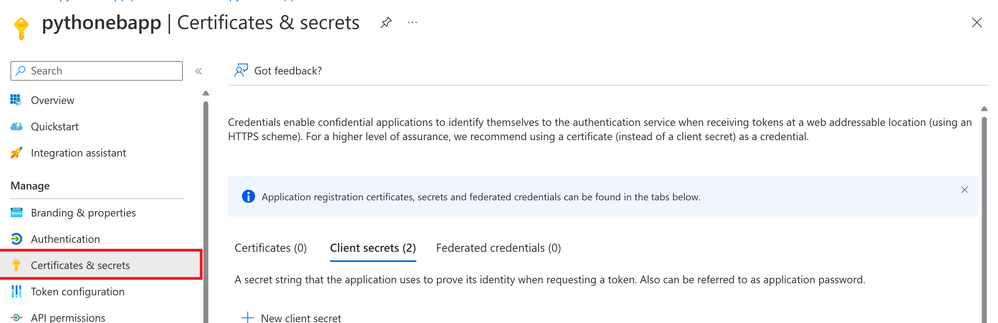
- Retrieve the client_secret for the app by clicking on Certificate & secrets >> Client Secrets
The best practice is to store the above parameters into Azure Key Vault and then fetch them directly at runtime instead of hard coding them into the script.
Fetching the client secret
Configuring the JMeter test plan
The JMeter test plan needs to be configured to make a request to the app’s authentication endpoint to acquire the token. The endpoint can be found by visiting Azure Portal and navigating to Azure Active Directory > App registrations > > Endpoints
 Getting the Authentication endpoint
It would look something as below:
https://login.microsoftonline.com//oauth2/token
For the allowed values of you may refer to issuer values. In our case, it would be the tenant id.
Once we have the token, we can pass it to the subsequent requests in the authorization header to authenticate to the application.
Now that we know what needs to be done, let’s start implementing it.
Creating the test plan in the JMeter GUI
- Start by adding two thread groups, (Authentication) one for fetching the bearer token and the other (Application) to access the landing page of the application.
- Add an environment variable element to the Authentication thread group. This environment variable will be used to fetch the values of fields like client_id, client_secret and tenant_id which we stored earlier in the key vault at runtime to help acquire the access token.
 Defining used defined variable
- Add a child HTTP request sampler (Token Request) to the Authentication thread group. Within this HTTP request we will setup a post method that will help retrieve the access token.
 Defining the POST method to get access token
- Add two child post processor elements to the Token Request sampler, one JSON Extractor (Extract Auth Token) for extracting the token. The response from the Token Request HTTP sampler comes back as a JSON response and we extract the token using the expression $.access_token .
 Extracting Authentication token
- The next post processor element would be JSR223(Set AuthToken), which will be used to set the token extracted as a property named access_token. Setting it as a property will allow the variable to be accessible globally across samplers and hence can be accessed by the next thread group.
 Setting property as an access token property
- Next, let’s configure the application landing page (Homepage) to access the application homepage. Add a child element a header manager, to configure and maintain the header to be passed with the request. In this case we only pass the authorization header that would contain the bearer token obtained from the previous thread group (Authentication).
 Configuring the header manager
Creating and Running the Load Test
Once we have setup our JMeter test plan, now we can move ahead and run the same using the azure load testing service by creating a test, supplying the above created JMeter script as the test plan and configuring the environment variables.
- Supply the JMeter test plan (JMX file) we created in the previous section.
 Configuring the Test Plan
- Configure the Secrets section within the Parameters tab. We have stored all the sensitive information in the key vault. We would need to configure our tests to fetch those at runtime. Visit how to parameterize load tests to know more.
 Configuring the secrets
Try this out and let us know if it works for you. Please use the comments section to help us with any feedback around this scenario and anything you would like to see next time.
If you have any feedback on Azure Load Testing, let us know using our feedback forum.
Happy Load Testing!!!
by Contributed | Jan 16, 2023 | Technology
This article is contributed. See the original author and article here.
As a security analyst or incident responder, you not only want to closely observe everything happening in an environment, but also react quickly and efficiently once malicious activity is detected. While Microsoft 365 Defender has powerful detection capabilities, it also provides response actions at the file, device and user level, that can be triggered both manually and automatically.
During widespread security incidents, where threat containment is the number one priority, actions must be taken on multiple entities based on specific criteria. The ability to perform these actions quickly, ensures a timely response to threats and saves precious analyst and responder time.
Examples of such actions could be performing an antivirus scan of all devices with a certain file hash present, isolating all compromised devices based on an IR report provided as CSV, or tagging all devices running vulnerable version of software X. After these actions are performed, it is always nice to have some change log.
For some of the scenarios above, you may need to operate beyond the Microsoft 365 Defender user interface, and this is where automation with API comes in handy. Using the API and a programming language of your choice, you can make yourself a simple yet effective tool for taking actions on multiple entities based on the criteria selected from your incident investigation.
Microsoft 365 Defender has a rich and growing set of APIs. These APIs help you automate workflows and make full use of Microsoft 365 Defender capabilities. A feature-rich schema helps SOC and IR teams perform integrations and enable automation in their processes. For example, Security Operations Center (SOC) can leverage Machine Actions resource type to take actions on devices. These actions include Isolate, Run AV Scan, Restrict App Execution, or programmatically run Live Response sessions.
This blog post walks through a simple response tool that benefits from APIs and are using PowerShell as the tool of choice to perform actions in bulk. It doesn’t require installation and can easily be adapted by anyone with some scripting experience. In addition, PowerShell is a cross-platform language makes it easier for anyone to port to their platform of choice with minimal to no changes in the code.
To begin, we need access to the Microsoft 365 Defender API. Check out the following getting started guide which describes how to create an application, an application secret, and grant access to required APIs. You will need to follow the documentation on creating a new AppID and Secret and then make sure you provide the following App Permissions to your App.
Permission name
|
Description
|
AdvancedQuery.Read.All
|
Run advanced queries
|
Machine.Isolate
|
Isolate the device
|
Machine.ReadWrite.All
|
Read and write all device information (used for tagging)
|
Machine.Scan
|
Scan the device
|
Table 1: API permissions used by application.
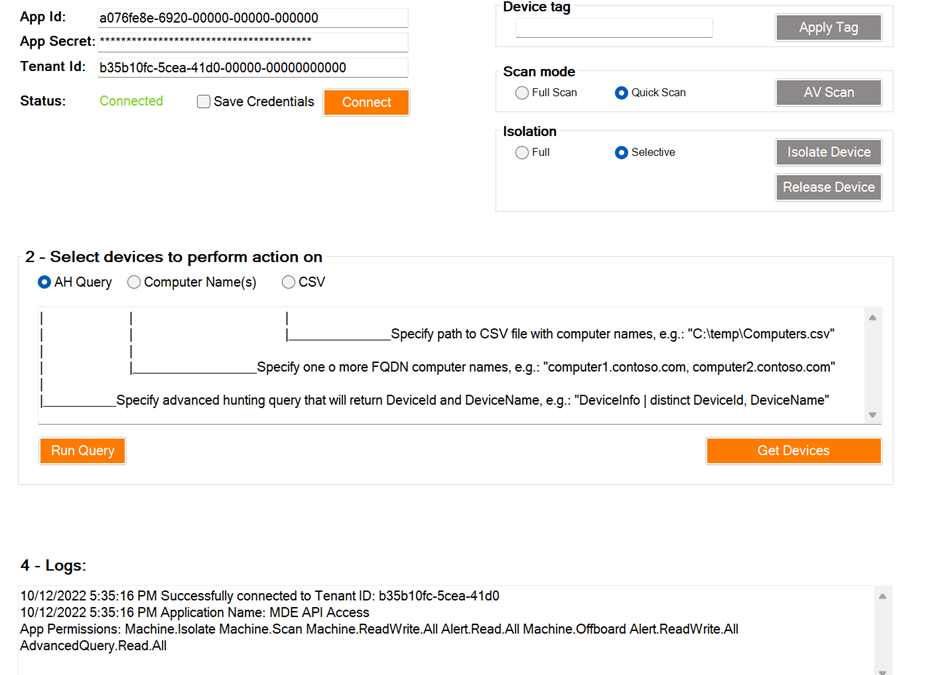
This API-based tool has a simple PowerShell GUI with a series of numbered steps that’s intuitive to use.
- Specify application credentials created above and connect.
- Get devices on which you want to perform an action.
- Tag/Scan/Isolate all the selected devices.
- Export the log of all actions performed (if needed).
 Figure 2: MDE API GUI tool interface
The tool currently accepts advanced hunting queries, computer names, and CSVs as device input methods. Once devices are selected, three types of actions can be performed:
- Tagging devices
- Performing Quick/Full AV scan, and
- Performing Isolation/Release from Isolation
The main benefit of a tool like this is the ability to perform actions in bulk and save time as a result. For example, a simple task of manually tagging 100 servers can take a lot of time using the security portal, especially if servers don’t share a common naming scheme. Instead, when using APIs it can be done in minutes. API usage also provides granular delegation capabilities. For example, a subset of users can be delegated an ability to run AV scans on devices even without having access to a portal.
In the screenshot below, you can see how all the devices running a vulnerable version of software can be quickly identified in the organization, scanned, and tagged while corresponding teams are busy installing patches.
 Figure 3: Performing actions on devices running vulnerable version of software
Currently the tool covers response actions against devices, but it can be further updated to support other response actions on files, users, and more. It can also be upgraded with user authentication to be better suited for enterprise usage and can be extended for many other scenarios that might be unique for your own team. We are releasing our code on GitHub so anyone can use it, contribute, fork it, and extend it but most importantly, share your feedback and your scenarios.
The is an impactful enabler for security teams looking for alternative ways to complete their tasks or integrate with other tools. The built-in API Explorer can be used to explore various APIs interactively and the tool we described in that blog and just released on GitHub can be used as a starting point or inspiration for building your own toolset.
More information
To learn more about the APIs in Microsoft 365 Defender, check out our documentation.
Timur Engin @timurengi contributed to this article.

Recent Comments