by Contributed | Feb 20, 2023 | Technology
This article is contributed. See the original author and article here.
Have you heard about AI or specific terms like ChatGPT or OpenAI?
You might even have formed an opinion whether to allow it or not for your students.
> But have you thought about it for your own part, what you could use it for?
In this article, we explore a specific use case, generating a summary for a course, something that takes time to do as you need to write the text, find proper links and other things. Let’s be honest, you love teaching, and this is just boring “admin” work.
References:
– What is Azure OpenAI Service? – Azure Cognitive Services | Microsoft Learn
– Introduction to Azure OpenAI Service – Training | Microsoft Learn
– OpenAI API playground
Create the course summary
Let’s pick a subject to teach, “causation algorithms” and next let’s decide on some reasonable prompts that we will ask our Open AI about:
Prompt: describe why causation algorithms is so interesting compared to correlation-based ones
OpenAI output:
Causation algorithms are gaining more attention due to their ability to identify the causal relationships between two or more variables. Unlike correlation-based algorithms, which merely measure the strength of the association between two variables, causation algorithms can determine the cause-and-effect relationship between those variables. This is a powerful tool for predictive analysis, as it allows for the identification of factors that lead to a certain outcome and the development of strategies to influence that outcome. In other words, causation algorithms can provide a much more sophisticated level of insight into a data set than correlation-based algorithms.
Prompt: write me a 500 word article explaining causation algorithms for beginners
OpenAI Output:
Causation algorithms are a type of machine learning algorithm that uses statistical techniques to evaluate causal relationships between two or more variables. They are becoming increasingly popular in the world of data science because of their ability to make predictions about the future based on past data. Causal algorithms are used to identify patterns in datasets and then use those patterns to make predictions about future events.
In order to understand how causation algorithms work, it is important to understand the concept of causality. Causality is the relationship between two events, where one event causes the other to happen. For example, if the weather is hot, then the ice cream sales in the store will likely increase. In this case, the hot weather is the cause and the increased ice cream sales is the effect.
Causation algorithms use advanced statistical techniques to identify these causal relationships in datasets. They can look at data from a variety of sources such as weather data, economic data, and customer data to identify patterns and then use those patterns to make predictions. For example, a causation algorithm could look at past sales data and weather data and then make a prediction about future sales based on the relationship between the two datasets.
Causation algorithms can be used for a variety of purposes. They can be used to identify patterns in customer data to better understand consumer behavior. They can also be used to predict future trends in the stock market or in the economy. They can even be used to predict the success of a new product before it is released.
In order for causation algorithms to make accurate predictions, they need to be trained with large amounts of data. This is where machine learning comes in. Machine learning is a type of artificial intelligence that uses algorithms to learn from data and then use that data to make predictions. By training causation algorithms with large datasets, they can become more accurate in their predictions.
Causation algorithms are a powerful tool that can be used to make predictions about the future.
prompt: suggest me some good exercises on causation algorithms
OpenAI Output:
- Create a program that simulates a decision tree.
- Create a program that implements a Naive Bayes classifier.
- Create a program that implements a Markov Decision Process.
- Develop a program that implements a logistic regression classifier.
- Create a program that implements a reinforcement learning algorithm.
- Develop a program that uses Bayesian networks to make predictions.
- Create a program that implements a Hidden Markov Model.
- Build a program that uses a Monte Carlo simulation to predict outcomes.
- Develop a program that uses a Genetic Algorithm to optimize a solution.
- Create a program that uses a neural network to solve a problem.
prompt: show me some references on causation algorithms either research papers or books
OpenAI Output:
- Causality: Models, Reasoning, and Inference, Judea Pearl (2000)
- Algorithmic Learning Theory, Eyke Hüllermeier (2006)
- Causal Inference in Statistics: A Primer, Judea Pearl (2009)
- Causality: Philosophical Theory Meets Scientific Practice, Kevin Hoover (2009)
- Causality and Prediction in Economics, Marc R. Reinganum (2011)
- Understanding Causality: From Probabilistic Graphical Models to Causal Networks, Judith M. Rolfe and David C. Hogg (2013)
- Causal Inference in Statistics: A Primer, Pearl, J. (2016)
- Causality in Statistics, Thomas S. Richardson and Vincent Dorie (2017)
- Causality: A Very Short Introduction, Stephen Mumford (2018)
Great, we have some raw data at this point that we can assess. However, we still need to check for correctness and that is sounds good, but this was a lot of help in just seconds right?
Editorial
Next, let’s do some editorial by assigning some reasonable headers and see if we want to adjust the text somewhat.
Why Causation algorithms is such an interesting area right now
Causation algorithms are gaining more attention due to their ability to identify the causal relationships between two or more variables. Unlike correlation-based algorithms, which merely measure the strength of the association between two variables, causation algorithms can determine the cause-and-effect relationship between those variables. This is a powerful tool for predictive analysis, as it allows for the identification of factors that lead to a certain outcome and the development of strategies to influence that outcome. In other words, causation algorithms can provide a much more sophisticated level of insight into a data set than correlation-based algorithms.
What is Causation algorithms
Causation algorithms are a type of machine learning algorithm that uses statistical techniques to evaluate causal relationships between two or more variables. They are becoming increasingly popular in the world of data science because of their ability to make predictions about the future based on past data. Causal algorithms are used to identify patterns in datasets and then use those patterns to make predictions about future events.
In order to understand how causation algorithms work, it is important to understand the concept of causality. Causality is the relationship between two events, where one event causes the other to happen. For example, if the weather is hot, then the ice cream sales in the store will likely increase. In this case, the hot weather is the cause and the increased ice cream sales is the effect.
Causation algorithms use advanced statistical techniques to identify these causal relationships in datasets. They can look at data from a variety of sources such as weather data, economic data, and customer data to identify patterns and then use those patterns to make predictions. For example, a causation algorithm could look at past sales data and weather data and then make a prediction about future sales based on the relationship between the two datasets.
Causation algorithms can be used for a variety of purposes. They can be used to identify patterns in customer data to better understand consumer behavior. They can also be used to predict future trends in the stock market or in the economy. They can even be used to predict the success of a new product before it is released.
In order for causation algorithms to make accurate predictions, they need to be trained with large amounts of data. This is where machine learning comes in. Machine learning is a type of artificial intelligence that uses algorithms to learn from data and then use that data to make predictions. By training causation algorithms with large datasets, they can become more accurate in their predictions.
Causation algorithms are a powerful tool that can be used to make predictions about the future.
Some problems we will study throughout the course
- Create a program that simulates a decision tree.
- Create a program that implements a Naive Bayes classifier.
- Create a program that implements a Markov Decision Process.
- Develop a program that implements a logistic regression classifier.
- Create a program that implements a reinforcement learning algorithm.
- Develop a program that uses Bayesian networks to make predictions.
- Create a program that implements a Hidden Markov Model.
- Build a program that uses a Monte Carlo simulation to predict outcomes.
- Develop a program that uses a Genetic Algorithm to optimize a solution.
- Create a program that uses a neural network to solve a problem.
Syllabus
- Causality: Models, Reasoning, and Inference, Judea Pearl (2000)
- Algorithmic Learning Theory, Eyke Hüllermeier (2006)
- Causal Inference in Statistics: A Primer, Judea Pearl (2009)
- Causality: Philosophical Theory Meets Scientific Practice, Kevin Hoover (2009)
- Causality and Prediction in Economics, Marc R. Reinganum (2011)
- Understanding Causality: From Probabilistic Graphical Models to Causal Networks, Judith M. Rolfe and David C. Hogg (2013)
- Causal Inference in Statistics: A Primer, Pearl, J. (2016)
- Causality in Statistics, Thomas S. Richardson and Vincent Dorie (2017)
- Causality: A Very Short Introduction, Stephen Mumford (2018)
There you have it, a course summary. Depending on what you’re trying to create, you might need to undertake some verification on the output and some additional editorial. Hopefully, you’ve seen the potential of this powerful tool, what you as an educator can use it for.
by Contributed | Feb 18, 2023 | Technology
This article is contributed. See the original author and article here.
Pair programming is a software development technique in which two developers work together on the same code at the same time, with one typing and the other reviewing and offering suggestions. This technique can increase productivity and promote knowledge sharing, as well as improve code quality through increased collaboration and code review.
Test-driven development (TDD) is a software development process in which tests are written before writing the actual code. The tests serve as a guide for the development process and help ensure that the code meets the requirements and behaves as expected. The TDD cycle consists of writing a test, running it to see if it fails, writing the minimum amount of code needed to make the test pass, and then repeating this process until all tests pass and the code is complete.
GitHub Copilot is a tool that can be used to support pair programming and TDD. It allows developers to collaborate in real-time on the same codebase and provides an environment for running tests and code review. This can help teams work more efficiently and effectively, especially for remote teams who may be working from different locations. Additionally, Copilot can also assist with automated code suggestions and recommendations based on best practices, further improving code quality and efficiency.
In summary, pair programming and TDD are valuable software development techniques that can enhance the development process, and GitHub Copilot can help teams effectively utilize these practices to produce high-quality code.has context menu
Getting Started
To get started with activating your FREE GitHub Copilot
Download GitHub Copilot for VS Code
Download GitHub Copilot Labs for VS Code
GitHub Copilot is a simple, powerful way to use GitHub for automated, test-driven development. It provides an easy-to-use framework for writing, running, and monitoring tests, as well as an integrated interface for managing the entire development process.
To get started with GitHub Copilot, first create your GitHub account and activate your copilot subscription. Create a new repository in GitHub and add the Copilot extension, then, create your test files and add code to run the tests many academic institutions introduce test driven development in classes which use pair programming.
Pair programming is a popular Agile technique that involves two developers working on the same piece of functionality together. In many cases this is used in lab exercises to help student identify bugs and gain understanding of reading and documenting codes bases.
The benefits of pair programming include:
- Quality of produced code should be higher as two developers have been involved and verified code.
- Increased awareness and understanding of the codebase across the team which leads to improved experiences and documentation.
- Skilling and sharing of best practices which lead to higher quality and greater collaboration.
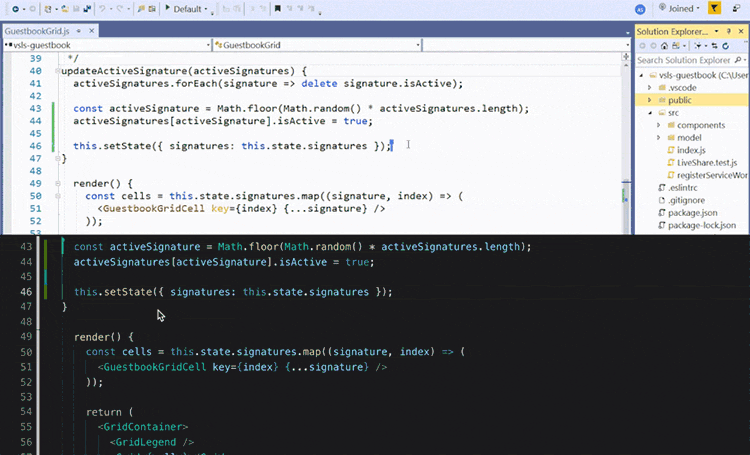
During COVID many courses lost the opportunity of students being with other students in the same room looking at the same screen, thankfully tools like VSCode LiveShare faciliated students to keep pair programming and allowed students to communicate not only screen share but also via voice.
Allowing students to give peer feedback on code, discover underlying issues, and support the coder/driver in successful development.
Many benefits of pair programming are only seen when it’s done as a collaborative team effort. On the other hand, artificial intelligence may potentially give you a real virtual tutor or assistant. We have found GitHub Copilot works really well at increasing your productivity, and also helping.
How to generate tests and test data
Students often need to think of sample data for your tests, documentation, or default settings. In many cases this results in a burden for the course tutor or academic to validate the data or in some case even produce the sample data sets.
GitHub Copilot is an amazing support asset. For example, your student need a set of personnal data record for there application development.
The task set has a Person class:
from dataclasses import dataclass

from datetime import date
@dataclass

class Customers:

    first_name: string

    last_name: string

    birth_date: date
    def age(self):

        return (date.today() – self.birth_date).days // 365
    @property

    def full_name(self):

        return f“{self.first_name} {self.last_name}“
What you now need is a selection of data for this class did you know you can used GitHub Copilot to populate a list of Sales details.
So if your starting from nothing you can simply ask copilot to create a data set.
// create me a list of people based on first_name:string, last_name:string, birth_date:date
Sales = [
    { “first_name”: “John”, “last_name”: “Doe”, “birth_date”: “1970-01-01” },
    { “first_name”: “Jane”, “last_name”: “Doe”, “birth_date”: “1970-01-02” },
    { “first_name”: “John”, “last_name”: “Smith”, “birth_date”: “1970-01-03” },
    { “first_name”: “Jane”, “last_name”: “Smith”, “birth_date”: “1970-01-04” },
    { “first_name”: “John”, “last_name”: “Doe”, “birthdate”: “1970-01-05” },
    { “first_name”: “Jane”, “last_name”: “Doe”, “birthdate”: “1970-01-06” },
    { “first_name”: “John”, “last_name”: “Smith”, “birthdate”: “1970-01-07” },
]
GitHub Copilot successfully figured out to use your Person class for the Sales list elements.
If you all ready have the reference code, you simply need to Declare an empty Python list using an expressive variable name, and hit Enter just after the opening square bracket ([) to trigger the suggestions:
As you keep hitting Tab after each suggested line, you might end up with the following list of employees: and then close ]
Creating a Test Driven Development
You can use that list as a common test fixture for a group of test cases that require it. GitHub Copilot can be an excellent help in the testing process itself by suggesting both tests and the code under test.
Exercise Test-Driven Development (TDD)
Briefly, the TDD process:
- Write a failing test case that you have too satisfy
- Implement the smallest amount of code to make your test case pass
- Optionally, refactor the code while all your test cases are still passing
- Then, rinse and repeat!
- As long as you’re disciplined enough to stay in this perpetual cycle, you’ll write testable code that has high test coverage and documents itself.
So an example we want to create and test a HashTable implementation, using GitHub Copilot as your virtual pair programmer?
Step 1. Create two empty Python files next to each other in the same folder:
src/

├── hashtable.py

└── test_hashtable.py
The hashtable.py code under test. The test_hashtable.py is the home of your test cases driving the implementation.

Automation of TDD
Once you have set up your tests, you can use the Copilot interface to manage and monitor your testing process. This includes running tests, viewing results, and tracking progress. GitHub Copilot also integrates with popular continuous integration (CI) tools like Jenkins, Travis CI, and CircleCI, allowing you to easily integrate tests into your development workflow.
To help ensure that your tests are up-to-date, Copilot can be configured to run automatically on a regular basis, such as after each commit or nightly. This helps keep your tests and code in sync and ensures that any bug fixes are applied quickly.
Conclusion
There are several reasons why students should use GitHub Copilot for TDD and virtual pair programming:
- Improved Code Quality: By incorporating TDD and pair programming into the development process, students can ensure that their code meets the requirements and behaves as expected. They can also catch and fix any bugs or issues early on in the development process.
- Enhanced Collaboration: GitHub Copilot provides an environment for real-time collaboration, allowing students to work together on the same codebase and share ideas and knowledge with each other. This can lead to a more efficient development process and can help students learn from each other.
- Remote Work Support: With the increasing popularity of remote work, virtual pair programming has become an important tool for development teams. GitHub Copilot allows students to work together, even when they are in different locations, which can help them collaborate effectively and build a better understanding of each other’s strengths and weaknesses.
- Automated Code Suggestions: GitHub Copilot provides automated code suggestions and recommendations based on best practices, which can help students write better code and improve their coding skills.
- Real-World Experience: Using GitHub Copilot for TDD and virtual pair programming gives students a taste of what it’s like to work on real-world software development projects. Students can apply the skills they’ve learned in the classroom to real-world situations and gain hands-on experience.
GitHub Copilot is a great tool for developers who want to take advantage of test-driven development and automated testing. It provides an easy-to-use interface and powerful features to help developers quickly and easily create, run, and monitor tests. Copilot is FREE for students and educators and enables educators and students to practice and improve their TDD and pair programming skills, which can help them build better software and enhance their career prospects.
by Contributed | Feb 17, 2023 | Technology
This article is contributed. See the original author and article here.
Introduction
Hi folks! My name is Felipe Binotto, Cloud Solution Architect, based in Australia.
We all know how frustrating it can be to receive a call about a storage account not replicating or being unable to fail over. To help prevent this from happening, I am going to show you how to monitor the replication of your storage accounts. Keep in mind that replication logs are not available as part of the storage account’s diagnostic settings.
Pre-Requisites
Before we begin, please ensure that you have the following prerequisites in place:
- Azure Subscription
- Automation Account
- Log Analytics workspace
High-Level Steps
The process for monitoring storage account replication can be broken down into several high-level steps, which we will go through in the following order:
- Clone the repository that contains the runbook.
- Create a user-assigned managed identity.
- Provide the identity with the necessary access.
- Assign the identity to the Automation Account.
- Import the runbook to the Automation Account.
- Provide values for the Runbook variables.
- Create a new Automation Account variable.
- Run the runbook to retrieve the storage account replication information.
Getting Started
Clone the repo by running the following command:
git clone https://github.com/fbinotto/storagereplication.git
Create a new User Managed Assigned Identity.
$id = (New-AzUserAssignedIdentity -Name storagereplication `
-ResourceGroupName REPLACE_WITH_YOUR_RG –Location australiaeast)
Assign the identity Storage Account Contributor rights in your subscription(s) so it can retrieve the replication information from Storage Accounts.
New-AzRoleAssignment -ObjectId $id.PrincipalId `
-RoleDefinitionName 'Storage Account Contributor' `
-Scope /subscriptions/

New-AzRoleAssignment -ObjectId $id.PrincipalId `
-RoleDefinitionName 'Log Analytics Contributor' `
-Scope /subscriptions/
Now assign the identity to the Automation Account.
# Get the automation account
$automationAccount = Get-AzAutomationAccount -ResourceGroupName REPLACE_WITH_YOUR_RG -Name REPLACE_WITH_YOUR_AA

# Assign the identity to the automation account
$automationAccount | Set-AzAutomationAccount -Identity $id
Import the runbook to your automation account. Make sure you run the next command from the folder which was cloned.
Import-AzAutomationRunbook -Path ".storagereplication.ps1" `
-Name StorageReplication –Published:$true `
-ResourceGroupName REPLACE_WITH_YOUR_RG `
-AutomationAccountName  REPLACE_WITH_YOUR_AA -Type PowerShell
Open the script in VS Code or you can edit straight in your automation account. Now I will highlight some of the important sections, so you have a clear understanding of what is going on.
The script is used to collect and send replication logs for Azure Storage Accounts to a Log Analytics workspace. By using this script, you can monitor the replication of your Storage Accounts, so that you can be alerted if there are any issues and act before it becomes a problem.
The script starts by setting some variables, including the ID of the Log Analytics workspace, the primary key for authentication, and the name of the record type that will be created.
The primary key is retrieved from an Automation Account variable, so we don’t expose it in clear text. Run the following command to create the variable.
# Create the encrypted variable
New-AzAutomationEncryptedVariable -AutomationAccountName REPLACE_WITH_YOUR_AA -ResourceGroupName REPLACE_WITH_YOUR_RG -Name SharedKey -Value REPLACE_WITH_YOUR_LOG_ANALYTICS_PRIMARY_KEY
The script then defines two functions: Build-Signature and Post-LogAnalyticsData.
The Build-Signature function creates an authorization signature that will be used to authenticate the request to the Log Analytics API. The function takes in several parameters, including the ID of the Log Analytics workspace, the primary key, the date, the content length, the method, the content type, and the resource.
The Post-LogAnalyticsData function creates and sends the request to the Log Analytics API. This function takes in the ID of the Log Analytics workspace, the primary key, the body of the request (which contains the replication logs), the log type, and the timestamp field.
The script also includes a line of code (Disable-AzContextAutosave) that ensures that the runbook does not inherit an AzContext, which can cause issues when running the script.
Finally, the script calls the Post-LogAnalyticsData function, sending the replication logs to the Log Analytics workspace.
At this point you can run the Runbook. Once the logs have been sent, you can create Azure Alerts based on KQL queries to notify you of any issues with the replication.
For example, the following code would return Storage Accounts which have not replicated in the last 8 hours.
StorageReplicationHealth_CL
| where todatetime(Storage_LastSyncTime_s) < ago(8h)
In Part 2 of this post, I will demonstrate how you can leverage Logic Apps to send out customized emails when your Storage Account is not replicating.
Conclusion
In conclusion, monitoring the replication of your Azure Storage Accounts is crucial to ensure the availability and reliability of your data. In this blog post, we have shown you how to set up monitoring for your Storage Accounts using Log Analytics and Azure Automation. By following the steps outlined in this post and using the provided script, you will be able to monitor the replication status of your Storage Accounts and receive alerts if there are any issues. This will allow you to act quickly and prevent any disruptions to your services. With this solution in place, you can have peace of mind knowing that your data is safe and available.
I hope this was informative to you and thanks for reading!
Disclaimer
The sample scripts are not supported under any Microsoft standard support program or service. The sample scripts are provided AS IS without warranty of any kind. Microsoft further disclaims all implied warranties including, without limitation, any implied warranties of merchantability or of fitness for a particular purpose. The entire risk arising out of the use or performance of the sample scripts and documentation remains with you. In no event shall Microsoft, its authors, or anyone else involved in the creation, production, or delivery of the scripts be liable for any damages whatsoever (including, without limitation, damages for loss of business profits, business interruption, loss of business information, or other pecuniary loss) arising out of the use of or inability to use the sample scripts or documentation, even if Microsoft has been advised of the possibility of such damages.
by Contributed | Feb 17, 2023 | Technology
This article is contributed. See the original author and article here.
Odds are, if you are impacted by the Cybersecurity Maturity Model Certification (CMMC) mandates, you already know it. Odds are, if you are reading this post, you are doing research because you are impacted by the mandates. If you are impacted by the mandates, this post is for you. This post is to give you ideas that [we hope] help you on your compliance journey.
The open question is likely “how do I become compliant”? Ultimately, there are two options. But before we get to the options of how to become compliant, we first need to address the scope of what needs to become compliant.
What about scope?
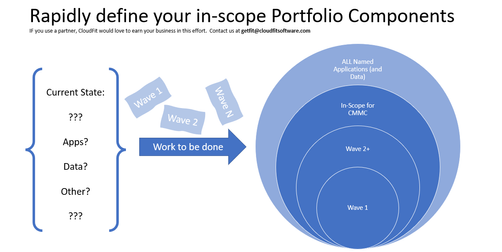
There are thousands of other published pages on the scope of CMMC, and that’s not the point of this post. The point here is to state the following:
- Today, you have N applications in your Portfolio
- A subset (maybe 100%, and maybe a smaller percentage) of those applications and their data must be compliant with CMMC by certain dates depending on your contracts and business requirements
- Every business that is beholden to the mandates needs to make a list of the applications (and data) that are in-scope. Many companies will do that rapid assessment on their own. Other companies will enlist the help of partners/vendors to help them move faster and more confidently. Either way is fine.
Once you have the list of apps (and data) that are in-scope for you, then what? Then, it is time to choose an option.
Option 1: Work on the running engine
The challenge with working on a running engine is the increased risk of losing a finger :smiling_face_with_smiling_eyes:. Honestly, if you had to spend time quantifying your Portfolio, then it stands to reason that there may be things that you missed in that assessment. But leaving that point aside, there is always the option to assess every app, every piece of data, every server, every switch, etc to become compliant. That is a very difficult journey because of years of technical debt. Can you really clean out all shared-credential-service accounts in your environment without breaking something critical?

Option 2: Build a new engine and rapidly move to it
Surely there are exceptions, but we have yet to see one. The best answer [is usually] to build a new engine. Not only is the right answer to build a new engine, but the right answer is to build a new engine in the cloud.
Why the cloud?
- They are already compliant (e.g. Microsoft Azure Government [MAG] and Government Commercial Cloud High [GCCH])
- You will not invest more in cybersecurity and compliance than Microsoft Cloud will, so they are and will be, more secure than you can be
- If you leverage the cloud, you then only have to worry about securing the pieces and parts that are unique to YOUR business: your enclave(s) and tenant(s), your application(s), your data.

Executing on Option 2 (New, Cloud Engine)
Step A: Rapidly Establish Cloud Enclave
- M365: Commercial and/or GCC and/or GCC-High and/or GCC-DOD
- Which one(s) do you need?
- How do you rapidly set them up and harden them?
- How do you continuously monitor (and automatically respond) to anomalies that would take you out of compliance?
- How do you give the auditor a real-time dashboard to speed up the audit(s)?
- Azure: Commercial Azure, Azure Government as IL2, Azure Government as IL4, Azure Government as IL5, or a combination
- Which one(s) do you need?
- How do you rapidly set them up and harden them?
- How do you continuously monitor (and automatically respond) to anomalies that would take you out of compliance?
- How do you give the auditor a real-time dashboard to speed up the audit(s)?
- For every enclave and/or tenant, how will it be managed on Day 1? Day N? (often, the goal is to “manage it myself” on Day N, but folks are unclear and aren’t ready to manage it on Day 1)
Step B: Move Applications (and Data)
- How do you prioritize your applications based on timelines and resourcing?
- For each application, should it
- Lift and Shift?
- Have slight tweaks? (e.g. converted to PaaS? Converted to hardened containers per DevSecOps Reference Architecture and DoD Standards? Other?)
- Rewrite?
- Other?
- For every application (and data), how will it be managed on Day 1? Day N? (Often, the goal is to “manage it myself” on Day N, but folks are unclear and aren’t ready to manage it on Day 1)
Step C: What about Client Devices?
- Are your laptops and desktops managed in such a way that they are compliant?
- What about mobile devices?
- Can you detect and minimize spillage?
- Do you understand your Data Loss posture?
Step D: What about Policies?
- For example, is your Data Loss Prevention Policy where it needs to be for CMMC?
- Are the written policies tactically implemented for the Enclaves, Tenants, Apps and Data defined as you establish the enclaves and move the applications?
Step E: What about Auditability?
- When the auditor shows up, will you spend days and weeks with them, or will you show them your real-time dashboards?
- When the auditor shows up, will you do tabletop exercises with them? Will you introduce an out-of-compliance-server and watch the automation turn off the server? Will automation also create a security incident in parallel? Is it true that the only way to end up with an errant server in this new, pristine engine is that someone went around the process as defined by the policy?’
Surely, you will choose Option 2.
Insource, Outsource or Hybrid?
Now, the only remaining question is whether you will figure it all out on your own or will you bring in someone to help you? Given the impact of getting it wrong and given the timeline, most companies will bring in someone to help them.
Which Partner?
There are two courses of action:
- Pay someone to “consult” with you while doing the work yourself
- Pay someone to do it for you including Day 1 thru Day N management
Most companies prefer B, but they assume that there is no such unicorn. And, if they assume there is a unicorn, they fear that they cannot afford it.
The ideal partner will help you in the following ways:
- Rapidly define the in-scope apps and data
- Ask a series of repeatable business questions
- Rapidly establish the enclave(s) and tenant(s)….ideally by using automation to save you time and money
- Rapidly move applications and data to the new enclave(s) and tenant(s) while making the necessary application tweaks (and being willing to take accountability for full application re-writes as necessary)….ideally using automation to refactor and/or re-write the apps
- Manage the clients and mobile devices and/or work through and with your existing client/mobile team to take accountability for the client and mobile posture….ideally using automation
- Manage the enclave(s), tenant(s), applications and data to keep them current and compliant….ideally using automation
- Work through and with your Policy team(s) to update Policies as necessary to match the actual implementation
- Stand at the ready to host your auditors when they show up …. ideally using automation
- Partner Requirements
- Already doing this same work in DoD IL5/CUI environments
- Already doing this work in Commercial environments including for Defense Industrial Base
- Already doing this work for small customers (e.g. 5 seats) through huge customers (e.g. 150k seats)
- Willing to take the risk to do the work as Firm-Fixed-Fee on a committed timeline
- Willing to commit to pricing of operations and maintenance pricing for years 2 through 5 (and beyond) on day 1
- Willing to provide significant multi-year discounts
Call to action:
- Quantify the applications (and data) that will fall within your CMMC scope
- Leverage Microsoft Azure Government and GCCH to meet the requirements
- Leverage an experienced partner to help you skip the learning curve
About the Author:
Carroll Moon is the CTO and Co-Founder of CloudFit Software. Prior to CloudFit, Carroll spent almost 18 years at Microsoft helping to build and run Microsoft’s Clouds. CloudFit Software aims to securely run every mission critical workload in the universe. CloudFit is a DoD company that also intentionally serves commercial companies. Commercial customers (including Microsoft’s Product Groups) keep CloudFit on the cutting edge of cloud and cloud apps—that makes CloudFit attractive to DoD customers. DoD customers require that CloudFit be a leader in cybersecurity—that makes CloudFit attractive to commercial customers. This intersection of DoD and Commercial uniquely positions CloudFit Software to help customers comply with cybersecurity mandates like CMMC, and the build-and-run-the-hyperscale-cloud pedigree of CloudFit’s executive team means that CloudFit is executing on their charter with software and automation rather than with people. CloudFit Software’s patented platform enables increased repeatability, decreased costs, increased availability and increased security in all areas from establishing hardened cloud enclaves to migrating (and re-factoring) workloads to operating securely in the cloud. Beyond the IT/Cloud charter, CloudFit Software exists to fund two 501c3 charities: KidFit (providing hope and opportunities to youth using sports as the enabler) and JobFit (providing hope and opportunities to adults and young adults using IT training and paid internships as the enablers). Carroll lives in Lynchburg, VA with his wife and two children. CMMC | CloudFit Software

by Contributed | Feb 16, 2023 | Technology
This article is contributed. See the original author and article here.
offers a huge library of written content, including technical documentation and paths. But what if you need something a little more visual and demonstrative while learning new skills? Enter Microsoft Learn’s vast collection of video content.
Whether you’re searching for a walk-through of Azure or wanting to know the newest trends within the tech world, Microsoft Learn offers a wide variety of unique video content. Produced as both stand-alone how-tos and episodic shows on Microsoft Learn, videos will help you attain new skills and knowledge while keeping up with the latest Microsoft technology.
Although Microsoft Learn offers content that fits learners at every stage of their journey, these seven videos can help new users take the first step towards achieving their learning goals.
1.
2. Exam Readiness Zone

If you need to prepare for a Microsoft Certification exam and you don’t know where to begin, check out this show that offers study tips, content overviews, and sample questions and answers for each featured exam.
Watch now
3. FastTrack for Azure Learn Live Series

Interact with Microsoft Azure engineers in real-time via livestreams. Geared towards helping you migrate or initiate new workloads in Azure, this series will give you added confidence when preparing for highly technical implementations.
Watch now
4. The Low Code Revolution

Learn how to develop and optimize applications and processes with Microsoft Power Platform direct from industry experts. Focused on low code solutions, this series is a great resource for developers of all backgrounds.
Watch now
5.
Catch up on the latest trends and news snippets within the developer community in this engaging and informative series. Watch highlights of interesting projects and discover tips and tricks for developers of all backgrounds and skillsets.
Watch now
6. Microsoft Graph Fundamentals

This multi-part series introduces Microsoft Graph basics. Best of all, it features interactive exercises that showcase how to use Microsoft Graph for connecting Microsoft 365 data with app development platforms.
Watch now
7. The AI Show

Learn about what’s new in artificial intelligence in this Friday evening series. Watch as host, Seth Juarez, works on machine learning and AI projects while offering tips for getting started on your own.
Watch now
you’re looking for a live demonstration of complex skills or a last-minute knowledge check before a certification exam, videos on Microsoft Learn are here to help. Check out what’s available today!
Explore shows on Microsoft Learn
Watch on-demand events


Recent Comments