by Contributed | Apr 18, 2023 | Technology
This article is contributed. See the original author and article here.
Two years ago, we shared that “It’s Time to Hang Up on Phone Transports for Authentication.” Today, we’re adding the public preview of Authenticator Lite to the tools we are offering to help you move from text message (SMS) and voice-based authentication. Our priority is getting every user to sign in with modern strong authentication – passwordless, hardened against phishing, easy to use and adaptable to evolving attacks.
Our top recommendation for modern strong authentication is the Authenticator, which offers the most robust security features, updated the most frequently, for free. Microsoft Authenticator app has over 100 million users worldwide who trust it as a secure and easy way to authenticate, making it the most popular way to sign in with strong authentication in Azure.
Because modern strong authentication is so important, we’re making it even more accessible by embedding it right into the Outlook client! We call this embedded experience Authenticator Lite – and we’re excited to announce it is now in public preview! For users that haven’t yet downloaded Authenticator, they can now complete MFA for their work or school account for free using the Outlook app on their iOS or Android devices. Users can approve authentication requests and receive TOTP codes, bringing the security of Authenticator to a convenient location while simplifying users’ move off phone transports for authentication.
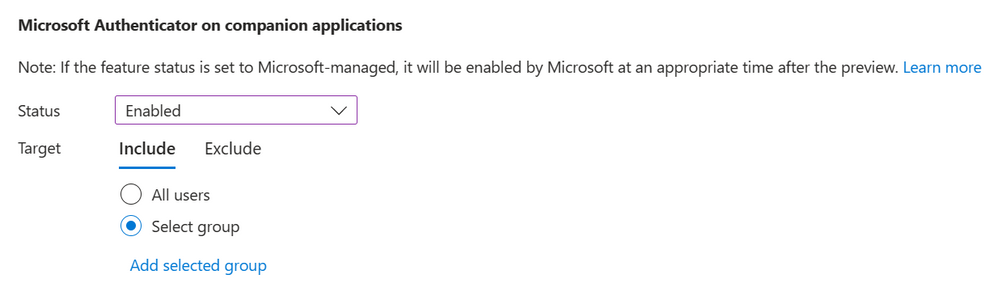
During public preview, admins can choose to enable or disable this capability for a group of users or to leave the feature in a Microsoft managed state. Enabling a group for Authenticator Lite is possible from the Entra portal via the Authenticator configuration page. It’s also possible to enable the feature through MS Graph.
Authenticator Lite, as the name suggests, will extend a subset of the Authenticator’s capabilities into Outlook. Each verification notification will include a number matching prompt and biometric or pin verification if enabled on the device. More information on the Authenticator Lite notification configurations can be found here.
Once enabled for Authenticator Lite, users on the latest version of Outlook without the Authenticator app will be prompted to register Outlook as an MFA method when they launch the app on their device.

Once users are registered, during their next authentication, users will be prompted to authenticate using a push notification in their Outlook app.

Registered users will also have access to a TOTP code found in their Outlook settings under Authenticator.

For more information on enabling this feature for your users, see here. Rollout to support this feature in Outlook is currently underway.
This feature will roll out to tenants in the state ‘Microsoft managed’. For the duration of public preview, leaving the feature set to ‘Microsoft managed’ will have no impact on your users and the feature will remain turned off unless you explicitly change the state to enabled. In late April 2023, we will remove preview tags and enter general availability. On May 26, 2023, if the feature is left set to ‘Microsoft managed,’ your tenant will be enabled for Authenticator Lite by Microsoft. If you do not wish for this feature to be enabled on May 26, set the state to ‘disabled’ or assign users to include and exclude groups prior to May 26.
We hope you and your users enjoy this new feature, and, as always, please let us know of any questions or feedback by leaving comments down below or reaching out to us at aka.ms/AzureADFeedback.
Regards,
Alex Weinert
VP Director of Identity Security, Microsoft
Microsoft Identity Division
Learn more about Microsoft identity:
by Contributed | Apr 17, 2023 | Technology
This article is contributed. See the original author and article here.
In our previous blog about hunting for network signatures in Microsoft 365 Defender, we described how we used device discovery capabilities to capture some network event information in deeper detail and expose them in advanced hunting with the NetworkSignatureInspected action type. Since then we have made several developments, the most significant being the integration with Zeek. This release has expanded what is possible for generating network detections across Microsoft Defender for Endpoint. That announcement, shared examples of detections created for PrintNightmare and NTLM password spraying attempts.
Today, we would like to share a variety of Zeek-based events in advanced hunting that will help you expand your investigation, hunting, and detection capabilities for identifying and addressing network-layer anomalies across HTTP, SSH and ICMP protocols. Using the new Zeek events, we will demonstrate how to perform network threat hunting while also covering some of the MITRE ATT&CK Matrix.
Note: As the integration with Zeek continues to mature, more action types will gradually be released over time. With the Zeek integration only supported on Windows devices, these action types will surface for connections to and from Windows device.
To identify these action types in your tenant, look for the value ConnectionInspected in the ActionType field of the DeviceNetworkEvents table of advanced hunting. The extra information is stored in the AdditionalFields column as a JSON data structure and has the commonly known Zeek fields per event, which can be parsed. These field names are identical to those that Zeek uses, which are documented on Zeek’s site. You can also check the Schema Reference flyout page on the advanced hunting pages to check for any new action types that were recently released.
Link to query
DeviceNetworkEvents
| where ActionType contains ‘ConnectionInspected’
| distinct ActionType
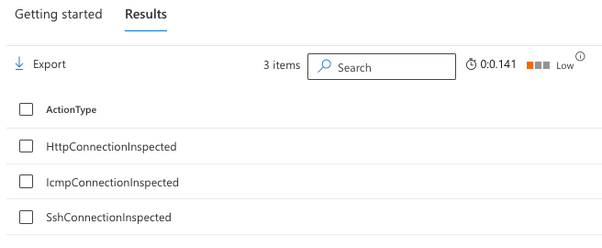
The result of this query looks something like this:
Figure 1 – Sample result upon checking for ConnectionInspected in the ActionType table
The format of the action type will follow the [Protocol_Name]ConnectionInspected standard.
Inspecting HTTP connections
The HttpConnectionInspected action type contains extra information about HTTP connections, inbound or outbound. In cases where you click on an event of the HttpConnectionInspected action type, the page flyout will parse the additional fields and present them in a format like the example below:

Figure 2 – Sample result of an HttpConnectionInspected action type
Below, you will find a complete list of fields that this action type can expose and the respective descriptions:
Field Name
|
Description
|
direction
|
The direction of the conversation relevant to the Microsoft Defender for Endpoint-onboarded device, where the values are either ‘In’ or ‘Out’
|
host
|
The host header content
|
method
|
The HTTP method requested
|
request_body_len
|
Length of the HTTP message body in bytes
|
response_body_len
|
Length of the HTTP response body in bytes
|
status_code
|
The HTTP response code
|
status_msg
|
The full text message of the response
|
tags
|
A set of indicators of various attributes discovered and related to a particular request/response pair.
|
trans_depth
|
Represents the pipelined depth into the connection of the request/response transaction
|
uri
|
The complete URI that was requested
|
user_agent
|
The user_agent header of the request
|
version
|
The HTTP version used
|
Let’s look at a few examples of using the HttpConnectionInspected action type. In the first example, you want to look for rare user agents in the environment to identify potentially suspicious outbound web requests and cover the “T1071.001: (Application Layer Protocol) Web Protocols” technique.
Link to query
// Identify rare User Agent strings used in http conversations
DeviceNetworkEvents
| where ActionType == ‘HttpConnectionInspected’
| extend json = todynamic(AdditionalFields)
| extend direction = tostring(json.direction), user_agent = tostring(json.user_agent)
| where direction == ‘Out’
| summarize Devices = dcount(DeviceId) by user_agent
| sort by Devices asc
Suppose you have identified a suspicious-looking user-agent named “TrickXYZ 1.0” and need to determine which user/process/commandline combination had initiated that connection. Currently, the HttpConnectionInspected events, as with all Zeek-related action types, do not contain that information, so you must execute a follow-up query by joining with events from ConnectionEstablished action type. Here’s an example of a follow-up query:
Link to query
// Identify usage of a suspicious user agent
DeviceNetworkEvents
| where Timestamp > ago(1h) and ActionType == “HttpConnectionInspected”
| extend json = todynamic(AdditionalFields)
| extend user_agent = tostring(json.user_agent)
| where user_agent == “TrickXYZ”
| project ActionType,AdditionalFields, LocalIP,LocalPort,RemoteIP,RemotePort, TimeKey = bin(Timestamp, 5m)
| join kind = inner (
DeviceNetworkEvents
| where Timestamp > ago(1h) and ActionType == “ConnectionSuccess”
| extend TimeKey = bin(Timestamp, 5m)) on LocalIP,RemoteIP,LocalPort,TimeKey
| project DeviceId, ActionType, AdditionalFields, LocalIP,LocalPort,RemoteIP,RemotePort , InitiatingProcessId,InitiatingProcessFileName,TimeKey
In another example, let’s look for file downloads from HTTP, particularly files of executable and compressed file extensions to cover the “T1105: Ingress tool transfer” technique:
Link to query
// Detect file downloads
DeviceNetworkEvents
| where ActionType == ‘HttpConnectionInspected’
| extend json = todynamic(AdditionalFields)
| extend direction= tostring(json.direction), user_agent=tostring(json.user_agent), uri=tostring(json.uri)
| where uri matches regex @”.(?:dll|exe|zip|7z|ps1|ps|bat|sh)$”
The new HTTP action type will unlock a variety of possibilities for detection on this protocol. We look forward to seeing the queries you come up with by sharing your contributions with the community.
Looking at SSH connections
The SshConnectionInspected action type will display information on SSH connections. While decrypting the entire SSH traffic is not possible, the cleartext part of the SSH session initiation can provide valuable insights. Let’s look at the data found in the AdditionalFields section.

Figure 3 – Screenshot of additional fields that SshConnectionInspected generates.
The fields depend on the activity that was observed. Some of these fields might not appear depending on the connection. For example, if the client disconnected before completing the authentication, you will not have an auth_success field populated for that event..
Below, you will find a complete list of fields that this action type can expose and the respective descriptions:
Field Name
|
Description
|
direction
|
The direction of the conversation relevant to the Defender for Endpoint-onboarded device, where the values are either ‘In’ or ‘Out’
|
auth_attempts
|
The number of authentication attempts until the success or failure of the attempted session.
|
auth_success
|
The success or failure in authentication, where ‘true’ means successful user authentication and ‘false’ means the user-provided credentials are incorrect.
|
client
|
The version and type of client used to authenticate to the SSH session.
|
host_key
|
Host public key value
|
server
|
SSH server information
|
version
|
SSH protocol major version used
|
uid
|
The unique ID of the SSH session attempt
|
Let’s look at a few advanced hunting examples using this action type. In the first example, you want to look for potentially infected devices trying to perform “T1110: Brute-Force” against remote servers using SSH as an initial step to “T1021.004: Lateral Movement – Remote Services: SSH”.
The query below will give you a list of Local/Remote IP combinations with at least 12 failed attempts (three failed authentications on four sessions) of SSH connections in the last hour. Feel free to use this example and adapt it to your needs.
Link to query
// Detect potential bruteforce/dictionary attacks against SSH
DeviceNetworkEvents
| where ActionType == ‘SshConnectionInspected’
| extend json = todynamic(AdditionalFields)
| extend direction=tostring(json.direction), auth_attempts = toint(json.auth_attempts), auth_success=tostring(json.auth_success)
| where auth_success==’false’
| where auth_attempts > 3
| summarize count() by LocalIP, RemoteIP
| where count_ > 4
| sort by count_ desc
In the next example, let’s suppose you are looking to identify potentially vulnerable SSH versions and detect potentially unauthorized client software being used to initiate SSH connections and operating systems that are hosting SSH server services in your environment:
Link to query
// Identify Server/Client pairs being used for SSH connections
DeviceNetworkEvents
| where ActionType == “SshConnectionInspected”
| extend json = todynamic(AdditionalFields)
| project Server = tostring(json.server),Client = tostring(json.client)
| distinct Server ,Client

Figure 4 – An example result with a short description of the different components
The results above describe breaking down the SSH banners to identify the different components. A short analysis of the banners shows that the server is Ubuntu 22.04, running OpenSSH version 8.9, and the client software is WinSCP version 5.21.3. Now, you can search these versions online to verify if they are vulnerable.
Note: The query above can be used to surface potential “T1046: Network Service Discovery” attempts, as attackers may try to search for unpatched or vulnerable SSH services to compromise.
Reviewing ICMP connections
The IcmpConnectionInspected action type will provide details about ICMP-related activity. The breadth of fields generated creates opportunities for some interesting detections. Here’s an example of the human-readable view of the event as shown on the event flyout page

Below, you will find a complete list of fields that this action type can expose and the respective descriptions:
Field Name
|
Description
|
direction
|
The direction of the conversation relevant to the Defender for Endpoint-onboarded device, where the values are either ‘In’ or ‘Out’
|
conn_state
|
The state of the connection. In the screenshot example OTH means that no SYN packet was seen. Read the Zeek documentation for more information on conn_state.
|
duration
|
The length of the connection, measured in seconds
|
missed_bytes
|
Indicates the number of bytes missed in content gaps, representing packet loss.
|
orig_bytes
|
The number of payload bytes the originator sent. For example, in ICMP this designates the payload size of the ICMP packet.
|
orig_ip_bytes
|
The number of IP level bytes that the originator sent as seen on the wire and taken from the IP total_length header field.
|
orig_pkts
|
The number of packets that the originator sent.
|
resp_bytes
|
The number of payload bytes the responder sent.
|
resp_ip_bytes
|
The number of IP level bytes that the responder sent as seen on the wire.
|
resp_pkts
|
The number of packets that the responder sent.
|
Uid
|
Unique Zeek ID of the transaction.
|
Let’s explore a few examples of hunting queries that you can use to leverage the ICMP connection information collected by Defender for Endpoint.
In the first example, you wish to look for potential data leakage via ICMP to cover the “T1048: Exfiltration Over Alternative Protocol” or “T1041: Exfiltration Over C2 Channel” techniques. The idea is to look for outbound connections and check the payload bytes a device sends in a given timeframe. We will parse the direction, orig_bytes, and duration fields and look for conversations over 100 seconds where more than 500,000 were sent. The numbers are used as an example and do not necessarily indicate malicious activity. Usually, you will see the download and upload are almost equal for ICMP traffic because most devices generate “ICMP reply” with the same payload that was observed on the “ICMP echo” request.
Link to query
// search for high upload over ICMP
DeviceNetworkEvents
| where ActionType == “IcmpConnectionInspected”
| extend json = todynamic(AdditionalFields)
| extend Upload = tolong(json[‘orig_bytes’]), Download = tolong(json[‘resp_bytes’]), Direction = tostring(json.direction), Duration = tolong(json.duration)
| where Direction == “Out” and Duration > 100 and Upload > 500000
| top 10 by Upload
| project RemoteIP, LocalIP, Upload = format_bytes(Upload, 2, “MB”), Download = format_bytes(Download, 2, “MB”),Direction,Duration,Timestamp,DeviceId,DeviceName
Below is an example result after exfiltrating a large file over ICMP to another device on the network:

In the last example, you wish to create another hunting query that helps you detect potential Ping sweep activities in your environment to cover the “T1018: Remote System Discovery” and “T1595: Active Scanning” techniques. The query will look for outbound ICMP traffic to internal IP addresses, create an array of the targeted IPs reached from the same source IP, and display them if the same source IP has pinged more than 5 IP Addresses within a 10-minute time window.
Link to query
// Search for ping scans
DeviceNetworkEvents
| where ActionType == “IcmpConnectionInspected”
| extend json = todynamic(AdditionalFields)
| extend Direction = json.direction
| where Direction == “Out” and ipv4_is_private(RemoteIP)
| summarize IpsList = make_set(RemoteIP) by DeviceId, bin(Timestamp, 10m)
| where array_length(IpsList) > 5
Identifying the origin process of ICMP traffic can be challenging as ICMP is an IP-Layer protocol. Still, we can use some OS-level indications to narrow down our search. We can use the following query to identify which process-loaded network, or even ICMP-specific, binaries:
Link to query
DeviceImageLoadEvents
| where FileName =~ “icmp.dll” or FileName =~ “Iphlpapi.dll”
More information
Understand which versions of the Microsoft Defender for Endpoint agent support the new integration here:
Find out more details about the integration in our ZeekWeek 2022 presentations:
View the open-source contribution in Zeek’s GitHub repository:
Previous announcements:
by Contributed | Apr 16, 2023 | Technology
This article is contributed. See the original author and article here.
By the time of writing this article, the Logic App Standard SQL Connector does not have the functionality to monitor the row version of SQL Views so it can’t be triggered by a change in the View’s data, which would have allowed us to configure a trigger on a View in SQL. Until it gets rolled out, we are exploring a way in this article to imitate this functionality.
The SQL built-in trigger (SQL Server – Connectors | Microsoft Learn) is based upon tracking update on SQL table and tracking cannot be enabled for SQL views. Azure SQL trigger uses SQL change tracking functionality to monitor a SQL table for changes and trigger a function when a row is created, updated, or deleted.
Assuming that we have a SQL Server, with three tables, and a View that joins the three tables. If any of the tables has an update, it will reflect on this View. This is what we tested in this POC, you can change this based on your requirements and based on how your View gets updated, if it gets updated only by two tables and the third is just static data then you will only need two Parent workflows to trigger the child one. The idea here is to pass the triggered value and use it as a where condition in the child workflow. The child workflow will execute a Get rows action on the SQL View using the “where condition”, it will then do the select on the View instead of a table as we use the View name instead of a Table name.
SQL side:
To begin, you might need to whitelist your client IP if you are connecting to your SQL Server from your machine.

If that doesn’t work, you can whitelist your IP from the Networking section under the SQL Server (browse to the SQL Server from the Database Overview page then go to Networking).

We create the tables in SQL Server.

We create the SQL View.

We enable Change Tracking on the Database and on the Tables. (right click, properties), you can also do this using code as well.


Create the Logic App and Workflows:
We create a Logic App Standard.
We create four workflows. (for the triggering workflows, you can have one only or more, based on your requirements)
tst_Workflow_SQL_Trigger_Tbl1
tst_Workflow_SQL_Trigger_Tbl2
tst_Workflow_SQL_Trigger_Tbl3
tst_Workflow_SQL_Get_View_Updated
Design for Child workflow that will get the updated rows of the SQL View:
Add a Request trigger.

Add the below schema to the Request Body so we can easily pass the values when calling this workflow from the Parent workflows.

{
“properties”: {
“Id”: {
“type”: “string”
},
“Value”: {
“type”: “integer”
}
},
“type”: “object”
}
Add an action to Get Rows for a table. Select the built-in SQL Connector and select the Get Rows Action.

In the Table Name click on Custom value and enter the name of the SQL View manually.
In the Parameters, add Where condition.
Select the Outputs of the Request Trigger to populate the where condition (will translate to: id=value)

Add a Response Action so the Child workflow can respond back to the Parent workflow.
Here you can precede this Action with a condition to check the output of the Get Rows Action and respond accordingly.
You can respond with the Output of the Get rows Action, but to steer away from repeating the work in the Parent workflows it is better to do all the work in the Child workflow. So you can act upon the result of the triggered SQL View in the Child workflow.

Design for the triggering workflow for Table 1 (Parent workflow):
Add a trigger. Select from the built-in tab the SQL Connector, select the Trigger When a row is modified (note the difference between this trigger and the When a row is updated, select the one that matches your requirements, even When a row is inserted)
After creating the connection, select the Table that you want to trigger this workflow. Table 1 in our scenario.

Add a Parse JSON Action. Use a sample of the table single row data to create the schema.

Sample:
{
“Id”: 20004,
“Auhthor_id”: 7346,
“Price”: 57,
“Edition”: 6,
“RowVer”: “AAAAAAAAtA8=”
}

Finally for this workflow, add an Action to call another workflow, the child workflow.
As we have created the child workflow earlier, the parameters for the workflow should be accessible.
For the Id, use the name that is used in the View, so you can easily select that exact column.
For the value, pass the value from the parsed JSON for that column. In our case it is called Id.

Create the other two workflows in the same manner. Point the trigger for each workflow to the correct Table.
In the Parse JSON use the schema for the relevant table.
In the Invoke Action, use the correct name of the column, and select the correct value from the Parse JSON output parameters.
Testing:
Add or update a row for one of the tables in SQL, you will notice that the corresponding Parent workflow was triggered, and called the Child workflow.
The Child workflow would get the updated row in the SQL View based on the passed where condition.
You can alter the where condition and the passed parameter based on your requirements.
This article is only a prove of concept.

Thank you :)

Recent Comments