by Contributed | Apr 26, 2021 | Technology
This article is contributed. See the original author and article here.
The following is the fifth and final on a series of articles by @Ali Youssefi that we have been cross-posting into this Test Community Blog for a couple of months now. These articles were first published by Ali in the Dynamics community but since the topic related with Testing, Quality and Selenium, we though it would makes sense to publish here as well.
If you didn’t get a chance to catch the previous parts of these series, please have a look the links below:
Otherwise, please read ahead!
Summary
EasyRepro is an open source framework built upon Selenium allowing automated UI tests to be performed on a specific Dynamics 365 organization. This article will cover incorporating EasyRepro into a DevOps Build pipeline, allowing us to begin the journey toward automated testing and quality. We will cover the necessary settings for using the VSTest task and configuring the pipeline for continuous integration and dynamic variables. Finally we will review the test result artifacts providing detailed information about each unit test and test run.
Getting Started
If you haven’t already, please review the previous articles showing how to create, debug and extend EasyRepro. This article assumes that the steps detailed in the first article titled Cloning locally from Azure DevOps have been followed. This approach will allow our test design team to craft and share tests for quality assurance across our DevOps process.
The Run Settings File
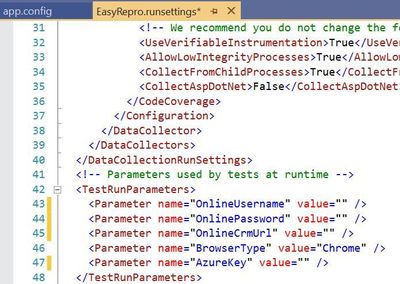
The run settings file for Visual Studio unit tests allow variables to be passed in similar to the app.config file. However this file is specific to Visual Studio tests and can be used in the command line and through Azure DevOps pipelines and test plans. Here is a sample to create a runsettings file.
The image above shows how to implement the TestRunParameters needed for EasyRepro unit tests. You can also find an example in the Microsoft.Dynamics365.UIAutomation.Sample project called easyrepro.runsettings. The runsettings file can be used to set the framework version, set paths for adapters, where the result artifacts will be stored, etc. In the Settings section below we will point to a runsettings file for use within our pipeline.
The ClassInitialize Data Attribute
The ClassInitialize data attribute is used by Visual Studio unit tests to invoke the constructor of a test class. This decoration coupled with the runsettings file will allow us to pass in a TestContext object containing the run parameters.
Properties

The configuration values from the runsettings file are included in the Properties object similar to the app.config file. For usage with EasyRepro we will want to leverage the .ToSecureString extension method which will help us when logging into the platform. Below is an example using this extension method.

Setting up the Build Pipeline
In the first article Test Automation and EasyRepro: 01 – Getting Started, we discussed how to clone from GitHub to a DevOps Git repository which we can then clone locally. The examples below follow this approach and assume you have cloned locally from Azure DevOps Git repo.
The first thing to setting up the Build Pipeline is to navigate to the DevOps organization and project. Once inside the project, click on the Pipelines button to create a Build Pipeline. Tasks here require resolving the NuGet package dependencies, building a solution with MS Build and running unit tests using the VS Test task as shown in the image below.

The core task is the VsTest which will run our Visual Studio unit tests and allow us to dynamically pass values from the Build pipeline variables or from files in source control. The section below goes into the VsTest task, specifically version 2.0.
Reviewing the VsTest task

Test Files
The test file field needs to point to a working directory, dictated by the Search folder field, to locate the compiled unit test assemblies. When using the default task this field looks for assemblies with the word test. If you’re starting with the Sample project from EasyRepro you will need to change this to look for the word Sample as shown above. When this task is run you can confirm if the correct assembly is found in the log for the task.
Test Filter Criteria
The test filter criteria field is used to help limit the scope of the unit tests run within the unit test assembly. Depending on the data attribute decorations you can restrict the unit test run task to only run specific tests. The criteria can be somewhat challenging if you haven’t worked with them before so I’d suggest using the Visual Studio Command Prompt to test locally to better understand how this will work in Azure DevOps Pipelines.

The above image shows an example of using the TestCaseFilter argument to run a specific test class. This argument can be used to run specific classes, priorities, test categories, etc. For instance
More information on the test filter criteria can be found here.
Settings File
The settings file field works with the vstest.console.exe utilizing the “/Settings” argument but allows the ability to pick a file from the repository directly. This field is customizable to also work with Build Pipeline variables which I’ll describe next.

Override Test Run Parameters
Overriding test run parameters is useful when we want to reuse the same test settings but pass in variables from the Build Pipeline. In the example below I’m replacing the parameters from the runsettings file on the left with Build Pipeline variables on the right.

Below are my pipeline variables I’ve defined. This allows me to check in a runsettings file but not have to modify parameters before committing. The values can be plain or secure strings which you will have to take into account if you plan to use one or the other. These variables can also be provided at run time when we queue the build.

Enabling the Continuous Integration Trigger

Enabling the continuous integration trigger allows developers to craft their unit tests and have our build pipeline run on push of a commit. This is configured from the Triggers tab on the pipeline which will bring up the above image. To enable, check the box for ‘Enable continuous integration’ and set which branch you want to have this fire off on. This doesn’t restrict a tester from queuing a build on demand but does help us move forward towards automation!
Running the Build Pipeline
To kick off the build pipeline, commit and push changes to your unit tests as you would any Git commit. Once the push is finished you can navigate to the Azure DevOps org and watch the pipeline in action. Below is a recording of a sample run.

Exploring the Results File
The results of the unit tests can be found in the build pipeline build along with the logs and artifacts. The test results and artifacts are also found in the Test Runs section of the Azure Tests area. The retention of these results are configurable within the Azure DevOps project settings. Each build can be reviewed at a high level for various test result statuses as shown below:

The summary screen includes the unit tests ran and information about failed tests that can be used to track when a regression began. Columns shown include the last time a test ran and what build it began to fail on.

When investigating a failed unit test a link to a new or existing bug can be added. This is useful to help track regressions and assign to the appropriate team. Bugs can be associated from the test run or specific unit test and include links to the build, test run and test plan. The exception message and stack trace are automatically added if linked from the failed unit test.

Each test run includes a test results file that can be downloaded and viewed with Visual Studio. The test artifacts can also be retained locally for archiving or reporting purposes. The contents of the test can be extracted and transformed to be used by platforms such as PowerBI or Azure Monitor.

Its key to point out that when used with a Azure Test Run these results can be retrieved via the API and reported on directly. Below is an image of the response from the Test Run.

Next Steps
Including Unit Tests as a Continuous Delivery Quality Gate
Building and running our EasyRepro tests with Build Pipelines represent an important first step into your journey into DevOps as well as what has been called Continuous Quality. Key benefits here include immediate feedback and deep insights into high value business transactions. Including these types of tests as part of the release of a Dynamics solution into an environment is paramount to understanding impact and providing insight.
Including Code Analysis as a Continuous Delivery Quality Gate
One thing I’d like to point out is that UI testing can help ensure quality but this should be coupled with other types of testing such as security testing or code analysis. The PowerApps Product Group has a tremendously valuable tool called the PowerApps Project Checker for code analysis. Project Checker can help identify well documented concerns that may come up as part of our deployment. This tool can be used via PowerShell or from the PowerApps Build Tasks within the Visual Studio Marketplace. It can also be run from the PowerApps portal in a manual fashion if desired.
This code quality step can be included as part of the extraction of modifications from your development or sandbox environments or as a pre step before packaging a managed solution for deployment. For additional detail there is a wonderful post by the Premier Field Engineer team documenting how to include this task into your pipelines. Special thanks to Premier Field Engineers’ Paul Breuler and Tyler Hogsett for documenting and detailing the journey into DevOps.
I highly recommend incorporating this important step into any of your solution migration strategies even if you are still manually deploying solutions to better understand and track potential issues.
Scheduling Automated Tests
Scheduling tests can be done in various ways, from build and release pipelines to Azure Test Plans. For pipelines triggers can be used to schedule based off a predetermined schedule. Azure Test Plans allow for more flexibility to run a specific set of tests based off of test cases linked to unit tests. To find out more about setting this up, refer to this article.
Conclusion
This article covers working from a local version of EasyRepro tests and how to incorporate into a Azure DevOps Build Pipeline. It demonstrates how to configure the VsTest task, how to setup triggers for the Build Pipeline and how to review Test Results. This should be a good starting point into your journey into DevOps and look forward to hearing about it and any question you have in the comments below.
At the Microsoft Test Team, we have followed this tutorial and often use EasyRepro for our UI-Test related needs for Dynamics 365, please stay tune for a Tips and Trick related to EasyRepro, until next time!
by Contributed | Apr 26, 2021 | Technology
This article is contributed. See the original author and article here.
In the previous episode, we described how you can easily use PowerBi to represent Microsoft 365 data in a visual format. In this episode, we will explore another way you can interact with the Microsoft 365 Defender API. e will describe how to automate data analysis and hunting using Jupyter notebook.
Automate your hunting queries
While hunting and conducting investigations on a specific threat or IOC, you may want to use multiple queries to obtain wider optics on the possible threats or IOCs in your network. You may also want to leverage queries that are used by other hunters and use it as a pivot point to perform deep analysis and find anomalous behaviors. You can find a wide variety of examples in our Git repository where various queries related to the same campaign or attack technique are shared.
In scenarios such as this, it is sensible to leverage the power of automation to run the queries rather than running individual queries one-by-one.
This is where Jupyter Notebook is particularly useful. It takes in a JSON file with hunting queries as input and executes all the queries in sequence. The results are saved in a .csv file that you can analyze and share.
Before you begin
JUPYTER NOTEBOOK
If you’re not familiar with Jupyter Notebooks, you can start by visiting https://jupyter.org for more information. You can also get an excellent overview on how to use Microsoft 365 APIs with Jupyter Notebook by reading Automating Security Operations Using Windows Defender ATP APIs with Python and Jupyter Notebooks.
VISUAL STUDIO CODE EXTENSION
If you currently use Visual Studio Code, make sure to check out the Jupyter extension.

Figure 1. Visual Studio Code – Jupyter Notebook extension
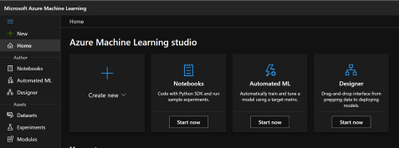
Another option to use Jupyter Notebook is the Microsoft Azure Machine Learning service.
Microsoft Azure Machine Learning is the best way to share your experiment with others and for collaboration.
Please refer to Azure Machine Learning – ML as a Service | Microsoft Azure for additional details.
Figure 2. Microsoft Azure Machine Learning
In order to create an instance, create a resource group and add the Machine Learning resource. The resource group lets you control all of the resources from a single entry point.

Figure 3. Microsoft Azure Machine Learning – Resource
When you’re done, you can run the same Jupyter Notebook you are running locally on your device.

Figure 4. Microsoft Azure Machine Learning Studio
App Registration
The easy way to access the API programmatically is to register an app in your tenant and assign the required permissions. This way, you can authenticate using the application ID and application secret.
Follow these steps to build your custom application.

Figure 5. App registration
Select “NEW REGISTRATION“.

Figure 6. Register an application
Provide the Name of your app, for example, MicrosoftMTP, and select Register.
Once done, select “API Permission“.

Figure 7. API Permissions
Select “Add a permission“.

Figure 8. Add permission
Select the “APIs my organization uses“.

Figure 9. Alert Status

Figure 10. Request API permission
Search for Microsoft Threat Protection and select it.

Figure 11. Microsoft Threat Protection API
Select “Application Permission“.

Figure 12. Application Permissions
Then select:
- AdvancedHunting.Read.All
- Incident.Read.All

Figure 13. Microsoft 365 Defender API – Read permission
Once done select “Add permissions“.

Figure 14. Microsoft 365 Defender API – Add permission
Get Started
Now that we have the application ready to access the API via code, let’s try to see is any of the Qakbot queries shared in Microsoft 365 Defender Git produce any results.

Figure 15. Microsoft 365 Defender – Hunting Queries
The following queries will be used in this tutorial:
Javascript use by Qakbot malware
Process injection by Qakbot malware
Registry edits by campaigns using Qakbot malware
Self-deletion by Qakbot malware
Outlook email access by campaigns using Qakbot malware
Browser cookie theft by campaigns using Qakbot malware
Detect .jse file creation events
We need to grab the queries that we want to submit and populate a JSON file with this format. Please be sure that you are properly managing the escape character in the JSON file (if you use Visual Studio Code (VSCode) you can find extensions that can make the ESCAPE/UNESCAPE process easiest, just pick your favorite one).
[
        {
            "Description": "Find Qakbot overwriting its original binary with calc.exe",
            "Name": "Replacing Qakbot binary with calc.exe",
            "Query": "DeviceProcessEvents | where FileName =~ "ping.exe" | where InitiatingProcessFileName =~ "cmd.exe" | where InitiatingProcessCommandLine has "calc.exe" and InitiatingProcessCommandLine has "-n 6" and InitiatingProcessCommandLine has "127.0.0.1" | project ProcessCommandLine, InitiatingProcessCommandLine, InitiatingProcessParentFileName, DeviceId, Timestamp",
            "Mitre": "T1107 File Deletion",
            "Source": "MDE"
        }
]
Once you have all your queries properly filled, we must provide the following parameters to the script in order to configure the correct credential, the JSON file, and the output folder.

Figure 16. Jupyter Notebook – Authentication
Because we registered an Azure Application and we used the application secret to receive an access token, the token is valid for 1 hour. Within the code verify if we need to renew this token before submitting the query.

Figure 17. Application Token lifetime validation
When building such flow we should take into consideration Microsoft 365 Defender Advanced hunting API quotas and resources allocation. For more information, see Advanced Hunting API | Microsoft Docs.

Figure 18. API quotas and resources allocation taking into consideration
We run the code by loading the query from the JSON file we defined as input. We then view the progress and the execution status on screen.

Figure 19. Query Execution
The blue message indicates the number of queries that is currently running and its progress.
The green message shows the name of the query that is being run.
The grey message shows the details of the submitted query.
If there are any results you will see the first 5 records, and then all the records will be saved in a .csv file in the output folder you defined.

Figure 20. Query results – First 5 records
Bonus
You can post the summary of the query execution in a Teams channel, you need to add Incoming Webhook in your teams.

Figure 21. Incoming Webhook
Then you need to select which Teams channel you want to add the app.

Figure 22. Incoming Webhook – add to a team
Select “Set up a connector”.

Figure 23. Incoming Webhook – Setup a connector
Specify a name.

Figure 24. Incoming Webhook – Config
Now you need to copy the URL, then paste the URL in the Jupyter Notebook.

Figure 25. Incoming Webhook – teamurl variable
Then remove the comment from the latest line in the code to send the message to Teams.

Figure 26. Incoming Webhook – teamsurl variable
You should receive a similar message like the following in the Teams channel:

Figure 27. Query result summary – Teams Message
Conclusion
In this post, we demonstrated how you can use the Microsoft 365 Defender APIs and Jupyter Notebook to automate execution of hunting queries playbook. We hope you found this helpful!
Appendix
For more information about Microsoft 365 Defender APIs and the features discussed in this article, please read:
The sample Notebook discussed in the post is available in the github repository
Microsoft-365-Defender-Hunting-Queries/M365D APIs ep3.ipynb at master · microsoft/Microsoft-365-Defender-Hunting-Queries (github.com)
As always, we’d love to know what you think. Leave us feedback directly on Microsoft 365 security center or start a discussion in Microsoft 365 Defender community
by Contributed | Apr 26, 2021 | Technology
This article is contributed. See the original author and article here.
Howdy folks,
I’m excited to share the latest Active Azure Directory news, including feature updates, support depreciation, and the general availability of new features that will streamline administrator, developer, and end user experiences. These new features and feature updates show our commitment to simplifying identity and access management, while also enhancing the kinds of customization and controls our customers need.
New features
- Embed Azure AD B2C sign-in interface in an iframe (Preview): Customers have told us how jarring it is to do a full-page redirect when users authenticate. Using a custom policy, you can now embed the Azure AD B2C experience within an iframe so that it appears seamlessly within your web application. Learn more in the documentation.

- Custom email verification for Azure AD B2C (GA): You can send customized email to users that sign up to use your customer applications, with a third-party email provider such as Mailjet or SendGrid. Using a Azure AD B2C custom policy, you can set up an email template, From: address, and subject, as well as support localization and custom one-time password (OTP) settings. Learn more in the documentation.

- Additional service and client support for Continuous Access Evaluation (CAE) – MS Graph service & OneDrive clients on all platforms (Windows, Web, Mac, iOS, and Android) start to support CAE at the beginning of April. Now OneDrive client access can be terminated immediately right after security events, like session revocation or password reset, if you have CAE enabled in your tenant.
We’re always looking to improve Azure AD in ways that benefit IT and end users. Often, these updates originate with the suggestions of users of the solution. We’d love to hear your feedback or suggestions for new features or feature updates in the comments or on Twitter (@AzureAD).
Alex Simons (@Alex_A_Simons)
Corporate VP of Program Management
Microsoft Identity Division
Learn more about Microsoft identity:
by Contributed | Apr 26, 2021 | Technology
This article is contributed. See the original author and article here.
We published an overview of MSTICPy 18 months ago and a lot has happened since then with many changes and new features. We recently released 1.0.0 of the package (it’s fashionable in Python circles to hang around in “beta” for several years) and thought that it was time to update the aging Overview article.
What is MSTICPy?
MSTICPy is a package of Python tools for security analysts to assist them in investigations and threat hunting, and is primarily designed for use in Jupyter notebooks. If you’ve not used notebooks for security analysis before we’ve put together a guide on why you should.
The goals of MSTICPy are to:
- Simplify the process of creating and using notebooks for security analysis by providing building-blocks of key functionality.
- Improve the usability of notebooks by reducing the amount of code needed in notebooks.
- Make the functionality open and available to all, to both use and contribute to.
MSTICPy is organized into several functional areas:
- Data Acquisition – is all about getting security data into the notebook. It includes data providers and pre-built queries that allow easy access to several security data stores including Azure Sentinel, Microsoft Defender, Splunk and Microsoft Graph. There are also modules that deal with saving and retrieving files from Azure blob storage and uploading data to Azure Sentinel and Splunk.
- Data Enrichment – focuses on components such as threat intelligence and geo-location lookups that provide additional context to events found in the data. It also includes Azure APIs to retrieve details about Azure resources such as virtual machines and subscriptions.
- Data Analysis – packages here focus on more advanced data processing: clustering, time series analysis, anomaly identification, base64 decoding and Indicator of Compromise (IoC) pattern extraction. Another component that we include here but really spans all of the first three categories is pivot functions – these give access to many MSTICPy functions via entities (for example, all IP address related functions are accessible as methods of the IpAddress entity class.)
- Visualization – this includes components to visualize data or results of analyses such as: event timelines, process trees, mapping, morph charts, and time series visualization. Also included under this heading are a large number of notebook widgets that help speed up or simplify tasks such as setting query date ranges and picking items from a list. Also included here are a number of browsers for data (like the threat intel browser) or to help you navigate internal functionality (like the query and pivot function browsers).
There are also some additional benefits that come from packaging these tools in MSTICPy:
- The code is easier to test when in standalone modules, so they are more robust.
- The code is easier to document, and the functionality is more discoverable than having to copy and paste from other notebooks.
- The code can be used in other Python contexts – in applications and scripts.
Companion Notebook
Like many of our blog articles, this one has a companion notebook. This is the source of the examples in the article and you can download and run the notebook for yourself. The notebook has some additional sections that are not covered in the article.
The notebook is available here.
Documentation and Resources
Since the original Overview article we have invested a lot of time in improving and expanding the documentation – see msticpy ReadTheDocs. There are still some gaps but most of the package functionality has detailed user guidance as well as the API docs. We do also try to document our code well so that even the API documents are often informative enough to work things out (if you find examples where this isn’t the case, please let us know).
In most cases we also have example notebooks providing an interactive illustration of the use of a feature (these often mirror the user guides since this is how we write most of the documentation). They are often a good source of starting code for projects. These notebooks are on our GitHub repo.
Getting Started Guides
If you are new to MSTICPy and use Azure Sentinel the first place to go is the Use Notebooks with Azure Sentinel document. This will introduce you the the Azure Sentinel user interface around notebooks and walk you through process of setting up an Azure Machine Learning (AML) workspace (which is, by default, where Azure Sentinel notebooks run). One note here – when you get to the Notebooks tab in the Azure Sentinel portal, you need to hit the Save notebook button to save an instance of one of the template notebooks. You can then launch the notebook in the AML notebooks environment.
The next place to visit is our Getting Started for Azure Sentinel notebook. This covers some basic introductory notebook material as well as essential configuration. More advanced configuration is covered in Configuring Notebook Environment notebook – this covers configuration settings in more detail and includes a section on setting up a Python environment locally to run your notebooks.
Although this article is aimed primarily at Azure Sentinel users, you can use MSTICPy with other data sources (e.g. Splunk or anything you can get into a pandas DataFrame) and in any Jupyter notebook environment. The Azure Sentinel notebooks can be found in our Notebooks GitHub repo.
Notebook Initialization
Assuming that you have a blank notebook running (in either AML or elsewhere) what do you do next?
Most of our notebooks include a more-or-less identical setup sections at the beginning. These do three things:
- Checks the Python and MSTICPy versions and updates the latter if needed.
- Imports MSTICPy components.
- Loads and authenticates a query provider to be able to start querying data.

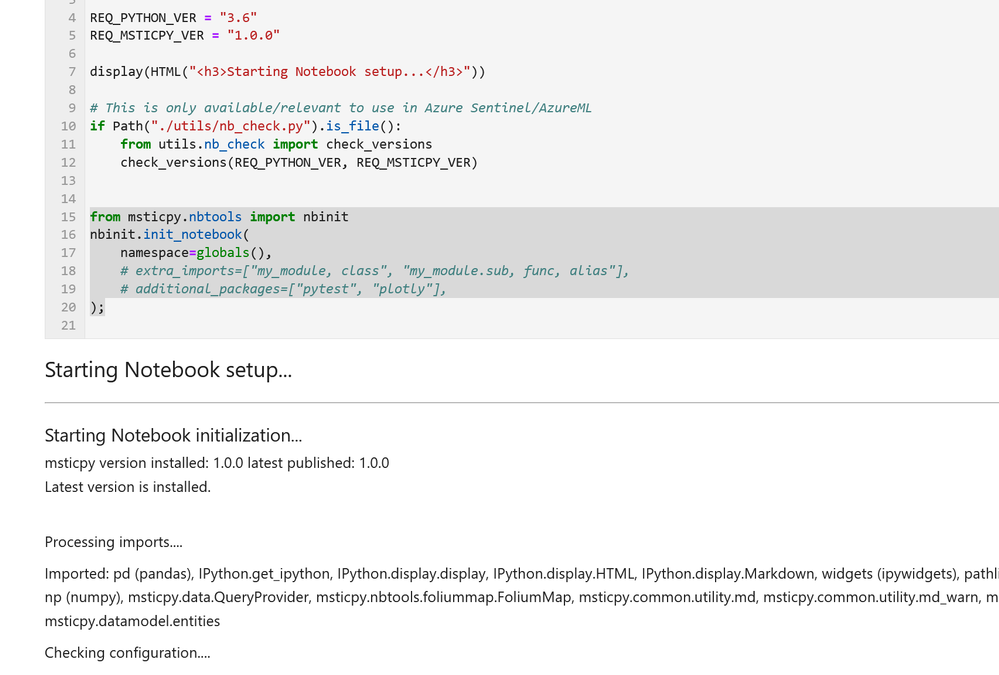
If you see warnings in the output from the cell about configuration sections missing you should revisit the previous Getting Started Guides section. This cell includes the first two functions in the list above. The first one – running utils.check_versions() – is not essential in most cases once you have your environment up and running but it does do a few useful tweaks to the notebook environment, especially if you are running in AML.
The init_notebook function automates a lot of import statements and checks to see that the configuration looks healthy.
The third part of the initialization loads the Azure Sentinel data provider (which is the interface to query data) and authenticates to your Azure Sentinel workspace. Most data providers will require authentication.

Assuming you have your configuration set up correctly, this will usually take you through the authentication sequence, including any two-factor authentication required.
Data Queries
Once this setup is complete, we’re at the stage where we can start doing interesting things!
MSTICPy has many pre-defined queries for Azure Sentinel (as well as for other providers). You can choose to run one of these predefined queries or write your own. This list of queries documented here is usually up-to-date but the code itself is the real authority (since we add new queries frequently). The easiest way to see the available queries is with the query browser. This shows the queries grouped by category and lets you view usage/parameter information for each query.

by Contributed | Apr 26, 2021 | Technology
This article is contributed. See the original author and article here.
Microsoft partners like LANSA, Nuvento, and TransientX deliver transact-capable offers, which allow you to purchase directly from Azure Marketplace. Learn about these offers below:
|
LANSA Scalable License: This offer from LANSA provides a Microsoft Windows Server image to use with a Microsoft Azure Resource Manager template in constructing a production-ready Windows stack to deliver LANSA web, mobile, and desktop capabilities. LANSA accelerates development and enables digital transformation. Users can deploy an app to this production environment from any Visual LANSA IDE.
|
 |
NuOCR – OCR automation: This paper-to-digital solution from Nuvento uses optical character recognition (OCR) to automate data extraction. Scanned forms, invoices, surveys, and other documents can be uploaded to a database or to a Microsoft Excel sheet, making them searchable and editable. NuOCR comes with a prebuilt template library for healthcare, insurance, and other industries.
|
 |
TransientAccess Connector: TransientX’s TransientAccess is a zero-trust network access solution that offers an alternative to VPNs. Instead of connecting device to device, TransientAccess uses a temporary hidden network to connect apps on a remote user’s device to apps in a corporate network, dramatically reducing the attack surface. The Connector and the Client are essential components of TransientAccess.
|
|


Recent Comments