by Contributed | May 26, 2021 | Technology
This article is contributed. See the original author and article here.
At Microsoft, we are always looking for ways to empower our customers to achieve more by delivering our most advanced AI-enabled services. In March 2021, we launched the preview release of semantic search on Azure Cognitive Search, which allows our customers’ search engines to retrieve and rank search results based on the semantic meaning of search keywords rather than just their syntactical interpretation. We introduced this functionality by leveraging state-of-the-art language models that power Microsoft Bing search scenarios across several languages – a result of the recent advancements in developing large, pretrained transformer-based models as part of our Microsoft AI at Scale initiative.
Today, we are excited to announce that we are extending these capabilities to enable semantic search across multiple languages on Azure Cognitive Search.
Search scenarios
Semantic search consists of three scenarios – semantic ranking, captions and answers – and customers can easily enable them via the REST API or Azure Portal to get semantic search results. The following examples illustrate how these scenarios are being delivered across different languages, where we rank search results based on our semantic ranker, followed by extracting and semantically highlighting the answer to the search query.
Figure 1. Semantic search in German language. English translated query is {area code kyllburg}. Sample index is based on the XGLUE benchmark dataset for cross-lingual understanding.
 Figure 2. Semantic search in French language. English translated query is {different literary movements}. Sample index is based on the XGLUE benchmark dataset for cross-lingual understanding.
Models and evaluations
The language models powering semantic search are based on our state-of-the-art Turing multi-language model (T-ULRv2) that enables search across 100+ languages in a zero-shot fashion. Using global data from Bing, these models have been fine-tuned across various tasks to enable high-quality semantic search features for multiple languages and have been distilled further to optimize for serving real-world online scenarios at a significantly lower cost. Below is a list of the various innovations that are powering semantic search today.
UniLM (Unified Language Model pre-training)
Graph attention networks for machine reading comprehension
Multi-task deep neural networks for natural language understanding
MiniLM distillation for online serving in real-life applications
Since their introduction, the models have been serving Bing search traffic across several markets and languages, delivering high-quality semantic search results to Bing users worldwide. Additionally, we have validated the quality of semantic ranking on Azure Cognitive Search using a variety of cross-lingual datasets – these include academic benchmark datasets (e.g. XGLUE web page ranking) as well as real-world datasets from services currently powered by Azure Cognitive Search (e.g. Microsoft Docs). Our results showed several points of gain in search relevance metrics (NDCG) over the existing BM25 ranker for various languages such as French, German, Spanish, Italian, Portuguese, Chinese and Japanese. For semantic answers, our evaluations were based on multiple datasets focused on Q&A tasks. Current academic benchmark leaderboards for Q&A scenarios measure accuracy of answer extraction for a given passage. However, our assessments were required to go a step further and consider more real-world intricacies involving multiple steps (see Figure 3) to extract an answer from a search index: (1) documents retrieval from the search index, (2) candidate passage extraction from the given documents, (3) passage ranking across candidate passages, and (4) answer extraction from the most relevant passage. We observed that our model accuracy for French, Italian, Spanish and German languages is equivalent to that of English language.
 Figure 3. Semantic answer extraction in Azure Cognitive Search.
Get started
The following table summarizes the set of languages and queryLanguage parameter values that we currently support via the REST API to enable semantic search on Azure Cognitive Search. Note that we have also added speller support for Spanish, French and German languages. For languages marked as “preview”, we encourage you out to try the capability for your search index and give us your feedback. For detailed instructions on how to configure semantic search for your target language, please refer to our documentation.
 Table 1. Supported languages for semantic search on Azure Cognitive Search.
Conclusion
With additional support for new languages, we are very excited to extend access to our state-of-the-art AI-enabled search capabilities to developers and customers worldwide. Please sign up for our preview to try out semantic search today!
References
https://aka.ms/semanticgetstarted
by Contributed | May 26, 2021 | Technology
This article is contributed. See the original author and article here.
Introduction
Formik is the world’s most popular open-source form library for React and React Native. We can also use this library in our SPFx web part as well to manage form validations. Using this library we don’t have to write custom validations. so let’s start step-by-step implementation.
What is formik?
Formik is a small library that helps us with the these parts: Getting values in and out of form state. Validation and error messages. Handling form submission.
Formik is designed to manage forms with complex validation with ease.
Formik supports synchronous and asynchronous form-level and field-level validation.
Furthermore, it comes with baked-in support for schema-based form-level validation through Yup.
For more details about Fromik refer to the below articles,
Formik official documentation
Manage Forms In React With Formik
Formik validation Schema
SharePoint List Structure
Create a list called Tasks with below fields,
Field Name(Internal name) |
Field Type |
Title (default) |
Single line of text |
StartDate |
Date and Time (Date only)
|
EndDate |
Date and Time (Date only) |
ProjectName |
Single line of text |
TaskDetails |
Multiple lines of text |
After the creation of the list, we will start to create the SPFx web part.
Formik implementation with SPFx
Open a command prompt
Move to the path where you want to create a project
Create a project directory using:
md react-formik
Move to the above-created directory using:
cd react-formik
Now execute the below command to create an SPFx solution:
yo @microsoft/sharepoint
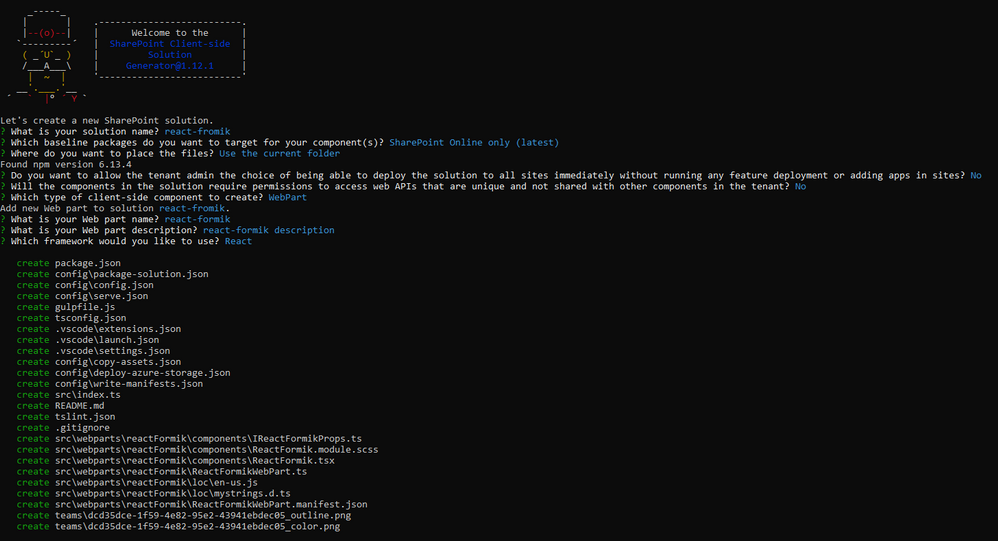
It will ask some questions, as shown below,
After a successful installation, we can open a project in any source code tool. Here, I am using the VS code, so I will execute the command:
code .
Now we will install the following packages:
npm i formik
npm i yup
npm i @pnp/spfx-controls-react
npm i @microsoft/sp-dialog
In the end, our output will be like this,

After the successful installation, we will start our form implementation.
1. Create below files
I{webpartname}State.ts inside src/webparts/reactFormik/components
SPService.ts file inside src/webparts/shared/service
In the end, our structure will be looks like this,

2. Create a state interface as below inside IReactFormikState.ts.
export interface IReactFormikState {
  projectName?: string;
  startDate?: any;
  endDate?: any;
}
3. Create a method to create a task inside SPService.ts.
import "@pnp/sp/webs";
import "@pnp/sp/lists";
import "@pnp/sp/items";
import "@pnp/sp/webs";
import "@pnp/sp/site-users/web";
import { Web } from "@pnp/sp/webs";

export class SPService {

    private web;

    constructor(url: string) {
        this.web = Web(url);
    }

    public async createTask(listName: string, body: any) {
        try {
            let createdItem = await this.web.lists
                .getByTitle(listName)
                .items
                .add(body);
            return createdItem;
        }
        catch (err) {
            Promise.reject(err);
        }
    }
}
4. Move to the ReactFormikWebPart.ts. In this, we will pass the current SP context and read site URL from user.
import * as React from 'react';
import * as ReactDom from 'react-dom';
import { Version } from '@microsoft/sp-core-library';
import {
  IPropertyPaneConfiguration,
  PropertyPaneTextField
} from '@microsoft/sp-property-pane';
import { BaseClientSideWebPart } from '@microsoft/sp-webpart-base';

import * as strings from 'ReactFormikWebPartStrings';
import ReactFormik from './components/ReactFormik';
import { IReactFormikProps } from './components/IReactFormikProps';
import { sp } from "@pnp/sp/presets/all";

export interface IReactFormikWebPartProps {
  description: string;
  siteUrl: string;
}

export default class ReactFormikWebPart extends BaseClientSideWebPart<IReactFormikWebPartProps> {

  protected onInit(): Promise<void> {

    return super.onInit().then(_ => {
      sp.setup({
        spfxContext: this.context
      });
    });
  }

  public render(): void {
    const element: React.ReactElement<IReactFormikProps> = React.createElement(
      ReactFormik,
      {
        description: this.properties.description,
        context: this.context,
        siteUrl: this.properties.siteUrl ? this.properties.siteUrl : this.context.pageContext.web.absoluteUrl
      }
    );

    ReactDom.render(element, this.domElement);
  }

  protected onDispose(): void {
    ReactDom.unmountComponentAtNode(this.domElement);
  }

  protected get dataVersion(): Version {
    return Version.parse('1.0');
  }

  protected getPropertyPaneConfiguration(): IPropertyPaneConfiguration {
    return {
      pages: [
        {
          header: {
            description: strings.PropertyPaneDescription
          },
          groups: [
            {
              groupName: strings.BasicGroupName,
              groupFields: [
                PropertyPaneTextField('description', {
                  label: strings.DescriptionFieldLabel
                }),
                PropertyPaneTextField('siteUrl', {
                  label: strings.SiteUrlFieldLabel
                })
              ]
            }
          ]
        }
      ]
    };
  }
}
5. Move to the ReactFormik.tsx file to render form and validations
yup syntaxs:
1. For string: yup.string().required(‘Required’)
2. For date: yup.date().required(‘Required’).nullable()
Related to Formik
1. Fromik has its own handleReset and handleSubmit method so we don not have to manage manually
2. We have to set state value and error message from control so for that I have created a common method
1. In the constructor, we will set the current SP context, bind the service and required methods and initialize the states.
2. Create createRecord() to create task list item using SPService.
3. In the render(), first we will add all the controls like date picker, text field, people picker, and dropdown, etc inside <Formik>.
then We will set properties as below,
initialValues – This is one type o state at here we will set empty or null or undefined as an initial level.
validationSchema – At here we will do validations using yup. so for this, I am creating one const and wills et this constant in this prop.
onSubmit – At here we will call the method to create a record in the SharePoint list
import * as React from 'react';
import styles from './ReactFormik.module.scss';
import { IReactFormikProps } from './IReactFormikProps';
import { IReactFormikState } from './IReactFormikState';
import { SPService } from '../../shared/service/SPService';
import { TextField } from '@fluentui/react/lib/TextField';
import { Stack, } from '@fluentui/react/lib/Stack';
import { Formik, FormikProps } from 'formik';
import { Label } from 'office-ui-fabric-react/lib/Label';
import * as yup from 'yup';
import { PeoplePicker, PrincipalType } from "@pnp/spfx-controls-react/lib/PeoplePicker";
import { DatePicker, Dropdown, mergeStyleSets, PrimaryButton, IIconProps } from 'office-ui-fabric-react';
import { sp } from '@pnp/sp';
import { Dialog } from '@microsoft/sp-dialog';

const controlClass = mergeStyleSets({
  control: {
    margin: '0 0 15px 0',
    maxWidth: '300px',
  },
});

export default class ReactFormik extends React.Component<IReactFormikProps, IReactFormikState> {

  private cancelIcon: IIconProps = { iconName: 'Cancel' };
  private saveIcon: IIconProps = { iconName: 'Save' };
  private _services: SPService = null;

  constructor(props: Readonly<IReactFormikProps>) {
    super(props);
    this.state = {
      startDate: null,
      endDate: null
    }
    sp.setup({
      spfxContext: this.props.context
    });

    this._services = new SPService(this.props.siteUrl);
    this.createRecord = this.createRecord.bind(this);
  }

  /** set field value and error message for all the fields */
  private getFieldProps = (formik: FormikProps<any>, field: string) => {
    return { ...formik.getFieldProps(field), errorMessage: formik.errors[field] as string }
  }

  /** create record in sharepoint list */
  public async createRecord(record: any) {
    let item = await this._services.createTask("Tasks", {
      Title: record.name,
      TaskDetails: record.details,
      StartDate: record.startDate,
      EndDate: new Date(record.endDate),
      ProjectName: record.projectName,
    }).then((data) => {
      Dialog.alert("Record inseterd successfully !!!");
      return data;
    }).catch((err) => {
      console.error(err);
      throw err;
    });
  }

  public render(): React.ReactElement<IReactFormikProps> {
    /** validations */
    const validate = yup.object().shape({
      name: yup.string().required('Task name is required'),
      details: yup.string()
        .min('15', 'Minimum required 15 characters')
        .required('Task detail is required'),
      projectName: yup.string().required('Please select a project'),
      startDate: yup.date().required('Please select a start date').nullable(),
      endDate: yup.date().required('Please select a end date').nullable()
    })

    return (
      <Formik initialValues={{
        name: '',
        details: '',
        projectName: '',
        startDate: null,
        endDate: null
      }}
        validationSchema={validate}
        onSubmit={(values, helpers) => {
          console.log('SUCCESS!! :-)nn' + JSON.stringify(values, null, 4));
          this.createRecord(values).then(response => {
            helpers.resetForm()
          });
        }}>
        { formik => (
          <div className={styles.reactFormik}>
            <Stack>
              <Label className={styles.lblForm}>Current User</Label>
              <PeoplePicker
                context={this.props.context as any}
                personSelectionLimit={1}
                showtooltip={true}
                showHiddenInUI={false}
                principalTypes={[PrincipalType.User]}
                ensureUser={true}
                disabled={true}
                defaultSelectedUsers={[this.props.context.pageContext.user.email as any]}
              />

              <Label className={styles.lblForm}>Task Name</Label>
              <TextField
                {...this.getFieldProps(formik, 'name')} />

              <Label className={styles.lblForm}>Project Name</Label>
              <Dropdown
                options={
                  [
                    { key: 'Project1', text: 'Project1' },
                    { key: 'Project2', text: 'Project2' },
                    { key: 'Project3', text: 'Project3' },
                  ]
                }
                {...this.getFieldProps(formik, 'projectName')}
                onChange={(event, option) => { formik.setFieldValue('projectName', option.key.toString()) }}
              />

              <Label className={styles.lblForm}>Start Date</Label>
              <DatePicker
                className={controlClass.control}
                id="startDate"
                value={formik.values.startDate}
                textField={{ ...this.getFieldProps(formik, 'startDate') }}
                onSelectDate={(date) => formik.setFieldValue('startDate', date)}
              />

              <Label className={styles.lblForm}>End Date</Label>
              <DatePicker
                className={controlClass.control}
                id="endDate"
                value={formik.values.endDate}
                textField={{ ...this.getFieldProps(formik, 'endDate') }}
                onSelectDate={(date) => formik.setFieldValue('endDate', date)}
              />

              <Label className={styles.lblForm}>Task Details</Label>
              <TextField
                multiline
                rows={6}
                {...this.getFieldProps(formik, 'details')} />

            </Stack>
            <PrimaryButton
              type="submit"
              text="Save"
              iconProps={this.saveIcon}
              className={styles.btnsForm}
              onClick={formik.handleSubmit as any}
            />
            <PrimaryButton
              text="Cancel"
              iconProps={this.cancelIcon}
              className={styles.btnsForm}
              onClick={formik.handleReset}
            />
          </div>
        )
        }
      </Formik >
    );
  }
}
6. Move to the ReactFormik.module.scss file to add some relaetd CSS.
@import '~office-ui-fabric-react/dist/sass/References.scss';
.reactFormik{
  .btnsForm {
    background-color: "[theme:themePrimary, default:#0078d7]";
    border-color: "[theme: themePrimary, default: #0078d7]";
    color: "[theme:white, default:white]" ;
    margin-left: 10px;
    margin-top: 10px;
  }
  .customErrorMeesage{
    color: var(--red-color);
    font-size: 10px;
    font-family: 'Light';
    padding: 2px;
  }
  .lblForm{
  font-size: 15px;
  margin:  5px 0px 5px 0px;
  }
}
Now serve the application using the below command,
gulp serve
Now test the webpart in SharePoint-SiteURL + /_layouts/15/workbench.aspx.
Output

Find the full source code here.
Summary
In this article, we have seen how to implement react formik library in SPFx.
I hope this helps.
Sharing is caring!!
by Contributed | May 26, 2021 | Technology
This article is contributed. See the original author and article here.
Overview
This blog post outlines a list of monitoring metrics that can be used to monitor the Azure Kubernetes Services (AKS) platform health and availability. These are additional to the recommended alerts (preview) that can be found here, “recommended metric alerts (preview) from Container insights”.
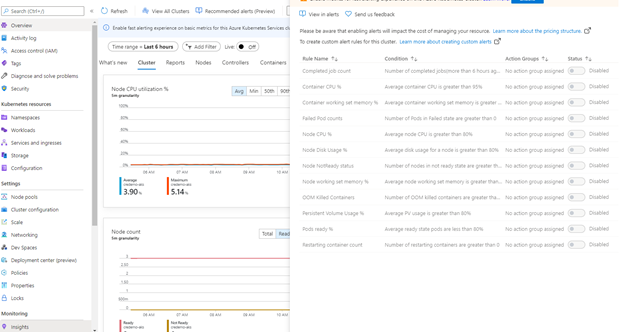
Where can you see the recommended alerts ?
In the Azure Portal, navigate to the AKS cluster page, under monitoring section, click on “Insights” to see the recommended alerts options.
Why additional monitors?
When I was involved in AKS cluster setup, I was setting up end-to-end monitoring and alerting. I had hundreds of questions running around my head on what to be monitored at first place? There are numerous components in AKS platform, such as system specific services, pods and containers, hosted applications, and other supporting components. How to figure out the list of components or services to be monitored. How to determine the platform health, availability, and reliability? In what condition these should be turned into an alert?
I went through the predefined list of alerts and realized that they may not be adequate for my requirement. The AKS cluster that hosted my monitoring solution was a shared hosting platform. The requirement was to monitor the platform health (Cluster level) and health status of each hosted applications. But the question was, what data I should use to define platform health, hosted application health, and when to turn them into an alert.
So, I decided to prepare a list of monitor metrics :
(1) For monitoring cluster health.
(2) For monitoring hosted applications level.
These metrics include monitoring of individual components and services that could impact the cluster availability and health.
In this blog I focus on a first set of alerts that can be added in addition to the recommended alerts (preview) in the Azure portal for AKS monitoring. These alerts are created using the Kusto Query Langauge to query the log analytics workspace. You can manually execute
these queries to see the specific information and can also be setup as an automated alert.
Pod scale out (hpa)
Container insights automatically monitors the deployment and HPA with specific metrics, and these are collected at every 60 seconds interval in the InsightMetrics table. The list of available metrics name can be referred in the Azure docs.
The log search query pulls the Pod scale out data from Insight Metrics table and joins the output from “KubePodInventory” to get the number of scaled out replicas in each deployment. The additional logic calculate the scale out percentage with the maximum number of replicas configured in HPA (The HPA specific information is collected in “kube_hpa_status_current_replicas”).
This query returns the results of any application that are hosted with hpa in non-system namespace.
let _minthreshold = 70; // minimum threshold goes here if you want to setup as an alert
let _maxthreshold = 90; // maximum threshold goes here if you want to setup as an alert
let startDateTime = ago(60m);
KubePodInventory
| where TimeGenerated >= startDateTime
| where Namespace !in('default', 'kube-system') // List of non system namespace filter goes here.
| extend labels = todynamic(PodLabel)
| extend deployment_hpa = reverse(substring(reverse(ControllerName), indexof(reverse(ControllerName), "-") + 1))
| distinct tostring(deployment_hpa)
| join kind=inner (InsightsMetrics
    | where TimeGenerated > startDateTime
    | where Name == 'kube_hpa_status_current_replicas'
    | extend pTags = todynamic(Tags) //parse the tags for values
    | extend ns = todynamic(pTags.k8sNamespace) //parse namespace value from tags
    | extend deployment_hpa = todynamic(pTags.targetName) //parse HPA target name from tags
    | extend max_reps = todynamic(pTags.spec_max_replicas) // Parse maximum replica settings from HPA deployment
    | extend desired_reps = todynamic(pTags.status_desired_replicas) // Parse desired replica settings from HPA deployment
    | summarize arg_max(TimeGenerated, *) by tostring(ns), tostring(deployment_hpa), Cluster=toupper(tostring(split(_ResourceId, '/')[8])), toint(desired_reps), toint(max_reps), scale_out_percentage=(desired_reps * 100 / max_reps)
    //| where scale_out_percentage > _minthreshold and scale_out_percentage <= _maxthreshold
    )
    on deployment_hpa
Nodepool scale outs
The following query returns the number of active nodes in each node pools. The additional logic calculates the number of available active node and the max node configuration in the auto-scaler settings to determine the scale out percentage. This is useful when it comes to monitoring the underlying node infrastructure availability for scaling requirement.
let nodepoolMaxnodeCount = 10; // the maximum number of nodes in your auto scale setting goes here.
let _minthreshold = 20;
let _maxthreshold = 90;
let startDateTime = 60m;
KubeNodeInventory
| where TimeGenerated >= ago(startDateTime)
| extend nodepoolType = todynamic(Labels) //Parse the labels to get the list of node pool types
| extend nodepoolName = todynamic(nodepoolType[0].agentpool) // parse the label to get the nodepool name or set the specific nodepool name (like nodepoolName = 'agentpool)'
| summarize nodeCount = count(Computer) by ClusterName, tostring(nodepoolName), TimeGenerated
//(Uncomment the below two lines to set this as an log search alert)
//| extend scaledpercent = iff(((nodeCount * 100 / nodepoolMaxnodeCount) >= _minthreshold and (nodeCount * 100 / nodepoolMaxnodeCount) < _maxthreshold), "warn", "normal")
//| where scaledpercent == 'warn'
| summarize arg_max(TimeGenerated, *) by nodeCount, ClusterName, tostring(nodepoolName)
| project ClusterName,
    TotalNodeCount= strcat("Total Node Count: ", nodeCount),
    ScaledOutPercentage = (nodeCount * 100 / nodepoolMaxnodeCount),
    TimeGenerated,
    nodepoolName
System containers (replicaset) availability
This query monitors the system containers (replicasets) and report the unavailable percentage.
let startDateTime = 5m; // the minimum time interval goes here
let _minalertThreshold = 50; //Threshold for minimum and maximum unavailable or not running containers
let _maxalertThreshold = 70;
KubePodInventory
| where TimeGenerated >= ago(startDateTime)
| distinct ClusterName, TimeGenerated
| summarize Clustersnapshot = count() by ClusterName
| join kind=inner (
    KubePodInventory
    | where TimeGenerated >= ago(startDateTime)
    | where Namespace in('default', 'kube-system') and ControllerKind == 'ReplicaSet' // the system namespace filter goes here
    | distinct ClusterName, Computer, PodUid, TimeGenerated, PodStatus, ServiceName, PodLabel, Namespace, ContainerStatus
    | summarize arg_max(TimeGenerated, *), TotalPODCount = count(), podCount = sumif(1, PodStatus == 'Running' or PodStatus != 'Running'), containerNotrunning = sumif(1, ContainerStatus != 'running')
        by ClusterName, TimeGenerated, ServiceName, PodLabel, Namespace
    )
    on ClusterName
| project ClusterName, ServiceName, podCount, containerNotrunning, containerNotrunningPercent = (containerNotrunning * 100 / podCount), TimeGenerated, PodStatus, PodLabel, Namespace, Environment = tostring(split(ClusterName, '-')[3]), Location = tostring(split(ClusterName, '-')[4]), ContainerStatus
//Uncomment the below line to set for automated alert
//| where PodStatus == "Running" and containerNotrunningPercent > _minalertThreshold and containerNotrunningPercent < _maxalertThreshold
| summarize arg_max(TimeGenerated, *), c_entry=count() by PodLabel, ServiceName, ClusterName
//Below lines are to parse the labels to identify the impacted service/component name
| extend parseLabel = replace(@'k8s-app', @'k8sapp', PodLabel)
| extend parseLabel = replace(@'app.kubernetes.io/component', @'appkubernetesiocomponent', parseLabel)
| extend parseLabel = replace(@'app.kubernetes.io/instance', @'appkubernetesioinstance', parseLabel)
| extend tags = todynamic(parseLabel)
| extend tag01 = todynamic(tags[0].app)
| extend tag02 = todynamic(tags[0].k8sapp)
| extend tag03 = todynamic(tags[0].appkubernetesiocomponent)
| extend tag04 = todynamic(tags[0].aadpodidbinding)
| extend tag05 = todynamic(tags[0].appkubernetesioinstance)
| extend tag06 = todynamic(tags[0].component)
| project ClusterName, TimeGenerated,
    ServiceName = strcat( ServiceName, tag01, tag02, tag03, tag04, tag05, tag06),
    ContainerUnavailable = strcat("Unavailable Percentage: ", containerNotrunningPercent),
    PodStatus = strcat("PodStatus: ", PodStatus),
    ContainerStatus = strcat("Container Status: ", ContainerStatus)
System containers (daemonsets) availability
This query monitors the system containers (daemonsets) and report the unavailable percentage.
let startDateTime = 5m; // the minimum time interval goes here
let _minalertThreshold = 50; //Threshold for minimum and maximum unavailable or not running containers
let _maxalertThreshold = 70;
KubePodInventory
| where TimeGenerated >= ago(startDateTime)
| distinct ClusterName, TimeGenerated
| summarize Clustersnapshot = count() by ClusterName
| join kind=inner (
    KubePodInventory
    | where TimeGenerated >= ago(startDateTime)
    | where Namespace in('default', 'kube-system') and ControllerKind == 'DaemonSet' // the system namespace filter goes here
    | distinct ClusterName, Computer, PodUid, TimeGenerated, PodStatus, ServiceName, PodLabel, Namespace, ContainerStatus
    | summarize arg_max(TimeGenerated, *), TotalPODCount = count(), podCount = sumif(1, PodStatus == 'Running' or PodStatus != 'Running'), containerNotrunning = sumif(1, ContainerStatus != 'running')
        by ClusterName, TimeGenerated, ServiceName, PodLabel, Namespace
    )
    on ClusterName
| project ClusterName, ServiceName, podCount, containerNotrunning, containerNotrunningPercent = (containerNotrunning * 100 / podCount), TimeGenerated, PodStatus, PodLabel, Namespace, Environment = tostring(split(ClusterName, '-')[3]), Location = tostring(split(ClusterName, '-')[4]), ContainerStatus
//Uncomment the below line to set for automated alert
//| where PodStatus == "Running" and containerNotrunningPercent > _minalertThreshold and containerNotrunningPercent < _maxalertThreshold
| summarize arg_max(TimeGenerated, *), c_entry=count() by PodLabel, ServiceName, ClusterName
//Below lines are to parse the labels to identify the impacted service/component name
| extend parseLabel = replace(@'k8s-app', @'k8sapp', PodLabel)
| extend parseLabel = replace(@'app.kubernetes.io/component', @'appkubernetesiocomponent', parseLabel)
| extend parseLabel = replace(@'app.kubernetes.io/instance', @'appkubernetesioinstance', parseLabel)
| extend tags = todynamic(parseLabel)
| extend tag01 = todynamic(tags[0].app)
| extend tag02 = todynamic(tags[0].k8sapp)
| extend tag03 = todynamic(tags[0].appkubernetesiocomponent)
| extend tag04 = todynamic(tags[0].aadpodidbinding)
| extend tag05 = todynamic(tags[0].appkubernetesioinstance)
| extend tag06 = todynamic(tags[0].component)
| project ClusterName, TimeGenerated,
    ServiceName = strcat( ServiceName, tag01, tag02, tag03, tag04, tag05, tag06),
    ContainerUnavailable = strcat("Unavailable Percentage: ", containerNotrunningPercent),
    PodStatus = strcat("PodStatus: ", PodStatus),
    ContainerStatus = strcat("Container Status: ", ContainerStatus)
Individual Container restarts
This query monitors the individual system container restart counts for last 10 minutes
let _threshold = 10m;
let _alertThreshold = 2;
let Timenow = (datetime(now) - _threshold);
let starttime = ago(5m);
KubePodInventory
| where TimeGenerated >= starttime
| where Namespace in ('default', 'kube-system') // the namespace filter goes here
//| where ContainerRestartCount > _alertThreshold
| extend Tags = todynamic(ContainerLastStatus)
| extend startedAt = todynamic(Tags.startedAt)
| where startedAt >= Timenow
| summarize arg_max(TimeGenerated, *) by Name
Use the below steps to test these queries and it’s results.
1. Sign in to the Azure portal.
2. In the Azure portal, search for and select Log Analytics workspaces supporting Container insights.
3. In the pane on the left side, select Logs to open the Azure Monitor logs page. You use this page to write and execute Azure log queries.
4. On the Logs page, paste one of the queries provided earlier into the Search query field and then select Run to validate the results.
The below steps walks through how to create the above queries as an alert rule. Please make sure to uncomment those lines where the threshold has been set to filter the results.
Create an alert rule
1. Sign in to the Azure portal
2. In the Azure portal, search for and select Log Analytics workspaces supporting Container insights.
3. In the left pane, select “Alerts” and click on “+New Alert rule.”
4. In the create alert rule page, select “Add condition”
5. In the “select a signal” page, choose “Custom log search”
6. Paste the alert query in the “Search query” box.
7. Choose “Number of results” under Alert Logic “Based on” option and set “Number of results” ‘Greater than’ and “Threshold value” as ‘0’. (I use “Number of results” instead of “Metrics measurement” as the filtering of result based on threshold is done at the query level.)
8. Set the period and frequency according to your requirement.
9. Click on “Done” to create the condition.
10. Fill the other details like “Alert rule name”, Actions to save the alert rule.
Conclusion
With these monitors, you will have better visibility on the system containers availability, pod and node scale out events. I am drafting the second set of additional monitors which I will publish them in the part 2. Please watch this space for part -2 link.
Happy Monitoring !

Recent Comments