Monitoring GPU Metrics in AKS with Azure Managed Prometheus, DCGM Exporter and Managed Grafana

Monitoring GPU Metrics in AKS with Azure Managed Prometheus, DCGM Exporter and Managed Grafana

This article is contributed. See the original author and article here.

Azure Monitor managed service for Prometheus provides a production-grade solution for monitoring without the hassle of installation and maintenance. By leveraging these managed services, we can focus on extracting insights from your metrics and logs rather than managing the underlying infrastructure.


The integration of essential GPU metrics—such as Framebuffer Memory Usage, GPU Utilization, Tensor Core Utilization, and SM Clock Frequencies—into Azure Managed Prometheus and Grafana enhances the visualization of actionable insights. This integration facilitates a comprehensive understanding of GPU consumption patterns, enabling more informed decisions regarding optimization and resource allocation.


Azure Managed Prometheus recently announced general availability of Operator and CRD support, which will enable customers to customize metrics collection and add scraping of metrics from workloads and applications using Service and Pod Monitors, similar to the OSS Prometheus Operator.


This blog will demonstrate how we leveraged the CRD/Operator support in Azure Managed Prometheus and used the Nvidia DCGM Exporter and Grafana to enable GPU monitoring.


GPU monitoring


As the use of GPUs has skyrocketed for deploying large language models (LLMs) for both inference and fine-tuning, monitoring these resources becomes critical to ensure optimal performance and utilization. Prometheus, an open-source monitoring and alerting toolkit, coupled with Grafana, a powerful dashboarding and visualization tool, provides an excellent solution for collecting, visualizing, and acting on these metrics.


Essential metrics such as Framebuffer Memory Usage, GPU Utilization, Tensor Core Utilization, and SM Clock Frequencies serve as fundamental indicators of GPU consumption, offering invaluable insights into the performance and efficiency of graphics processing units, and thereby enabling us to reduce our COGs and improve operations.


Using Nvidia’s DGCM Exporter with Azure Managed Prometheus


The DGCM Exporter is a tool developed by Nvidia to collect and export GPU metrics. It runs as a pod on Kubernetes clusters and gathers various metrics from Nvidia GPUs, such as utilization, memory usage, temperature, and power consumption. These metrics are crucial for monitoring and managing the performance of GPUs.


You can integrate this exporter with Azure Managed Prometheus. The section below in blog describes the steps and changes needed to deploy the DCGM Exporter successfully.


Prerequisites


Before we jump straight to the installation, ensure your AKS cluster meets the following requirements:


  1. GPU Node Pool: Add a node pool with the required VM SKU that includes GPU support.

  2. GPU Driver: Ensure the NVIDIA Kubernetes device plugin driver is running as a DaemonSet on your GPU nodes.

  3. Enable Azure Managed Prometheus and Azure Managed Grafana on your AKS cluster.


Refactoring Nvidia DCGM Exporter for AKS: Code Changes and Deployment Guide


Updating API Versions and Configurations for Seamless Integration


As per the official documentation, the best way to get started with DGCM Exporter is to install it using Helm. When installing over AKS with Managed Prometheus, you might encounter the below error:


Error: Installation Failed: Unable to build Kubernetes objects from release manifest: resource mapping not found for name: "dcgm-exporter-xxxxx" namespace: "default" from "": no matches for kind "ServiceMonitor" in version "monitoring.coreos.com/v1". Ensure CRDs are installed first.


To resolve this, follow these steps to make necessary changes in the DCGM code:


  1. Clone the Project: Go to the GitHub repository of the DCGM Exporter and clone the project or download it to your local machine.

  2. Navigate to the Template Folder: The code used to deploy the DCGM Exporter is located in the template folder within the deployment folder.

  3. Modify the service-monitor.yaml File: Find the file service-monitor.yaml. The apiVersion key in this file needs to be updated from monitoring.coreos.com/v1 to azmonitoring.coreos.com/v1. This change allows the DCGM Exporter to use the Azure managed Prometheus CRD.


apiVersion: azmonitoring.coreos.com/v1


4. Handle Node Selectors and Tolerations: GPU node pools often have tolerations and node selector tags. Modify the values.yaml file in the deployment folder to handle these configurations:


nodeSelector:
  accelerator: nvidia

tolerations:
- key: "sku"
  operator: "Equal"
  value: "gpu"
  effect: "NoSchedule"


Helm: Packaging, Pushing, and Installation on Azure Container Registry


We followed the MS Learn documentation for pushing and installing the package through Helm on Azure Container Registry. For a comprehensive understanding, you can refer to the documentation. Here are the quick steps for installation:


After making all the necessary changes in the deployment folder on the source code, be on that directory to package the code. Log in to your registry to proceed further.


1. Package the Helm chart and login to your container registry:


helm package .
helm registry login  --username $USER_NAME --password $PASSWORD


2. Push the Helm Chart to the Registry:


helm push dcgm-exporter-3.4.2.tgz oci:///helm


3. Verify that the package has been pushed to the registry on Azure portal.


4. Install the chart and verify the installation:


helm install dcgm-nvidia oci:///helm/dcgm-exporter -n gpu-resources
#Check the installation on your AKS cluster by running:
helm list -n gpu-resources
#Verify the DGCM Exporter:
Kubectl get po -n gpu-resources
Kubectl get ds -n gpu-resources


You can now check that the DGCM Exporter is running on the GPU nodes as a DaemonSet.


Exporting GPU Metrics and Configuring Azure Managed Grafana Dashboard


Once the DGCM Exporter DaemonSet is running across all GPU node pools, you need to export the GPU metrics generated by this workload to Azure Managed Prometheus. This is accomplished by deploying a PodMonitor resource. Follow these steps:


  1. Deploy the PodMonitor: Apply the following YAML configuration to deploy the PodMonitor:


apiVersion: azmonitoring.coreos.com/v1
kind: PodMonitor
metadata:
  name: nvidia-dcgm-exporter
  labels:
    app.kubernetes.io/name: nvidia-dcgm-exporter
spec:
  selector:
    matchLabels:
      app.kubernetes.io/name: nvidia-dcgm-exporter
  podMetricsEndpoints:
  - port: metrics
    interval: 30s
  podTargetLabels:


2. Check if the PodMonitor is deployed and running by executing:


kubectl get podmonitor -n 


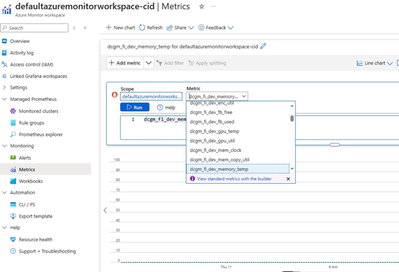
3. Verify Metrics export: Ensure that the metrics are being exported to Azure Managed Prometheus on the portal by navigating to the “Metrics” page on your Azure Monitor Workspace.


gpu-metrics.png


Create the DGCM Dashboard on Azure Managed Grafana


The GitHub repository for the DGCM Exporter includes a JSON file for the Grafana dashboard. Follow the MS Learn documentation to import this JSON into your Managed Grafana instance.


After importing the JSON, the dashboard displaying GPU metrics will be visible on Grafana.


dashboard.png


Azure Infra Girls LATAM: Certificación AZ-900 (Azure Fundamentals)

Azure Infra Girls LATAM: Certificación AZ-900 (Azure Fundamentals)

This article is contributed. See the original author and article here.

La computación en la nube está revolucionando diversas áreas de la tecnología, incluyendo programación, datos, inteligencia artificial (IA) y seguridad. Para ayudar a los profesionales a especializarse en esta área en constante evolución, Microsoft está lanzando la iniciativa Azure Infra Girls. Este programa ofrece una serie de cuatro clases en vivo, gratuitas y en español, que se llevarán a cabo del 3 al 24 de septiembre, a las 12:30pm (GMT-6, Ciudad de México).


REGÍSTRATE AQUÍ: aka.ms/AzureInfraGirlsLATAM


cynthiazanoni_1-1723035711889.png

Durante estas sesiones, los participantes tendrán la oportunidad de profundizar sus conocimientos en computación en la nube y prepararse para la certificación AZ-900 (Azure Fundamentals), a través de una ruta de aprendizaje con cursos certificados en Microsoft Learn.


Todas nuestras sesiones comenzaran en base a la zona horaria de Ciudad de México. 


Sesión Descripción

Conceptos de computación en la nube con Microsoft Azure 


Sept 3, 12:30PM Mexico City (GMT-6) 


En el primer episodio de Azure Infra Girls, aprenderás sobre los conceptos básicos de la programación en la nube. Comprenderás qué son las nubes públicas, privadas e híbridas, los beneficios y los tipos de servicios, como IaaS, PaaS, SaaS, Serverless, y cómo usar Azure para desarrollar tus aplicaciones. 

Arquitectura y servicios de Azure 


Sept 11, 12:30PM Mexico City (GMT-6) 


En la segunda sesión, profundizaremos en los conceptos de arquitectura y servicios de Azure, con algunos ejercicios prácticos para crear un Escritorio Virtual (Azure Virtual Desktop) y alojar un recurso en Azure. 

Administración y gobernanza de Azure 


Sept 17, 12:30PM Mexico City (GMT-6) 


En la tercera sesión, abordaremos los servicios de administración y gobernanza de Azure, analizando el control de costos, las funcionalidades y herramientas de gobernanza, el cumplimiento y la supervisión. 

Simulacion del examen Azure Fundamentals AZ-900  


Sept 24, 12:30PM Mexico City (GMT-6) 


En esta sesión, realizaremos un simulacro del examen con preguntas relacionadas con los temas. Estarán relacionados, sobre conceptos de nube, arquitectura y servicios de Azure. Asimismo, con administración y gobernanza. 


cynthiazanoni_0-1723036363759.png


Para aquellos que desean profundizar en la computación en la nube y prepararse para la certificación AZ-900 Azure Fundamentals, tenemos una ruta de aprendizaje completa disponible en Microsoft Learn. Esta ruta aborda las principales áreas de la certificación, permitiéndote estudiar de forma gratuita y a tu propio ritmo. Además, al completar los cursos, podrás obtener certificados que pueden ser añadidos a tu perfil de LinkedIn, destacando tus nuevas habilidades y conocimientos.


Los módulos de Microsoft Learn para la certificación AZ-900 incluyen:


Práctica para el examen:


  • Evaluación de sus conocimientos: estas evaluaciones le proporcionarán una infomacion general del estilo, la redacción y la dificultad de las preguntas que probablemente verá en el examen. A través de estas valoraciones, puede evaluar su preparación, determinar dónde necesita preparación adicional y llenar los vacíos de conocimiento para aumentar la probabilidad de aprobar el examen.

  • Demostración de experiencia: aquí puede experimentar con el aspecto del examen antes de realizarlo. Podrá interactuar con diferentes tipos de preguntas en la misma interfaz de usuario que usará durante el examen.


Regístrate y Participa

No te pierdas esta increíble oportunidad para seguir aprendiendo y avanzar en tu carrera tecnológica. Únete a Azure Infra Girls y comienza tu viaje hacia la especialización en computación en la nube con Microsoft. Esperamos verte en nuestras sesiones en vivo y ayudarte a alcanzar tus objetivos profesionales en el mundo de la tecnología.

REGÍSTRATE AQUÍ: aka.ms/AzureInfraGirlsLATAM

Monitoring GPU Metrics in AKS with Azure Managed Prometheus, DCGM Exporter and Managed Grafana

Learn about AppJetty’s ISV Success for Business Applications solution in Microsoft AppSource

This article is contributed. See the original author and article here.

Microsoft ISV Success for Business Applications offers platforms, resources, and support designed to help partners develop, publish, and market business apps. Learn more about this offer from AppJetty:


AppJetty Logo.png

MappyField 365: MappyField 365 is a powerful geo-mapping plugin for Microsoft Dynamics 365 that boosts business productivity with advanced features like live tracking, geographic data visualization, proximity search, auto-scheduling, auto check-ins, territory management, and heat maps. Accelerate your business across organizations with location intelligence from AppJetty.


Windows 365 at three years: Customer-centric solutions for security, management and productivity

Windows 365 at three years: Customer-centric solutions for security, management and productivity

This article is contributed. See the original author and article here.

You have navigated the complex and changing realities of the hybrid workplace, found new ways to move aspects of your business to the cloud, and kept employees and critical business operations connected and running in a challenging cyber security environment.

The post Windows 365 at three years: Customer-centric solutions for security, management and productivity appeared first on Microsoft 365 Blog.

Brought to you by Dr. Ware, Microsoft Office 365 Silver Partner, Charleston SC.

Windows 365 at three years: Customer-centric solutions for security, management and productivity

New ways to get creative with Microsoft Designer, powered by AI

This article is contributed. See the original author and article here.

Every creative process begins with an idea—and that idea starts with you. Today we’re announcing that the Microsoft Designer app is now generally available with a personal Microsoft account, with new features that help you create and edit like never before.

The post New ways to get creative with Microsoft Designer, powered by AI appeared first on Microsoft 365 Blog.

Brought to you by Dr. Ware, Microsoft Office 365 Silver Partner, Charleston SC.