by Contributed | May 12, 2022 | Technology
This article is contributed. See the original author and article here.
Today, I worked on a service request that our customer needs to add the IP for Azure SQL node that is executing any elastic query.
We have the following situation:
- In the server $serverSource and database $DbSource we have a table called dummy that is an external table that, using elastic query is connecting to $serverTarget and other database.
- As the Azure SQL firewall has not defined the IP address of the SQL Azure node that is running the query they are getting the following error: “Exception calling “ExecuteNonQuery” with “0” argument(s): “An error occurred while establishing connection to remote data source: [Microsoft][ODBC Driver17 for SQL Server][SQL Server]Cannot open server ‘servername’ requested by the login. Client with IP address ‘xxx.xxx.xxx.xxx’ is not allowed to access the server. To enable access, use the Windows Azure Management Portal or run sp_set_firewall_rule on the master database to create a firewall rule for this IP address or address range. It may take up to five minutes for this change to take effect.[Microsoft][ODBC Driver 17 for SQL Server][SQL Server]Cannot open server ‘servername’ requested by the login. Client with IP address ‘xxx.xxx.xxx.xxx’ is not allowed to access the server. To enable access, use the Windows Azure Management Portal or run sp_set_firewall_rule on the master database to create a firewall rule for this IP address or address range. It may take up to five minutes for this change to take effect.”
Why?:
- This issue is explained in this article
Solution proposed as an example:
- Connect to the server $ServerSource and database $DbSource
- Run the query “select * from dummy”. This table is the external table that makes a reference.
- If we obtain an error:
- Obtain the IP of the SQL Azure Node.
- Connect to the server $ServerTarget and database master
- Run sp_set_firewall_rule to add this IP
- The next connection will be fine and it won’t return any error.
- As a note, of course, we need to maintain the number of IP added.
$serverTarget = "ServerNameThatHasTheReferenceTable.database.windows.net"
$userTarget = "UserNameThatHasTheReferenceTable" #UserName parameter  to connect
$passwordTarget = "PasswordThatHasTheReferenceTable" #Password Parameter  to connect
$DbTarget = "master" #DBName Parameter  to connect

$serverSource = "ServerNameThatHasDefinedExternalTable.database.windows.net"
$userSource = "UserNameThatHasDefinedExternalTable" #UserName parameter  to connect
$passwordSource = "PasswordThatHasDefinedExternalTable" #Password Parameter  to connect
$DbSource = "DBNameThatHasDefinedExternalTable" #DBName Parameter  to connect

#----------------------------------------------------------------
#Function to connect to the target database using a retry-logic
#----------------------------------------------------------------

Function GiveMeConnectionTarget()
{
  for ($i=1; $i -lt 10; $i++)
  {
   try
    {
      logMsg( "Connecting to the database...Attempt #" + $i) (1)
      logMsg( "Connecting to server: " + $serverTarget + " - DB: " + $DbTarget) (1)

      $SQLConnection = New-Object System.Data.SqlClient.SqlConnection
      $SQLConnection.ConnectionString = "Server="+$serverTarget+";Database="+$dbTarget+";User ID="+$userTarget+";Password="+$passwordTarget+";Connection Timeout=60;Application Name=Tester;Pooling=True"
      $SQLConnection.Open()
      logMsg("Connected to the database...") (1)
      return $SQLConnection
      break;
    }
  catch
   {
    logMsg("Not able to connect - Retrying the connection..." + $Error[0].Exception) (2)
    Start-Sleep -s 5
   }
  }
}

#----------------------------------------------------------------
#Function to connect to the source database using a retry-logic
#----------------------------------------------------------------

Function GiveMeConnectionSource()
{
  for ($i=1; $i -lt 10; $i++)
  {
   try
    {
      logMsg( "Connecting to the database...Attempt #" + $i) (1)
      logMsg( "Connecting to server: " + $serverSource + " - DB: " + $DbSource ) (1)

      $SQLConnection = New-Object System.Data.SqlClient.SqlConnection
      $SQLConnection.ConnectionString = "Server="+$serverSource+";Database="+$dbSource+";User ID="+$userSource+";Password="+$passwordSource+";Connection Timeout=60;Application Name=Tester;Pooling=True"
      $SQLConnection.Open()
      logMsg("Connected to the database...") (1)
      return $SQLConnection
      break;
    }
  catch
   {
    logMsg("Not able to connect - Retrying the connection..." + $Error[0].Exception) (2)
    Start-Sleep -s 5
   }
  }
}

#----------------------------------------------------------------
#Function to execute any elastic query using a command retry-logic
#----------------------------------------------------------------

Function ExecuteQuerySource($query)
{
  for ($i=1; $i -lt 3; $i++)
  {
   try
    {
     $SQLConnectionSource = GiveMeConnectionSource
     $command = New-Object -TypeName System.Data.SqlClient.SqlCommand
     $command.CommandTimeout = 6000
     $command.Connection=$SQLConnectionSource
     $command.CommandText = $query
     $command.ExecuteNonQuery() | Out-Null
    break;
    }
  catch
   {
    $ErrorMsg = $Error[0].Exception
    return $ErrorMsg
   }
  }
}

#----------------------------------------------------------------
#Function to add the firewall rule
#----------------------------------------------------------------

Function ExecuteQueryTarget( $IP)
{
  for ($i=1; $i -lt 3; $i++)
  {
   try
    {
     $SQLConnectionSource = GiveMeConnectionTarget
     $commandText = "EXECUTE sp_set_firewall_rule @name = N'TestContosoFirewallRule"+ $IP + "',"
     $commandText = $commandText + "@start_ip_address = '" + $IP+ "',"
     $commandText = $commandText + "@end_ip_address = '" + $IP+ "'"
     $command = New-Object -TypeName System.Data.SqlClient.SqlCommand
     $command.CommandTimeout = 6000
     $command.Connection=$SQLConnectionSource
     $command.CommandText = $commandText
     $command.ExecuteNonQuery() | Out-Null
    break;
    }
  catch
   {
    logMsg("Not able to run the query - Retrying the operation..." + $Error[0].Exception) (2)
    Start-Sleep -s 2
   }
  }
}

#--------------------------------
#Log the operations
#--------------------------------
function logMsg
{
    Param
    (
         [Parameter(Mandatory=$true, Position=0)]
         [string] $msg,
         [Parameter(Mandatory=$false, Position=1)]
         [int] $Color
    )
  try
   {
    $Fecha = Get-Date -format "yyyy-MM-dd HH:mm:ss"
    $msg = $Fecha + " " + $msg
    $Colores="White"
    $BackGround =
    If($Color -eq 1 )
     {
      $Colores ="Cyan"
     }
    If($Color -eq 3 )
     {
      $Colores ="Yellow"
     }

     if($Color -eq 2)
      {
        Write-Host -ForegroundColor White -BackgroundColor Red $msg
      }
     else
      {
        Write-Host -ForegroundColor $Colores $msg
      }


   }
  catch
  {
    Write-Host $msg
  }
}

#--------------------------------
#Empty?
#--------------------------------
function TestEmpty($s)
{
if ([string]::IsNullOrWhitespace($s))
  {
    return $true;
  }
else
  {
    return $false;
  }
}


#--------------------------------
#Give the IP that is trying to connect
#--------------------------------

function GiveMeIP
{
Param([Parameter(Mandatory=$true)]
      [System.String]$Text)
  try
   {
    $Pos = $Text.IndexOf("Client with IP address '")
    $return= $Text.substring( $Pos+24)
    $PosUntil = $Return.IndexOf("'")
    $return = $Return.substring(0,$PosUntil )
    return $Return
   }
  catch
  {
    $return= $Text
    return $Return
  }
}

cls

logMsg("Starting the process") (2)
$ErrorMsg = ExecuteQuerySource("Select * from dummy")
if(TestEmpty($ErrorMsg) -eq $true)
{
}
else
{
   logMsg("Adding the IP.." + $IP) (2)
   $IP = GiveMeIP($ErrorMsg)
   ExecuteQueryTarget($IP)
   logMsg("Added the IP.." + $IP) (2)
}
logMsg("Finished the process") (2)
Enjoy!
by Contributed | May 11, 2022 | Technology
This article is contributed. See the original author and article here.
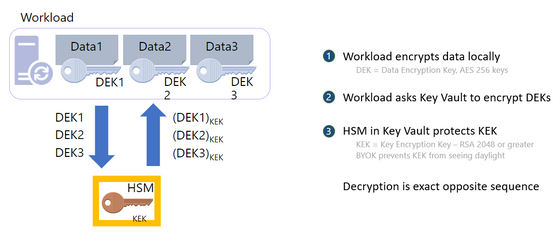
At Microsoft, we value, protect, and defend privacy. We believe in transparency, so that people and organizations can control their data and have meaningful choices in how it is used. We empower and defend the privacy choices of every person who uses our products and services. In this blog, we will take a deep dive on Microsoft’s Azure Key Vault Managed HSM’s security controls for encryption and how it provides additional safeguards and technical measures to help our customers meet compliance. Encryption is one of the key technical measures to achieve sole control of your data.
Microsoft’s Azure fortifies your data through state-of-the-art encryption technologies for both data at rest and in transit. Our encryption products erect barriers against unauthorized access to the data including two or more independent encryption layers to protect against compromises of any one layer. In addition, Azure has clearly defined, well-established responses, policies and processes, strong contractual commitments, and strict physical, operational, and infrastructure security controls to provide our customers the ultimate control of their data in the cloud. The fundamental premise of Azure’s key management strategy is to give our customers more control over their data with Zero Trust posture with advanced enclave technologies, hardware security modules and identity isolation that reduces Microsoft’s access to customer keys and data.
Encryption at Rest provides data protection for stored data at rest and required by organizations need for data governance and compliance efforts. Microsoft’s compliance portfolio is the broadest in all public clouds worldwide with Industry and government regulations such as the HIPPA, General Data Protection Regulation, Schrems II and FIPS(Federal Information Processing Standards) 140-2 and 3. These regulations lay out specific safeguards regarding data protection and encryption requirements and in most cases a mandatory measure required for compliance.
How does Encryption at Rest work?
Azure Key Vault services provide encryption and key management solutions that safeguard cryptographic keys, certificates and other secrets used by cloud applications and services to protect and control data encrypted at rest. Secure key management is essential to protect and control data in the cloud. Azure offers various solutions for managing and controlling access to encryption keys, thereby giving you a choice and flexibility to meet stringent data protection and compliance needs.
- Azure Platform Encryption is a Platform Managed encryption solution that encrypts with host level encryption. Platform managed keys are encryption keys that are generated, stored, managed entirely by Azure.
- Encryption with Customer Managed keys are keys created, read, deleted, updated and/or administered entirely by the customer. Customer Managed keys can be stored in a cloud key management service as shown below
- Azure Key Vault (AKV Standard) encrypts with a software key and is FIPS 140-2 Level 1 compliant
- Azure Key Vault (AKV Premium) encrypts with a FIPS 140-2 Level 2 hardware security module (HSM) protected keys
- Azure Key Vault Managed HSM encrypts with a single tenant FIPS 140-2 Level 3 hardware security module (HSM) protected keys and is fully managed by Microsoft and provides customers with the sole control of the cryptographic keys
For added assurance, AKV Premium and AKV Managed HSM support importing HSM-protected keys from an on-premises HSM commonly referred to as Bring your own key (BYOK)
Portfolio of Azure Key Management products
|
Azure Key Vault Standard
|
Azure Key Vault Premium
|
Azure Key Vault Managed HSM
|
Tenancy
|
Multi-Tenant
|
Multi-Tenant
|
Single-Tenant
|
Compliance
|
FIPS 140-2 level 1
|
FIPS 140-2 level 2
|
FIPS 140-2 level 3
|
High Availability
|
Automatic
|
Automatic
|
Automatic
|
Use cases
|
Encryption at Rest
|
Encryption at Rest
|
Encryption at Rest
|
Key Controls
|
Customer
|
Customer
|
Customer
|
Root of trust control
|
Microsoft
|
Microsoft
|
Customer
|
Azure Key Vault is a cloud service for securely storing and accessing secrets. A secret is anything that you want to tightly control access to, such as API keys, passwords, certificates, or cryptographic keys. Key Vault service supports two types of containers:
- Vaults
- Standard Tier – Vaults support storing secrets, certificates and software backed keys.
- Premium Tier – Vaults support storing secrets, certificates, software and HSM-backed keys.
- Managed Hardware Security Module (HSM)
- Managed HSM only support HSM-backed keys.
See Azure Key Vault Concepts and Azure Key Vault REST API overview for details.
What is Azure Key Vault Managed HSM?
Azure Key Vault Managed HSM (Hardware Security Module) is a fully managed, highly available, single-tenant, standards-compliant cloud service with a customer-controlled security domain that enables you to store cryptographic keys for your cloud applications, using FIPS 140-2 Level 3 validated HSMs
How does Azure Key Vault Managed HSM protect your keys?
Azure Key Vault Managed HSM uses a defense in depth and zero trust security posture that uses multiple layers including physical, technical, and administrative security controls to protect and defend your data.
Azure Key Vault and Azure Key Vault Managed HSM are designed, deployed and operated such that Microsoft and its agents are precluded from accessing, using or extracting any data stored in the service, including cryptographic keys.
Customer keys that are securely created and/or securely imported into the HSM devices, unless set otherwise by the customer, are not marked extractable and are never visible in plaintext to Microsoft systems, employees, or our agents.
The Key Vault team explicitly does not have operating procedures for granting such access to Microsoft and its agents, even if authorized by a customer.
We will not voluntarily attempt to defeat customer-controlled encryption features like Azure Key Vault or Azure Key Vault Managed HSM. If faced with a legal demand to do so, we would challenge such a demand on any lawful basis, consistent with our customer commitments as outlined in this blog.
Let us take a deep dive on how the security controls are implemented.
Physical Security Controls – The core of the Managed HSM offering is the hardware security module (HSM) which is a specialized, hardened, tamper resistant, high entropy dedicated cryptographic processor that is validated to FIPS 140-2 level 3 standard. All components of the HSM are further covered in hardened epoxy and a metal casing to keep your keys safe from an attacker. The HSMs are housed in racks of servers across several data centers, regions, and geographies. These geographically dispersed datacentres comply with key industry standards such as ISO/IEC 27001:2013 and NIST SP 800-53 for security and reliability.
Microsoft designs, builds, and operates datacenters in a way that strictly controls physical access to the areas where your keys and data are stored. Additional layers of physical security such as tall concrete and steel fences, dead bolted steel doors, thermal alarm systems, closed-circuit live camera monitoring, 24×7 security personnel presence, need to access basis per floor with approval, rigorous staff training, biometrics, background checks, access request and approval are mandated. In addition, the HSM devices and the related servers are caged locked with cameras filming the front and the back of the servers with tightly controlled access.
Technical Security Controls – There are several layers of technical controls around the managed HSM that further protects your key material but most importantly prevents Microsoft from accessing the key material.
- Confidentiality – The Managed HSM Service run inside a trusted execution environment built on Intel Software Guards Extension (SGX) and offers enhanced protection from internal and external attackers through hardware isolation that protects data in use. Enclaves are secured portions of the hardware’s processor and memory. You cannot view data or code inside the enclave, even with a debugger. If untrusted code tries to change content in enclave memory, SGX disables the environment and denies the operations. These unique capabilities help you protect your cryptographic key material from being accessible in the clear. In addition, Azure confidential computing offers solutions to enable the isolation of your sensitive data while it is being processed in the cloud.
- Security Domain – The security domain (SD) is an encrypted blob that contains extremely sensitive cryptographic information that contains artifacts such as the HSM backup, user credentials, the signing key, and the data encryption key unique to your managed HSM. The SD is generated in the managed HSM hardware, and the service software enclaves at the initialization time. Once the managed HSM is provisioned, you must create at least 3 RSA key pairs and send the public keys to the service when requesting the Security Domain download. Once the Security Domain is downloaded, the Managed HSM moves into an activated state and ready for consumption. Microsoft personnel have no way of recovering the security domain, nor can they access your keys without the security domain.
- Access controls and Authorization – Access to a managed HSM is controlled through two interfaces: the management plane and the data plane. The management plane is where you manage the HSM itself. Operations in this plane include creating and deleting managed HSMs and retrieving managed HSM properties. The data plane is where you work with the data stored in a managed HSM — that is HSM-backed encryption keys. You can add, delete, modify, and use keys to perform cryptographic operations, manage role assignments to control access to the keys, create a full HSM backup, restore full backup, and manage security domain from the data plane interface. To access a managed HSM in either plane, all callers must have proper authentication and authorization. Authentication establishes the identity of the caller. Authorization determines which operations the caller can execute. A caller can be any one of the security principals defined in Azure Active Directory – user, group, service principal or managed identity. Both planes use Azure Active Directory for authentication. For authorization they use different systems as follows
- The management plane uses Azure role-based access control — Azure RBAC (role-based access control) — an authorization system built on Azure Resource Manager
- The data plane uses a managed HSM-level RBAC (Managed HSM local RBAC) — an authorization system implemented and enforced at the managed HSM level. The local RBAC control model allows designated HSM administrators to have complete control over their HSM pool that even the management group, subscription, or resource group administrators cannot override.
- Encryption in Transit – All traffic to and from the Managed HSM is always encrypted with TLS (Transport Layer Security versions 1.3 and 1.2 are supported) to protect against data tampering and eavesdropping where the TLS termination happens inside the SGX enclave and not in the untrusted host
- Firewalls – Managed HSM can be configured to restrict who can reach the service in the first place, which further shrinks the attack surface. We allow you to configure Managed HSM to deny access from the public internet and only allow traffic from trusted Azure services (such as Azure Storage)
- Private Endpoints – By enabling a private endpoint, you are bringing the Managed HSM service into your virtual network allowing you to isolate that service only to trusted endpoints like your VNET and Azure Services. All traffic to and from your HSM will travel along the secure Microsoft backbone network without having to traverse the public internet.
- Monitoring and Logging – The outermost layer of protection is the monitoring and logging capabilities of Managed HSM. With Azure Monitor service, you can check your logs for analytics and alerts to ensure that access patterns conform with your expectations. This allows members of your security team to have visibility into what is happening within the Managed HSM service. If something does not look right, you can always roll your keys or revoke permissions.
- Bring Your Own Key (BYOK) – BYOK enables Azure customers to use any supported on-premises HSMs to generate keys and import them into the Managed HSM. Some customers prefer to use on-premises HSMs to generate keys to meet regulatory and compliance requirements. BYOK enables secure transfer of HSM-protected key to the Managed HSM. The key to be transferred never exists outside an HSM in plaintext form. During the import process, the key material is protected with a key held in the Managed HSM.
- External HSM – A handful of our customers have come to us where they would like to explore the option of the HSM outside of the Azure cloud to keep the data and keys segregated with an external HSM either on the 3rd party cloud or on-premises. While a 3rd party HSM outside of Azure seems to give more control over keys to customers, it introduces several concerns such as latency causing performance issues, SLA issues caused by issues with the 3rd party HSM, and maintenance and training costs. In addition, key Azure features such as soft delete and purge protection cannot be leveraged by a 3rd party HSM. We will continue to evaluate this technical option with our customers to help them navigate the complex security and compliance landscape.
Administrative Security Controls –
- EU data boundary for the Microsoft Cloud – Microsoft’s strong commitment that enables you to process and store all your data in the EU
- Microsoft’s strong commitment to challenge government requests to defend your data
- Contractual obligations around security and customer data protection as discussed in Microsoft Trust Center
- Cross region replication – Managed HSM is introducing new functionality (geo-replication) very soon that will allow you to deploy HSMs in a secondary region
- Disaster Recovery – Azure offers an end-to-end backup and disaster recovery solution that is simple, secure, scalable and cost-effective
- Microsoft Security Response Center (MSRC) – Managed HSM service administration tightly integrated with MSRC
- Security monitoring for unexpected administrative operations with full 24/7 security response
- Cloud Resilient and Secure Supply Chain – Advancing reliability through a resilient cloud supply chain
- Regulatory Compliance built-in initiative – Compliance in Azure Policy provides built-in initiative definitions to view a list of the controls and compliance domains based on responsibility (Customer, Microsoft, Shared). For Microsoft-responsible controls, we provide additional details of our audit results based on third-party attestation and our implementation details to achieve that compliance
- Audit reports – Resources to help information security and compliance professionals understand cloud features, and to verify technical compliance and control requirements
- Assume Breach philosophy – we assume that any component could be compromised at any time, and design and test appropriately, including regular Red Team/Blue Team exercises (Attack simulation in Microsoft 365 – Microsoft Service Assurance | Microsoft Docs)
In conclusion, the Azure Key Vault Managed HSM offers robust physical, technical, and administrative security controls and provides you with sole control over your key material for a scalable, centralized cloud key management solution that help satisfy growing compliance, security, and privacy needs and most importantly provides encryption safeguards required for compliance. Our customers can be assured that we are committed to ensuring their data will be protected with transparency about our practices as we progress toward the implementation of the EU Data Boundary.
For more information, reach out to your Azure account team to facilitate a discussion with the Azure Key Management product team
by Contributed | May 10, 2022 | Technology
This article is contributed. See the original author and article here.
Microsoft has released security updates (SUs) for vulnerabilities found in:
- Exchange Server 2013
- Exchange Server 2016
- Exchange Server 2019
IMPORTANT: Starting with this release of Security Updates, we are releasing updates in a self-extracting auto-elevating .exe package (in addition to the existing Windows Installer Patch format). Please see this post for more information. Original update packages can be downloaded from Microsoft Update Catalog.
These SUs are available for the following specific builds of Exchange Server:
The SUs address vulnerabilities responsibly reported to Microsoft by security partners and found through Microsoft’s internal processes. Although we are not aware of any active exploits in the wild, our recommendation is to immediately install these updates to protect your environment.
These vulnerabilities affect Exchange Server. Exchange Online customers are already protected from the vulnerabilities addressed in these SUs and do not need to take any action other than updating any Exchange servers in their environment.
More details about specific CVEs can be found in the Security Update Guide (filter on Exchange Server under Product Family).
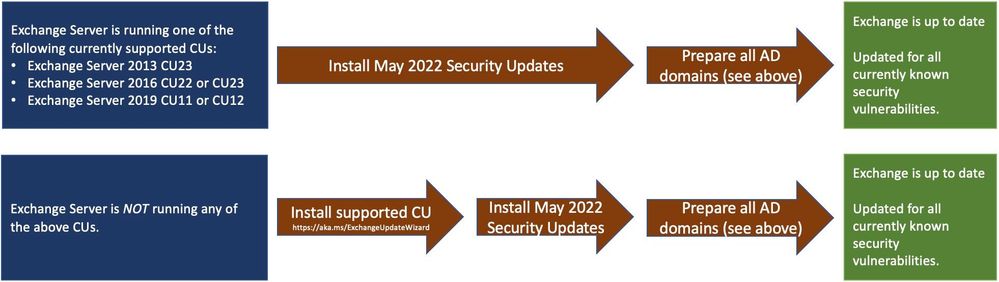
Manual run of /PrepareAllDomains is required
Because of additional security hardening work for CVE-2022-21978, the following actions should be taken in addition to application of May 2022 security updates:
Latest version of Exchange Server installed in the organization
|
Additional steps needed
|
Exchange Server 2016 CU22 or CU23, or
Exchange Server 2019 CU11 or CU12
|
Install the May 2022 SU first and then run the following Command Prompt command once using Setup.exe in your Exchange Server installation path (e.g., …Program FilesMicrosoftExchange Serverv15Bin):
“Setup.exe /IAcceptExchangeServerLicenseTerms_DiagnosticDataON /PrepareAllDomains”
Or
“Setup.exe /IAcceptExchangeServerLicenseTerms_DiagnosticDataOFF /PrepareAllDomains”
|
Exchange Server 2013 CU23
|
Install the May 2022 SU first and then run the following Command Prompt command once using Setup.exe in your Exchange Server installation path (e.g., …Program FilesMicrosoftExchange Serverv15Bin):
Setup.exe /IAcceptExchangeServerLicenseTerms /PrepareAllDomains
|
Any older version of Exchange Server not listed above
|
Update your Exchange server to the latest CU, install May 2022 SU and then follow the steps above.
|
You need to run /PrepareAllDomains only once per organization and those changes will apply to all versions of Exchange Server within the organization. When you run /PrepareAllDomains, your account needs to be a member of the Enterprise Admins security group. This might be a different account from the one you use to install the SU.
Update installation
Two update paths are available:
Inventory your Exchange Servers / determine which updates are needed
Use the Exchange Server Health Checker script (use the latest release) to inventory your servers. Running this script will tell you if any of your Exchange Servers are behind on updates (CUs and SUs).
Update to the latest Cumulative Update
Go to https://aka.ms/ExchangeUpdateWizard and choose your currently running CU and your target CU to get directions for your environment.
If you encounter errors during or after installation of Exchange Server updates
If you encounter errors during installation, see the SetupAssist script. If something does not work properly after updates, see Repair failed installations of Exchange Cumulative and Security updates.
Known issues with this release
We are not aware of any known issues with this release.
Issues resolved by this release
The following issues have been resolved in this update:
- Exchange Service Host service fails after installing March 2022 security update (KB5013118)
- New-DatabaseAvailabilityGroupNetwork and Set-DatabaseAvailabilityGroupNetwork fail with error 0xe0434352
- The UM Voicemail greetings function stops working and returns error 0xe0434352.
- Unable to send mails through EAS and Get-EmailAddressPolicy fails with Microsoft.Exchange.Diagnostics.BlockedDeserializeTypeException after installing Security Update KB5008631 for Exchange 2019
FAQs
My organization is in Hybrid mode with Exchange Online. Do I need to do anything?
While Exchange Online customers are already protected, the May 2022 SUs do need to be installed on your on-premises Exchange servers, even if they are used only for management purposes. You do not need to re-run the Hybrid Configuration Wizard (HCW) after installing updates.
Do I need to install the updates on ‘Exchange Management Tools only’ workstations?
Servers or workstations running only the Management Tools role (no Exchange services) do not need these updates. If your organization uses only an Exchange Management Tools machine, then you should install the May 2022 SU package on it and run /PrepareAllDomains as per the above instructions to update Active Directory permissions.
Instructions seem to indicate that we should /PrepareAllDomains after May 2022 SU is installed; is that correct?
Yes. The May 2022 SU package updates files in Exchange server folders when it is installed. That is why once those files are updated (SU is installed) – we ask you to go and explicitly /PrepareAllDomains using setup from v15Bin folder.
NOTE: This post might receive future updates; they will be listed here (if available).
The Exchange Server Team
by Contributed | May 9, 2022 | Technology
This article is contributed. See the original author and article here.
Descubra vulnerabilidades e automatize a atualização de dependências com GitHub Dependabot
Dando continuidade ao artigo Como manter meu código seguro usando o GitHub nesse artigo vamos ver como o Dependabot pode nos ajudar a manter nosso código mais seguro.
Dependabot
Dependabot é um recurso que além de identificar vulnerabilidades nas dependências do seu código, ele pode te ajudar criando Pull Requests com a atualização da dependência com a versão já corrigida. Ele está disponível para todos os repositórios e recentemente foi liberada uma atualização que permite a atualização das dependências privadas do seu repositório.
Para isso ele conta com o GitHub Advisory Database uma lista de vulnerabilidades de segurança conhecidas, agrupadas em duas categorias:
GitHub-reviewed advisories – As vulnerabilidades que já foram identificadas e analisadas pelo GitHub, para essas são geradas notificações sempre que uma vulnerabilidade for identificada nas dependências do seu repositório, para isso, o alerta do Dependabot deve ser ativado.
Unreviewed advisories – As vulnerabilidades que estão listadas no feed do National Vulnerability Database, o Dependabot não gera alertas para essas vulnerabilidades, pois não houve verificação sobre a validade ou integridade por parte do GitHub.
O GitHub adiciona vulnerabilidades na lista do GitHub Advisory Database a partir das seguintes fontes:
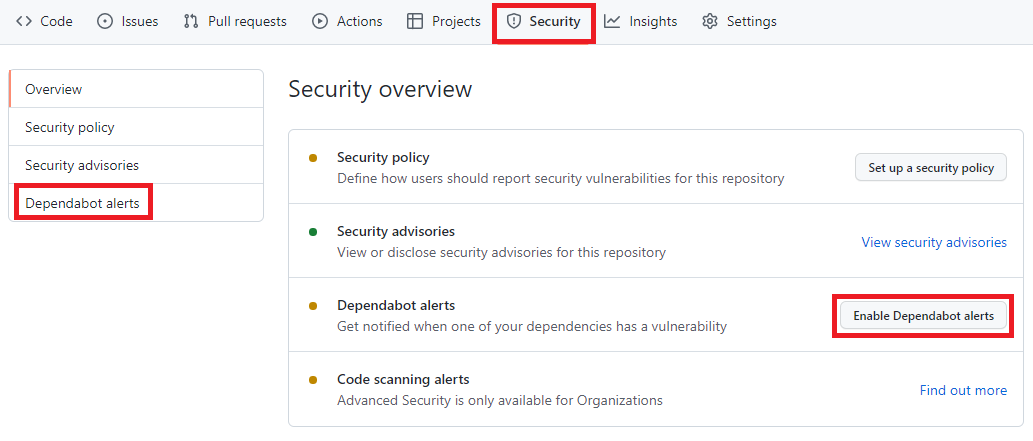
Como habilitar o Dependabot
Para habilitar, você precisa acessar o menu Security -> Dependabot alerts e habilitar a opção Enable Dependabot alerts
Painel de Segurança do portal do GitHub, nela está destacado os seguintes termos: Security, Dependabot alerts, Enable Dependabot alerts
Com isso o Dependabot já passa a monitorar seu repositório em busca de vulnerabilidades nas dependências do seu repositório.
A partir de agora o Dependabot passará a gerar aletas sempre que:
- Uma nova vulnerabilidade for adicionada no GitHub Advisory Database
- O Gráfico dependência for atualizado. Exemplo um desenvolvedor faz um push de um commit que atualiza alguma dependência que esteja na lista do GitHub Advisory Database .
O que acontece depois de habilitar o Dependabot
Acessando novamente o menu Security -> Dependabot alerts é possível visualizar se há algum alerta de vulnerabilidade. Você terá acesso a uma lista completa de todas as vulnerabilidades encontradas em seu repositório, podendo filtrar por Pacote, ecossistema ou manifesto, há a opção de ordenar por mais novo, mais antigo, gravidade, localidade do manifesto ou nome do pacote.
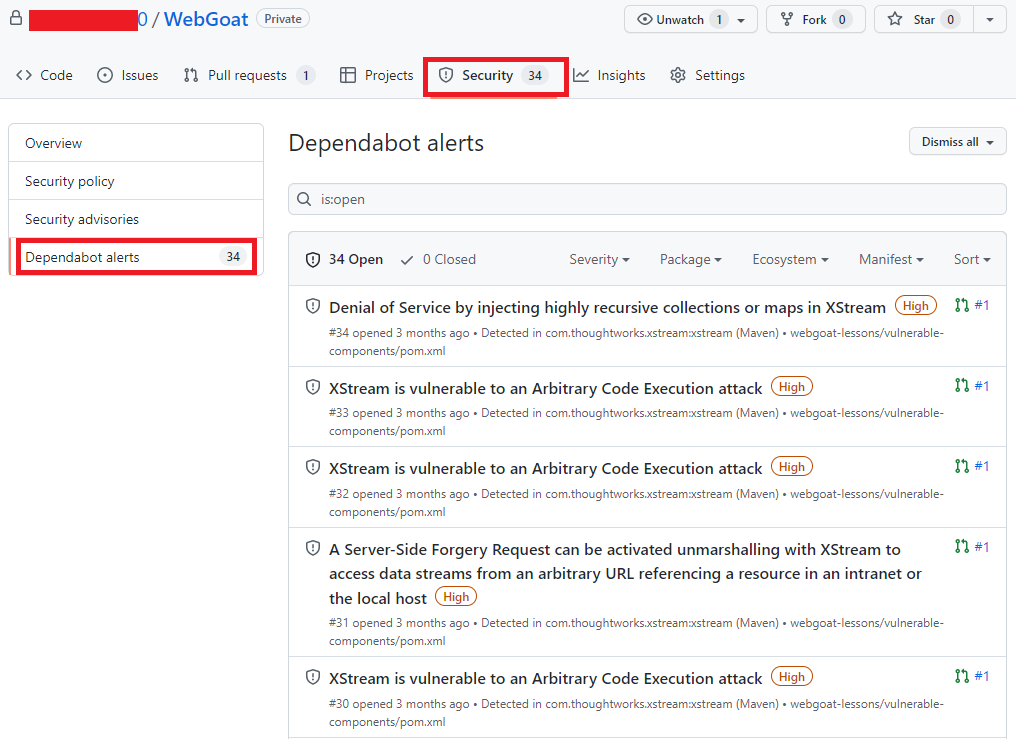 Alertas do portal do GitHub, agora com uma lista de vulnerabilidades e com os seguintes termos destacados: Security e Dependabot alerts
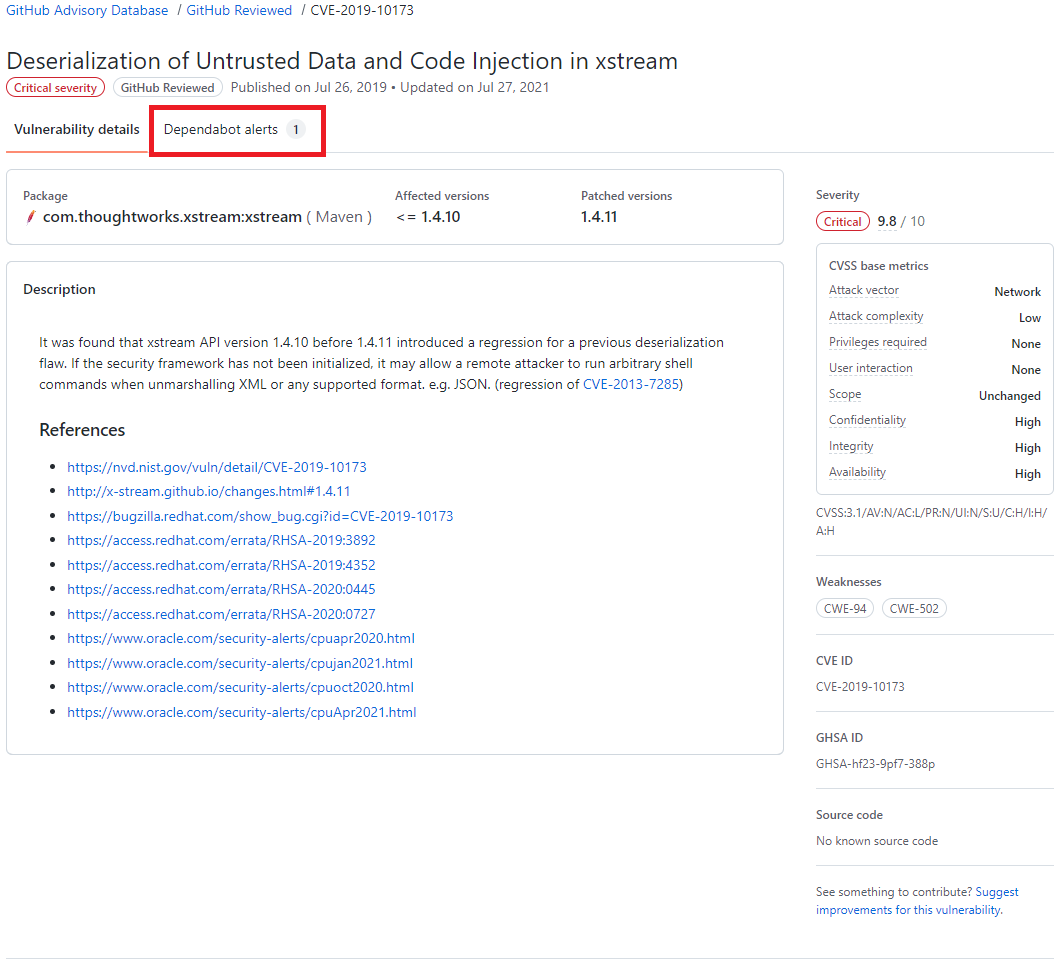
Clicando no alerta é possível obter mais informações sobre a vulnerabilidade, que pode incluir a descrição, nível de gravidade, nome do pacote afetado, ecossistema do pacote, as versões afetadas e as versões de patch, impacto e algumas informações opcionais como, por exemplo, referências, soluções alternativas e créditos. Além disso, um link para o registro CVE, onde você pode ler mais detalhes sobre a vulnerabilidade, suas pontuações CVSS e seu nível de gravidade qualitativa.
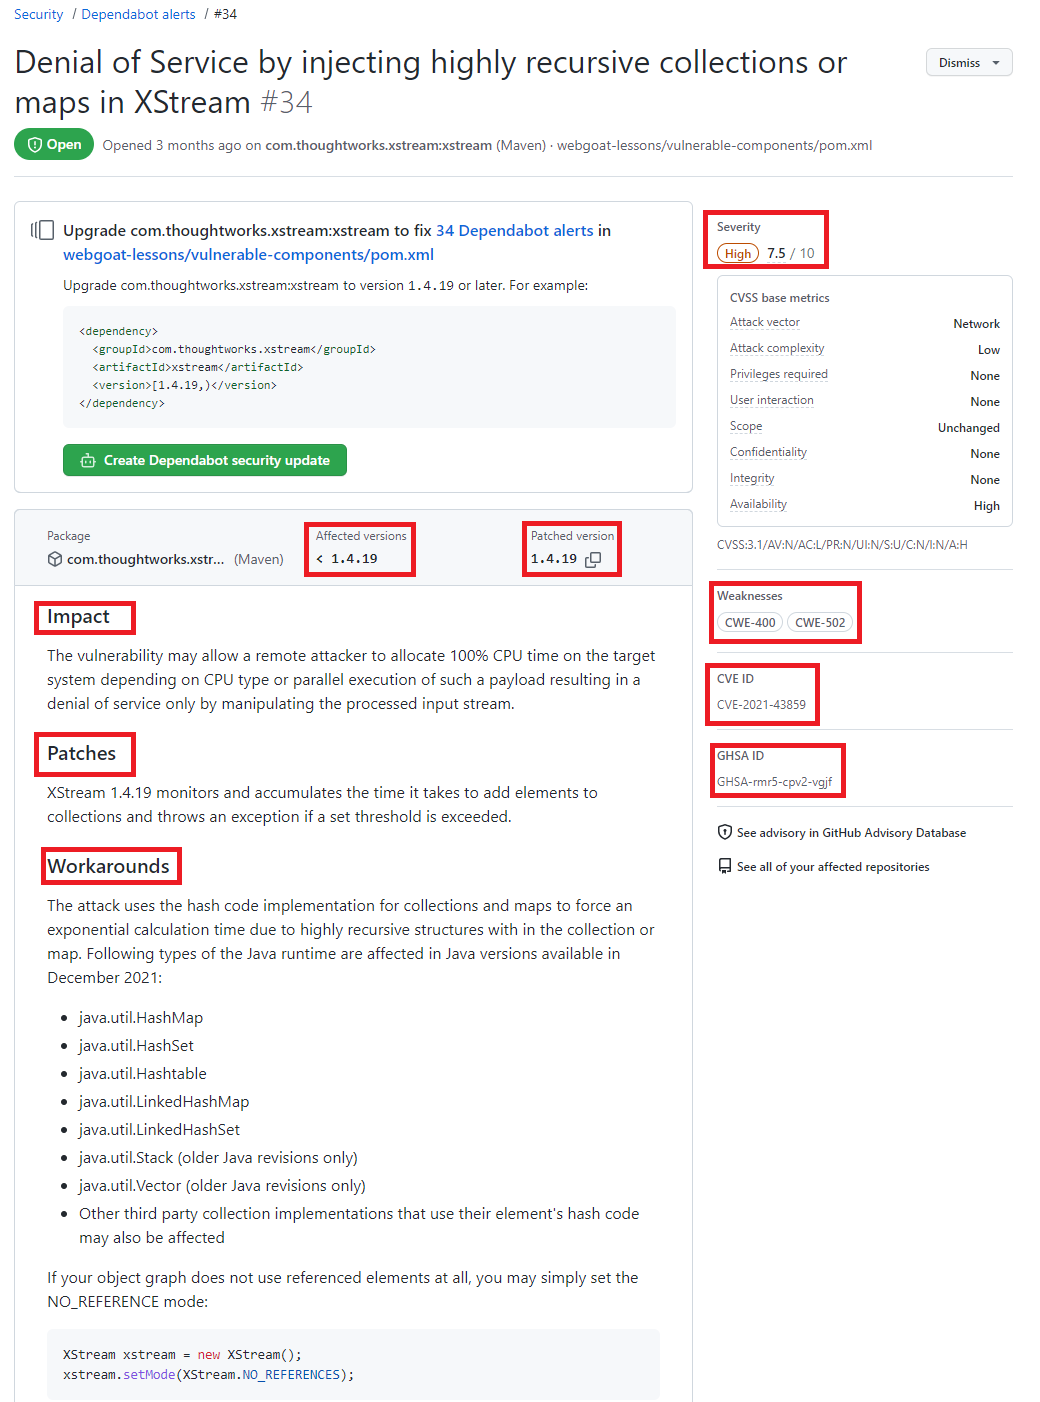 Detalhes de uma vulnerabilidade destacando as seguintes informações Severity, Affected versions, Patched version, impact, Patches, workarounds, weaknesses CVE ID e GHSA ID
O dependabot também envia notificações para os mantenedores do repositório onde a vulnerabilidade foi encontrada. Por padrão o mantenedor receberá um e-mail com um breve relato sobre a descoberta.
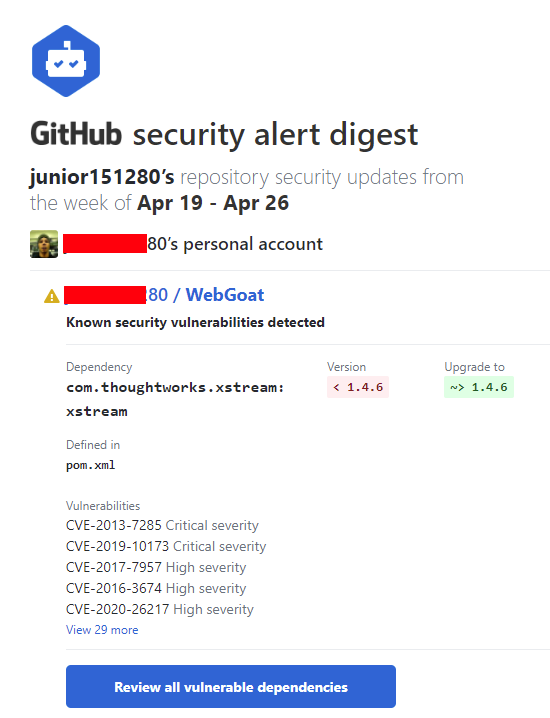 E-mail enviado pelo Dependabot
Localize repositórios com vulnerabilidades
Acessando o GitHub Advisory Database é possível identificar quais repositórios possui dependências com vulnerabilidade, para isso acesse o GitHub Advisory Database clicando nesse link.
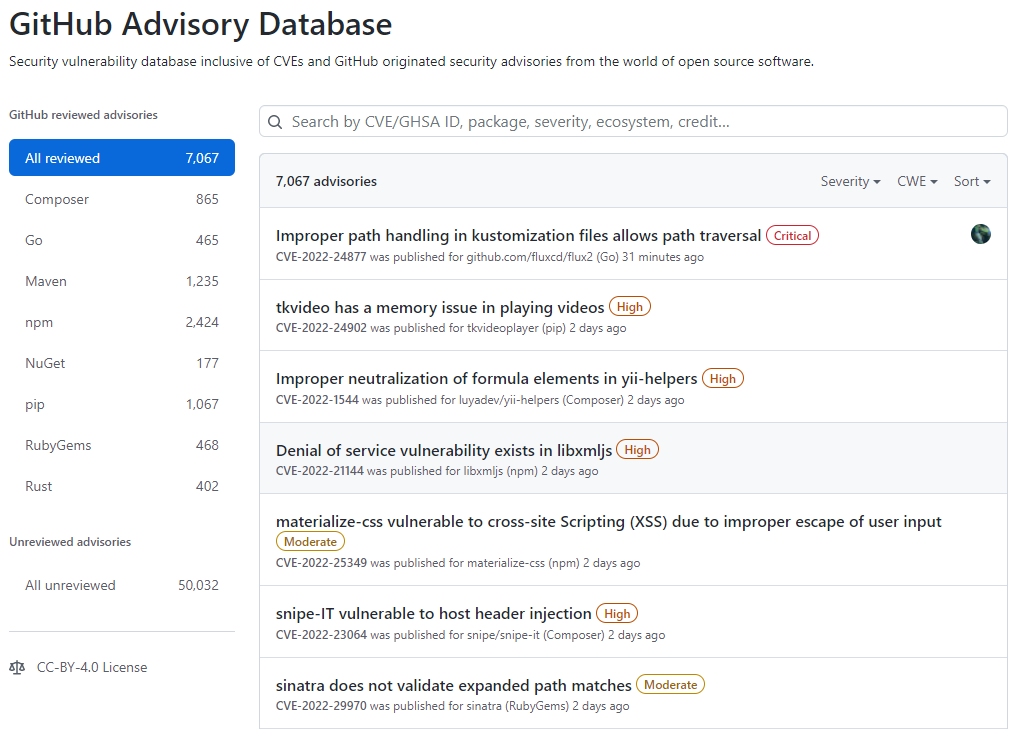 Tela inicial do GitHub Advisory Database
No GitHub Advisory Database é possível filtrar as vulnerabilidades por ecossistema, CVE/GHSA ID, nome do pacote, gravidade ou ordenar por mais novo, mais antigo, atualizado recentemente ou menos atualizado recentemente. Ao localizar a vulnerabilidade desejada é possível ver quais repositórios utiliza a dependência.
 Resultado de pesquisa do GitHub Advisory Database, destacando o termo Dependabot alert
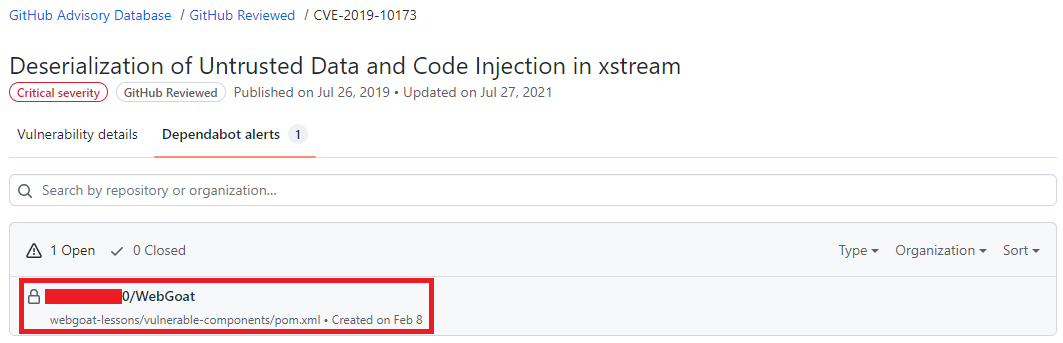 Resultado de pesquisa do GitHub Advisory Database mostrando quais repositórios há a dependência selecionada, o nome do repositório está destacado.
Atualize as dependências com ajuda do Dependabot
Após um alerta ser gerado, se já existir uma versão com a correção da vulnerabilidade o Dependabot abre um Pull Request com a ação corretiva, em alguns casos quando o as informações são suficientes uma pontuação de confiabilidade é gerada.
O Pull Request passa pelos mesmos testes que os demais Pull Requests gerados pelo time responsável pelo repositório, portanto fica na responsabilidade do mantenedor do repositório avaliar e se estiver tudo correto aprovar o Pull Request. A aprovação dos Pull Requests podem ser automatizada utilizando as Actions para saber mais sobre como automatizar o Dependabot com o GitHub Actions acesse esse link
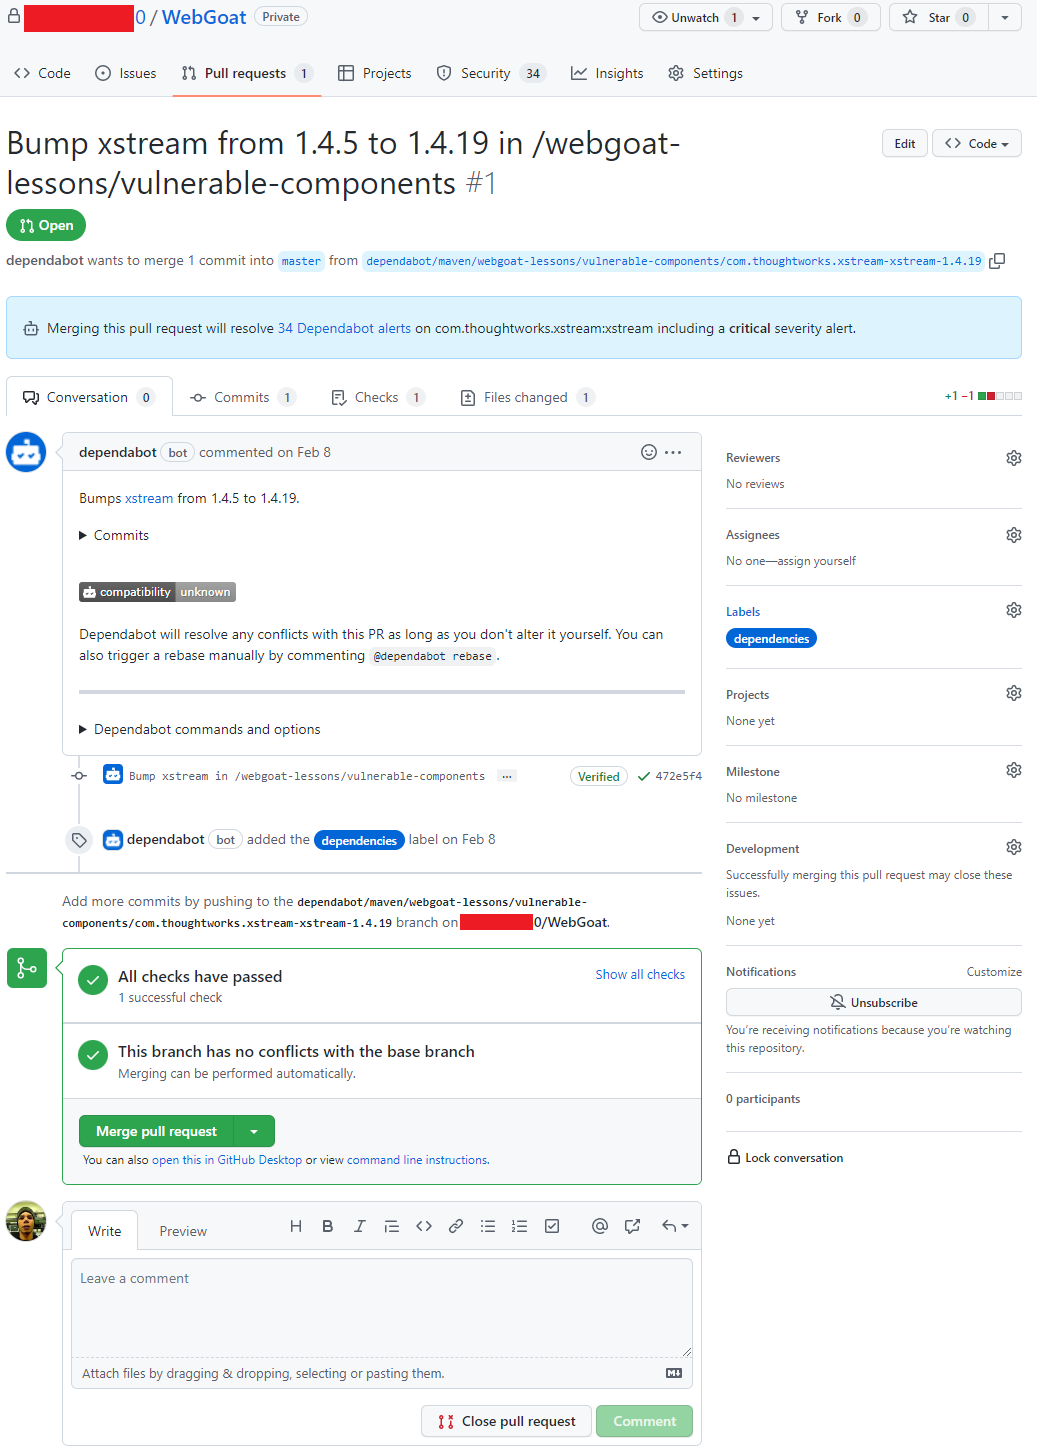 Pull request aberto pelo Dependabot
Conclusão
O Dependabot é um recurso que não podemos deixar de habilitar em nossos repositórios, é grátis, faz boa parte do trabalho sozinho e nos ajuda a manter nosso código muito mais seguro.

by Contributed | May 6, 2022 | Technology
This article is contributed. See the original author and article here.
Last November, we announced the availability of a new JavaScript API in Excel. This new API allows developers to create their own custom data types containing images, entities, arrays, and formatted number values – backed by their own custom data sources, in addition to allowing for the creation of custom functions which can make use of these new Excel Data Types, both as inputs and outputs.
We were excited for the possibilities and the unique solutions that would be created using this new API.
Today, we’re even more excited to share with you some of the work CCP Games has been doing using the API, to bring their data right to your fingertips as Excel data types.
CCP Games, a Pearl Abyss company since 2019, was founded in 1997 in Reykjavik, Iceland. With the launch of EVE Online in May 2003, CCP Games established itself as one of the most innovative companies in interactive entertainment, winning numerous awards and receiving critical acclaim worldwide.
Eve Online is a space-based, persistent world massively multiplayer online role-playing game (MMORPG), wherein players can participate in a number of in-game professions and activities, including mining, piracy, manufacturing, trading, exploration, and combat. The game is renowned for its scale and complexity with regards to player interactions – in its single, shared game world, players engage in unscripted economic competition, warfare, and political schemes with other players.
EVE Online players frequently use Excel to work with in-game data to model and calculate everything from trading profit margins to battle strategy. It has even been fondly nicknamed “Spreadsheets in Space.” Now, by utilizing the new JavaScript API in Excel, CCP Games hopes to make this in-game data even easier for players to access, work with, and quickly refresh.
Here are some examples of the kinds of new Data Types we have been thinking about making available within the Eve Online add-in:
Data Type
|
Example
|
Ships – Ships are instrumental in the Eve Online universe. They can be used to travel, ferry materials and of course battle your opponents.
|
|
Materials – Materials are the backbone of any universe and Eve Online is no different. These data types contain pricing and other information to aid in market and building decision making.
|

|
Blueprints – Blueprints and materials are like bread and butter. These two things in concert allow players to create items in the universe. Plan out your resource gathering requirements for your next move
|

|
Star Systems – Eve Online has a vast array of Star Systems to explore in the universe. These data types aid in decision making on how to manipulate these systems best to the players advantage.
|

|
Eve Online Item Search
Custom Functions are also being thought about. In this example, it’s possible to easily get at the data players are looking for. This function searches the vast array of in-game items to return results quickly and efficiently.

This is just a glimpse of the vast set of data that makes up the Eve Online universe.
The hope is that with this add-in CCP Games can
- Allow open and easy access for curious minds
- Support small and mid-size player corporations with organizing activities that don’t have access to infrastructure
- Facilitate advanced and hardcore gameplay and optimization strategies
We look forward to seeing this work evolve over the course of the project!
Learn More
You can learn more about CCP Games’ partnership with the Excel team at link coming soon, and we’re thrilled to be featured at EVE Fanfest 2022, May 6-7 in Reykjavik, Iceland.
To learn more about the data types JavaScript API in Excel, you can check out these resources:

Recent Comments