
by Contributed | Dec 7, 2022 | Business, Hybrid Work, Microsoft 365, Technology
This article is contributed. See the original author and article here.
We’re excited to announce Communities in Microsoft Teams—a new set of easy-to-use features that enable people to come together, connect, share, and collaborate.
The post Communities in Microsoft Teams: Connect, collaborate, and share appeared first on Microsoft 365 Blog.
Brought to you by Dr. Ware, Microsoft Office 365 Silver Partner, Charleston SC.
by Contributed | Dec 6, 2022 | Technology
This article is contributed. See the original author and article here.
Greetings to our lovely NTA non-profits. This article will help you uncover some pretty cool features within Microsoft Teams that can help take your meetings to the next level.
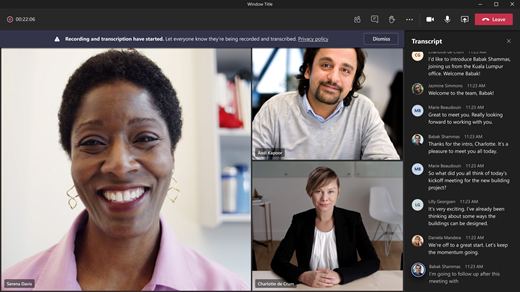
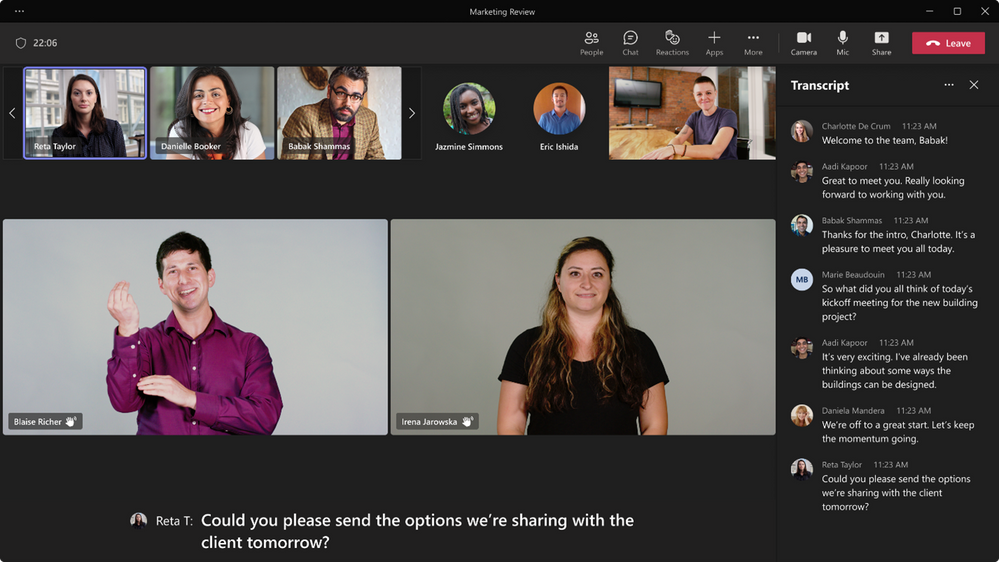
Live Transcription
This first awesome feature was created for accessibility purposes as well as making your designated note taker’s job 100% easier. The automatic transcribing feature is perfect for someone who may have missed the meeting and wants to later go back to the meeting recap in the chat to read everything that was discussed or for someone who needs to read captions in real time due to, for example, a hearing impairment or language barrier.
This visual aid appears along the right-side of the meeting screen and is labeled by the speaker’s name as well as the time spoken. Check out the link in the photo caption below to learn how to enable live transcription.
Photo Cred and more info: View live transcription in a Teams meeting – Microsoft Support
Speaker Coach
As someone who experiences presenter’s anxiety, this next feature is something I personally find very helpful. Speaker Coach provides live feedback on your presentation that is only visible to you. You will be able to gain insight on things such as the pace you are speaking, potentially insensitive wording and phrases, too many filler words, or if you are simply reading only the text from your presentation slide.
At the end of your meeting, Speaker Coach will generate a report to conclude all of these insights and present suggestions that can help improve future presentations. Check out the link in the photo caption below to learn how to enable Speaker Coach.

Photo Cred and more info: Preview: Speaker Coach in a Teams meeting – Microsoft Support
Together Mode
Last but not least of our highlights is a fun feature called Together Mode. Together mode allows you and your organization to virtually appear as if you are together in one room instead of individual call cells. This feature will encourage members of your organization to turn on their cameras in order to engage with one another and have a more interactive discussion. Together mode is best suited for verbal meetings that don’t require visuals, presentations or screen sharing. To access Together Mode, start a meeting and select View in the top menu bar. Select together mode from the menu.

Photo Cred and more info : Custom Together Mode Scenes – Teams | Microsoft Learn
These are just 3 of the cool features in Microsoft Teams that you can use to maximize your organization’s meeting experience. Be sure to look for more in future articles, Non-profits, and thank you for allowing us to serve you and in turn help better serve our communities!
by Contributed | Dec 5, 2022 | Technology
This article is contributed. See the original author and article here.
Scientific computing has long relied on HPC systems to accelerate scientific discovery. What constitutes an HPC system has continued to evolve. Access to computing keeps getting democratized and HPC is no longer limited to multi-billion dollar government laboratories and industries who can afford the infrastructure. Anyone with access to the Internet can now easily leverage the ubiquitous cloud for their computing task du jour! Azure natively supports HPC by providing hardware suitable for high performance computing needs together with software infrastructure to make it easy to harness these resources. In this post, we focus on one such Azure infrastructure component, Azure Batch, and see how we can be used to support a common use-case: data browser with interactive 3D visualization support.
Use-Case: the problem statement
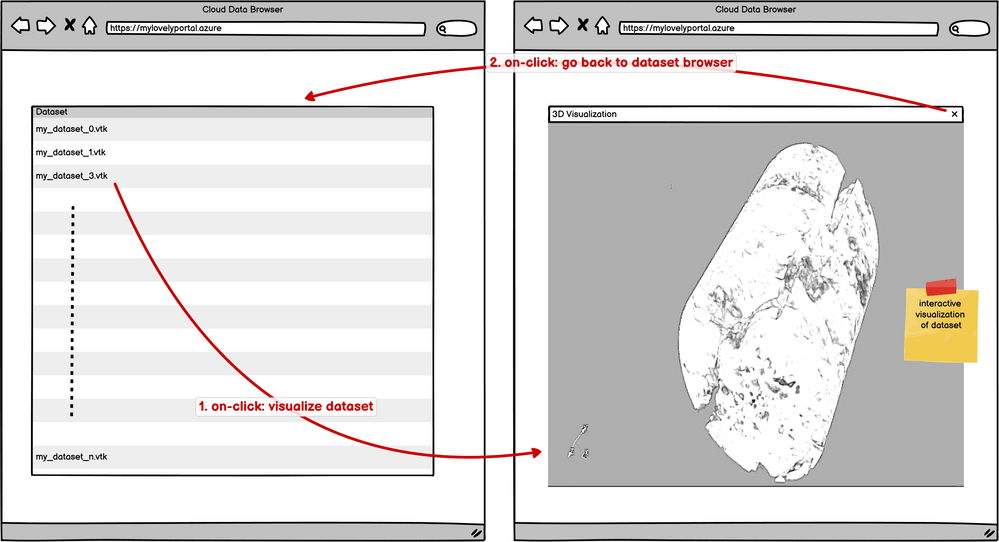
Recently, a customer came to us with an interesting use-case. They wanted to provide their users with an interactive data browser. The datasets are HPC simulation and analysis results which can easily be several gigabytes in size. They wanted to present their users with a web app where users can browse the datasets and then select any of the datasets to interactively visualize it with some canned visualizations.
Variations of this use-case are a very common request in the scientific computing world so let’s generalize (and perhaps simplify) the problem. We want to develop the following web application:
Design Considerations
A few things to qualify the problem and help guide our design choices.
- We want to a scalable solution. Of course, we can set all of this up on a workstation and expose that to the world wide web, however not only is that scary (for security reasons) but also not scalable. We want this to scale no matter how many users are accessing the portal at the same time.
- The datasets are large and require processing before they can be visualized. Hence, we want a remote rendering capable system where the rendering can happen on remote computing resources, rather than the browser itself.
These requirements help us make the following design choices:
- Azure Batch provides us with the ability to allocate (and free up) compute resources as and when needed. We can setup the web app to submit jobs on Azure Batch for visualizing datasets and then Batch can allocate those jobs to nodes in a node pool that can be setup to auto-scale using fancy rules, as needed. This frees us from having to do any management of the nodes in the pool such as setting them up, ensuring they have access to appropriate storage to read the datasets, etc. Batch takes care of that in addition to providing us with tools for monitoring, debugging and diagnosing issues.
- For visualization and data processing, we use ParaView. Together with trame, ParaView makes it easy for us to develop a remote-rendering capable custom web applications that offer all the sophistication and flexibility available in the desktop app. Thus we can easily develop complex data analysis pipelines to satisfy the specific user requirements. trame enables use to access the visualization viewport through a web browser using web sockets.
Deploying the resources
One of the first steps when dealing with cloud computing is deploying the resources necessary on the Cloud. Infrastructure as Code (IaC) refers to the ability of deploying the resources needed and configuring them programmatically. As we go about building our HPC environment in the Azure Cloud, there are many ways to do it. We can use the Azure Portal to setup the system interactively. We can use Azure CLI to script the setup. We can also use domain-specific languages like Terraform or Bicep to define and deploy the infrastructure. For this post, we use Bicep which is a language for declaratively defining the Azure resources. For deploying the Bicep specifications and for other operations like populating datasets, we use Azure CLI.
All the resources needed for this demo can be deployed using the bicep code available in this Github repository. The readme goes over the prerequisites and the detailed steps to deploy all necessary resources. The project includes several different applications. The demo we cover this post is referred to as trame. Ensure you pass enableTrame=true to the `az deployment sub create ….` command to deploy the web application.
Demo in action
Once the deployment is successful, follow the steps described here to upload datasets to the storage account deployed. Finally, you should be able to browse to the URL specific to your deployed web app and start visualizing your datasets! Here’s a short video of the demo in action:
 Demo: Cloud Dataset VIewer in action
Architecture
Let’s dive into the details on how this is put together. Of course, there’s no one way to do this. Discussing the details of the resources and their configuration should help anyone trying to adapt a similar solution for their specific requirements.
Here’s a schematic of the main Azure resources deployed in this demo.

App Service: This the Azure resource that hosts our main web application. As described in the initial sections, we want our web app to let the user browse datasets and then visualize them. Thus, the web application has two major roles: list datasets, and start/stop visualization jobs. For first role, the web app needs to talk with the storage account on which all the datasets are stored to get the list of available datasets. For the second, the web app needs to communicate with the Batch service to submit jobs/stop jobs etc. In this demo, we decided to write this web app using node.js. The source code is available here. The app uses Azure JavaScript SDK to communicate with the storage account and batch service. The web app also has another role that is a little less obvious: it acts as communication proxy to communicate with the visualization web servers running on the compute nodes in the batch pool. This will become clear when we discuss the Batch resource.
Batch: This is the Azure Batch resource that orchestrates the compute node pools, job submission, etc. Batch takes care of managing all the compute nodes that are available for handling all the visualization requests. When the user “clicks” on a dataset, the web app uses Azure Batch JavaScript API to communicate with the Batch service and request it to start a job to visualize the corresponding dataset. Batch takes care on mounting the storage account on all compute nodes in the pool when they are initialized thus any process running on the compute nodes can access the datasets. The visualization job, in our case, is a simple Python application that uses ParaView/trame APIs to visualize the data. The application, named vizer, is available in this Github repository. When launched with a dataset filename passed on the command line, vizer starts up a Python web-server that one can connect to access the visualization. vizer is running on one of the compute nodes in the pool. The compute nodes in the pool are not accessible from the outside network. Thus, there’s no direct way for the user to connect to this internal visualization web-server. This is why we need the web app deployed in our outward facing app service to also act as a proxy. When a visualization web-server is ready, the main web app creates a iframe that proxies to this internal visualization web-server thus making the visualization accessible by the user. Since trame uses websockets, we need to ensure that this proxy supports websocket proxying as well. Luckily, node.js makes this very easy for us. Look at the web app source code for details on ho this can be done. For simplicity, the demo doesn’t add any additional authorization for the proxying. For production, one should consider adding authorization logic to avoid any random user from accessing any other users visualization results.
Container Registry: Azure Container Registry is used to store container images. In this demo, we containerize both the main web app and the visualization application, vizer. It’s not necessary to use containers, of course. Both App Service and Batch can work without containers, if needed. Containers just make it easier to setup the runtime environments for our demo.
Key Vault: Key Vault is generally used to store secrets and other private information. In this demo, we need the Key Vault for the Batch resource. Batch uses the Key Vault to store certificates etc. that is needs for setting up the compute nodes in the pools.
Wrapping up
As we can see, it’s fairly straight forward to get a interactive visualization portal setup using Azure and ParaView. For this demo, we tried to keep things simple and yet follow best practices when it comes to public access to resources in the cloud. Of course, for a production deployment one would want to add authentication to the web app, along with autoscaling for batch pool and add smarts for resource cleanup and fault tolerance to the web application, etc. One thing we have not covered in this post is how to use Azure’s HPC SKUs and ParaView’s distributed rendering capabilities and GPUs for processing massive datasets. We will explore that and more in subsequent posts.
by Contributed | Dec 5, 2022 | Business, Hybrid Work, Microsoft 365, Technology, Viva Insights, Viva Learning, Work Trend Index
This article is contributed. See the original author and article here.
A new Total Economic Impact™ Of Microsoft Viva study by Forrester Consulting, commissioned by Microsoft, details five ways Microsoft Viva can help organizations save time and money while improving business outcomes.
The post 5 ways Microsoft Viva helps businesses save time and money appeared first on Microsoft 365 Blog.
Brought to you by Dr. Ware, Microsoft Office 365 Silver Partner, Charleston SC.
by Contributed | Dec 2, 2022 | Technology
This article is contributed. See the original author and article here.
Happy Friday, and welcome back to your MTC Weekly Roundup!
We’ve recovered from the food coma of last week’s holiday and we’re back in the swing of things, so let’s see what’s happening in the Community this week!
MTC Moments of the Week
This week’s MTC Member of the Week spotlight is on @SnowMan55. Like our previous MoW, Glenn is another fresh face in the MTC but has already become a Frequent Contributor in the Excel forum with over a dozen best responses under their belt. We truly appreciate all your help!
Over on the blogs this week, @ShirleyseHaley wrote up a 2-minute recap of everything new with Microsoft Security, Compliance, and Identity, including Microsoft Security Virtual Training Days, which are free and in-depth virtual training events to help professionals of all levels grow their technical skills and gain confidence to navigate what’s ahead.
We are on a short break from Community events but mark your calendars for our next Ask Microsoft Anything (AMA) on Tuesday, December 13 at 09:00 am PST, when we’ll have experts from the Microsoft Teams team on hand to answer questions about the new Sign Language View in Microsoft Teams Meetings!
Unanswered Questions – Can you help them out?
Every week, users come to the MTC seeking guidance or technical support for their Microsoft solutions, and we want to help highlight a few of these each week in the hopes of getting these questions answered by our amazing community!
In the Teams forum, @adi_km is facing an issue within the Teams application (not the web version) whereusers are getting messages stuck in the sending state that never get delivered.
Meanwhile, in the SharePoint forum, @MattS1978 is looking for help using a VLOOKUP command between an Excel spreadsheet with an existing VLOOKUP and a Microsoft List for their retail stores.
————————-
For this week’s fun fact: on this day in 1983, the iconic music video epic for Michael Jackson’s “Thriller” premiered on MTV with a run time of almost 14 minutes – a game changer!
And with that, I hope you all have a wonderful weekend!

Recent Comments