Web application routing, Open service mesh and AKS
This article is contributed. See the original author and article here.
AKS Web Application Routing with Open Service Mesh
AKS product team announced a public preview of Web Application Routing this year. One of the benefits of using this add-on is the simplicity of adding entry point for applications to your cluster with a managed ingress controller. This add-on works nicely with Open service mesh. In this blog, we investigate how this works, how to setup mTLS from ingress controller to OSM and the integration. While we are using AKS managed add-on, we are taking the open-source OSM approach for explaining this, but it’s important to remember that AKS also has an add-on for OSM.
Reference link above focuses on step-by-step process to implement Web application routing along with few other add-ons such as OSM and Azure Keyvault secrets provider. The intention of this blog is not to repeat same instructions but an attempt to dig into few important aspects of OSM to illustrate connectivity from this managed ingress add-on to OSM. Enterprises prefer to leverage managed services and add-ons but at the same time there is a vested interest in understanding foundational building blocks of open-source technologies used and how they are glued together to implement certain functionalities. This blog attempts to provide some insight into how these two (OSM and web app routing) are working together but not drill too much into OSM as its documented well in openservicemesh.io
First step is creating a new cluster:
az aks create -g webapprg -n webappaks -l centralus –enable-addons web_application_routing –generate-ssh-keys
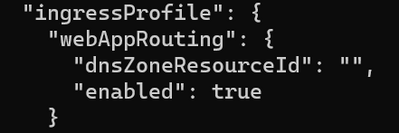
This creates a cluster along with ingress controller installed. You can check this in ingressProfile of the cluster.

Ingress controller is deployed in a namespace called app-routing-system. Image is pulled from mcr registry (and not other public registries). Since this creates ingress controller, it creates public IP attached to Azure Load Balancer and used for Ingress controller. You might want to change ‘Inbound security rules’ in NSG for agentpool to your own IP address (from default Internet) to protect.
This managed add-on creates an ‘Ingress controller’ with ingress class ‘webapprouting.kubernetes.azure.com’. So, any ingress definition should use this Ingress class.


You can see that Nginx deployment is running with HPA config. Please understand that this is a reverse proxy, sits in data path, uses resources such as CPU+memory and lots of network I/O so it makes perfect sense to set HPA. In other words, this is the place where all traffic enters the cluster and traverses through to application pods. Some refer to this as north-south traffic into the cluster. It’s important to emphasize that there were several instances in my experience where customers use OSS nginx and didn’t set right config for this deployment, ran into unpredictable failures while moving into production. Obviously, this wouldn’t show up in functional testing! So, use this managed add-on where AKS manages it for you and maintains it with more appropriate config. You don’t need to and shouldn’t change anything in app-routing-system namespace. As stated above, we are taking under the hood approach to understand the implementation and not to change anything here.

In this diagram, app container is a small circle and sidecar (envoy) is a larger circle. Using larger circle for sidecar for more space to show relevant text, so there is no significance with the sizing of the circle/eclipse! Top left side of the diagram is a copy of a diagram from openservicemesh.io site to explain the relationship between different components in OSM. One thing to note here is that there is a single service certificate for all K8S pods belonging to a particular service where there is a proxy certificate for each pod. You will understand this much better later in this blog.
At this time, we have deployed a cluster with managed ingress controller (indicated by A in diagram). It’s time to deploy service mesh. Again, I’m reiterating that we are taking open source OSM installation approach to walk you through this illustration, but OSM is also an another supported AKS add-on.
Let’s hydrate this cluster with OSM. OSM installation requires osm CLI binaries installed in your laptop (Windows or Linux or Mac). Link below.
Assuming that your context is still pointing to this newly deployed cluster, run this following command.
osm install –mesh-name osm –osm-namespace osm-system –set=osm.enablePermissiveTrafficPolicy=true

This completes installation of OSM (ref: B in diagram) with permissive traffic policy which means there are no traffic restrictions between services in the cluster.
Here is a snapshot of namespaces.

List of objects in osm-system namespace. It’s important to ensure that all deployed services are operational. In some cases, if a cluster is deployed with nodes with limited cpu/mem, this could cause issues to deployment. Otherwise, there shouldn’t be any other issues.

At this time, we’ve successfully deployed ingress controller (ref: A) and service mesh (ref: B).
However, there are no namespaces in the service mesh. In the diagram above, assume dotted-red rectangle without anything in that box.
Let’s create new namespaces in the cluster and add them to OSM.

One thing to notice from osm namespace list output is that the status of sidecar-injection. Sidecar-injection uses Kubernetes mutating admission webhook to inject ‘envoy’ sidecar into the pod definition before it is written to etcd. It also injects another init container into the pod definition which we will review later.
Also create sample2 and add this to OSM. Commands below.
k create ns sample2
osm namespace add sample2
Deploy sample1 (deploy-sample1.yaml) application with 3 replicas. This uses ‘default’ service account and creates a service with Cluster IP. This is a simple hello world deployment as found in Azure documentation. If you want to test, you can clone code from git@github.com:srinman/webapproutingwithosm.git

Let’s inspect service account for Nginx (our Web app routing add-on in app-routing-system namespace).
As you can see, in app-routing-namspace, nginx is using nginx service account and, in sample1 namespace, there is only one service account which is ‘default’ service account.

k get deploy -n app-routing-system -o yaml | grep -i serviceaccountname
This confirms that Nginx is indeed using nginx service account and not default one in app-routing-system.
Let’s also inspect secrets in osm-system and app-routing-system namespaces. Note that there is no K8S TLS secret for talking to OSM.

At this point, you have an ingress controller installed, OSM installed, sample1 and sample2 added to OSM, app deployed in sample1 namespace but there is no configuration defined yet for routing traffic from ingress controller to application. In the diagram, you can imagine that there is no connection #2 from ingress to workload in mesh.
User configuration in Ingress
We need to configure app-routing-system, our managed add-on, to listen for inbound traffic as known as north-south traffic and where to proxy connection to. This is done with ‘Ingress’ object in Kubernetes. Please notice some special annotations in Ingress definition. These annotations are needed for proxying connection to an application that is part of OSM.
k apply -f ingress-sample1.yaml

Once this is defined, you can view nginx.conf updated with this ingress definition.
k exec nginx-6c6486b7b9-kg9j4 -n app-routing-system -it – sh
cat nginx.conf

We’ve verified the configuration for ‘Web app routing’ to listen and proxy traffic to aks-helloworld-svc service in namespace sample1. In diagram, #A configuration is complete for our traffic to sample1 namespace. If the configuration is a simple Ingress definition without any special annotations and if the target workload is not added to OSM namespace, we should be able to route north-south traffic into our workload by this time but that’s not the case with our definition. We need to configure OSM to accept connections from our managed Ingress controller.
User configuration in OSM
Let’s review OSM mesh configuration. You can notice that spec.certificate doesn’t have ingressGateway section.

kubectl edit meshconfig osm-mesh-config -n osm-system
add ingressGateway section as defined below

certificate:
ingressGateway:
secret:
name: nginx-client-cert-for-talking-to-osm
namespace: osm-system
subjectAltNames:
– nginx.app-routing-system.cluster.local
validityDuration: 24h
certKeyBitSize: 2048
serviceCertValidityDuration: 24h
Now, you can notice a new secret in osm-system. OSM issues and injects this certificate in osm-system namespace. Nginx is ready to use this certificate to initiate connection to OSM. Before we go further into this blog, let’s understand a few important concepts in OSM.
Open service mesh data plane uses ‘Envoy’ proxy (https://www.envoyproxy.io/). This envoy proxy is programmed (in other words configured) by OSM control plane. After adding sample1 and sample2 namespace and deploying sample1, you could have noticed two containers running in that pod. One is our hello world app, other one is injected by OSM control plane with mutating webhook. It also injects init container which changes ip tables to redirect traffic.
Now that Envoy is injected, it needs to be equipped with certificates for communicating with its mothership (OSM control plane) and for communicating with other meshed pods. In order to address this, OSM injects two certificates. One is called ‘proxy certificate’ for ‘Envoy’ to initiate connection to OSM control plane (refer B in diagram) and another one is called ‘service certificate’ for pod-to-pod traffic (for meshed pods – in other words pods in namespaces that are added to OSM). Service certificate uses the following for CN.
<ServiceAccount>.<Namespace>.<trustdomain>
This service certificate is shared for pods that are part of same service. Hence, the name service certificate. This certificate is used by ‘Envoy’ when initiating pod-to-pod traffic with mTLS.

As an astute reader, you might have noticed some specifics in our Ingress annotations. It defines who the target is in proxy_ssl_name. Here our target service is default.sample1.cluster.local.
default is ‘default service account’, sample1 is namespace. Remember, in OSM, it’s all based on identities.
Get pod name, replace -change-here with pod name and run this following command to check this.
osm proxy get config_dump aks-helloworld-change-here -n sample1 | jq -r ‘.configs[] | select(.”@type”==”type.googleapis.com/envoy.admin.v3.SecretsConfigDump”) | .dynamic_active_secrets[] | select(.name == “service-cert:sample1/default”).secret.tls_certificate.certificate_chain.inline_bytes’ | base64 -d | openssl x509 -noout -text
You can see CN = default.sample1.cluster.local in the cert.
We are also informing nginx to use secret from osm-system namespace called nginx-client-cert-for-talking-to-osm. Nginx is configured to proxy connect to default.sample1.cluster.local with TLS secret nginx-client-cert-for-talking-to-osm. If you inspect this TLS secret (use instructions below if needed), you can see “CN = nginx.app-routing-system.cluster.local”
Extract cert info: use k get secret, use tls.crt data and base64 decode it, run openssl x509 -in file_that_contains_base64_decoded_tls.crt_data -noout -text
At this time, we have wired up everything from client to Ingress controller listening for connections, and Nginx is set to talk to OSM.
However, Envoy proxy (OSM data plane) is still not configured to accept TLS connection from Nginx.
Any curl to mysite.srinman.com will result in error response.
HTTP/1.1 502 Bad Gateway
Please understand that we can route traffic all the way from client to ‘Envoy’ running alongside our application container but since traffic is forced to enter ‘Envoy’ with our init container setup, Envoy checks and blocks this traffic. With our configuration osm.enablePermissiveTrafficPolicy=true, Envoy is programmed by OSM to allow traffic within namespaces in the mesh but not from outside traffic to enter. In other words, all east-west traffic is allowed within the mesh and these communications automatically establish mTLS between services. Let’s configure OSM to accept this traffic.
This configuration is addressed by IngressBackend. The following definition tells OSM to configure Envoy proxies used for backend service ‘aks-helloworld-svc’ to accept TLS connection from sources: defined.
More information about ingressbackend.
There are instructions in the link above for adding nginx namespace to osm. More specifically, the following command is not necessary since we’ve already configured Nginx with Ingress definition to use proxy ssl name and proxy ssl tls cert for connecting to application pod’s Envoy or OSM (#2 in the diagram. Picture shows connection from only one pod from Nginx but you can assume that this could be from any Nginx pod). OSM doesn’t need to monitor this namespace for our walk through. However, at the end of this blog, there is an additional information on how OSM is configured and how IngressBackend should be defined with managed OSM and Web app routing add-on.
osm namespace add “$nginx_ingress_namespace” –mesh-name “$osm_mesh_name” –disable-sidecar-injection

Earlier, we verified that Nginx uses with TLS cert with “CN = nginx.app-routing-system.cluster.local”. IngressBackend configures that source must be ‘AuthenticatedPrincipal’ with name nginx.app-routing-system.cluster.local. All others are rejected.
Once this is defined, you should be able to see a successful connection to app! Basically, client connection is terminated at Ingress controller (nginx) and proxied/resent (#2 in the diagram) from nginx to application pods in namespace (sample1). Envoy proxy is intercepting this connection and sending it to the actual application which is still listening on plain port 80 but our web application routing along with open service mesh took care of accomplishing encryption-in-transit between ingress controller and application pod – essentially mitigating the need for application teams to manage and own this very critical security functionality. It’s important to remember that we were able to accomplish this mTLS with very few steps with all managed by AKS (well, provided you use add-ons for OSM and Web application routing). Once the traffic lands in service meshed data plane, Open service mesh provides lots of flexibility and configuration options to manage this traffic (east-west) within the cluster across OSM-ed namespaces.

Let’s try to break this again to understand more!
In our IngressBackend, let’s make a small change to the name of authenticated principal. Change it to something other than nginx. Sample below.
– kind: AuthenticatedPrincipal
name: nginxdummy.app-routing-system.cluster.local
Apply this configuration. Attempt to connect to our service.
* Trying 20.241.185.56:80…
* TCP_NODELAY set
* Connected to 20.241.185.56 (20.241.185.56) port 80 (#0)
> GET / HTTP/1.1
> Host: mysite.srinman.com
> User-Agent: curl/7.68.0
> Accept: */*
>
* Mark bundle as not supporting multiuse
< HTTP/1.1 403 Forbidden
< Date: Fri, 25 Nov 2022 13:09:16 GMT
< Content-Type: text/plain
< Content-Length: 19
< Connection: keep-alive
<
* Connection #0 to host 20.241.185.56 left intact
RBAC: access denied
This means that we’ve defined OSM to accept connections from identity nginxdummy from app-routing-system namespace but that’s not the case in our example. Envoy basically stops connection in the same application pod before it reaches the application container itself.
Let’s try to make it work by not reverting the change but by changing a different config in IngressBackend
skipClientCertValidation: true
It should work fine now since we are configuring OSM to ignore client certification validation/verification. From a security viewpoint, if you think about this, you could send traffic from a different app or ingress controller to this application pod – basically unprotected. Let’s change this back to false and also fix nginx service name. Apply the config and check if you can access the service.
Thus far, we’ve deployed an application in one namespace and configured ingress controller to send traffic into our mesh. What would the process for another app in a different namespace using our managed ingress controller?
Let’s create another workload and understand how to define ingress and to understand the importance of service account. Sample code in deploy-sample2.yaml
In this deployment, you can see that we are using serviceAccountName: sample2-sa not the default service account. (Namespace, Service account creation is not shown and its implicit that you understand!)

You can see how ingress definition is slightly different from the one above (for sample1). proxy_ssl_name is set to sample2-sa in sample2 namespace. However, it uses the same TLS secret that sample1 used, which is TLS with “CN = nginx.app-routing-system.cluster.local”

Ingressbackend definition looks like this below. You can see that it’s the same ‘sources’ definition with different backends.

We have established TLS between Nginx and application pod (#2 in diagram). However, from client to ingress is still plan HTTP (#1 in diagram). Enabling TLS for this is straightforward and there are few ways to do this including Azure managed way, but we will explore build our own approach. Let’s create a certificate with CN=mysite.srinman.com.
openssl req -new -x509 -nodes -out aks-ingress-tls.crt -keyout aks-ingress-tls.key -subj “/CN=mysite.srinman.com” -addext “subjectAltName=DNS:mysite.srinman.com”
Use this command below to upload this cert to K8S secret in sample1 namespace.
k create secret tls mysite-tls –key aks-ingress-tls.key –cert aks-ingress-tls.crt -n sample1
sample code in ingress-sample1-withtls.yaml

This should enforce all calls to https from the client.

Traffic flow

Traffic enters ingress managed LB
TLS traffic terminated at Ingress controller pods
Ingress controller pods initiates proxy connection to backend service (specifically one of the pod that is part of that service, and even more specifically to pod’s envoy proxy container. Also remember injected init-container takes care of setting up ip tables to route requests to Envoy)
App pod – Envoy container terminates TLS traffic and initiates connection to localhost on app port (remember app container shares same pod, thus same network namespace)
App pod – app container listening on port, responds to the request.
As traffic enters the cluster, as seen above and in the diagram, it can be inspected in 3 different logs at least. Nginx, Envoy and App itself.
Check traffic in nginx logs
Check traffic in envoy logs
Check traffic in app logs
Nginx log (you might want to check both the pods if you are not able to locate the call in one. There should be two)
nn.nn.nnn.nnn – – [20/Nov/2022:17:29:11 +0000] “GET / HTTP/2.0” 502 150 “-” “curl/7.68.0” 33 0.006 [sample1-aks-helloworld-svc-80] [] 10.244.1.13:80, 10.244.1.13:80, 10.244.1.13:80 0, 0, 0 0.000, 0.000, 0.004 502, 502, 502 3f9a310a3ebb314342b590dde11
Envoy log
Just to keep it simple, reduce replicas to 1 – to probe envoy side car. Replace podname with your pod in the command below.
k logs aks-helloworld-65ddbc869b-t8hwq -c envoy -n sample1
copy the output to jsonformatter
You can see the traffic flowing through the proxy into application pod.

App log
Let’s look at app container itself.
k logs aks-helloworld-65ddbc869b-bt9w8 -c aks-helloworld -n sample1
[pid: 13|app: 0|req: 1/1] 127.0.0.1 () {48 vars in 616 bytes} [Sun Nov 20 16:53:54 2022] GET / => generated 629 bytes in 12 msecs (HTTP/1.1 200) 2 headers in 80 bytes (1 switches on core 0)
127.0.0.1 – – [20/Nov/2022:16:53:54 +0000] “GET / HTTP/1.1” 200 629 “-” “curl/7.68.0” “nn.nn.nnn.nnn”
You could notice that request is coming from local host. This is because envoy container sends the traffic from the same host (actually pod – remember pod is same as host in Kubernetes world! “A Pod models an application-specific “logical host” – reference link ).
Lastly, when you opt-in for OSM add-on along with Web application routing add-on, certain things are already taken care of; for example, TLS secret osm-ingress-client-cert is generated and written to kube-system namespace. It also automatically adds app-routing-system namespace to OSM with sidecar-injection disabled mode. This means that in the IngressBackend definition kind: Service can be added for verifying source IPs in addition to identity (AuthenticatedPrincipal) for allowing traffic. This of course adds more protection. Check this file ingressbackend-for-osm-and-webapprouting.yaml in repo.
I hope that these manual steps helped to provide a bit more insight into the role of Web application routing and how it works nicely with Open Service Mesh. We also reviewed a few foundational components of Web application routing such as Nginx, IngressBackend, Envoy and OSM.
Please check srinman/webapproutingwithosm (github.com) for sample code.


Recent Comments