by Contributed | May 21, 2023 | Technology
This article is contributed. See the original author and article here.
How to force filtering on at least one criterion
Another case for using dynamic M parameters and functions
Scenario
Recently I encountered the following issue working with a customer:
- There are two main ways to slice the data before visualizing it in a PBI report.
- The user can filter by one column or two columns coming from two different dimension tables.
- If there is no selection on any of the two columns, the queries fail on lack of resources to perform all the joins and summaries.
- While moving from filtering on one column to filtering on the other column, it is very natural to move through a state in which both filters are open, and the queries are very expensive and eventually fail.
- The goal was to prevent these cases and not to attempt a query with no filtering.
We need to allow multiple selection and also allow for selecting all values in any of the slicers, but we can’t require selection in at least one of the two.
We could create a measure that will return blank if no selection is applied but this will not prevent the query from being executed to calculate the list of items on the visuals.
Solution
Using data in the help cluster, we’ll create a PBI report that will demonstrate a solution to our problem.
The data volume is not so big so the report will return values even if no selection is applied but we want to prevent this kind of query and force a selection on one filter at least.
The two columns used are cities and colors in the two dimension tables Customers and Products respectively.
We start by creating a function with two parameters, one with a list of cities and one with a list of colors.
The function returns all rows that fit the criteria.
A special value will be sent in the parameters if no selection was made, or all values are selected.
The function
.create-or-alter function FilterColorsCities(ColorsList:dynamic,CitiesList:dynamic) {
let Catchall=”__SelectAll__”;
SalesFact
| where not(Catchall in (ColorsList) and Catchall in(CitiesList))
| lookup kind=inner
(Customers | where CityName in(CitiesList) or Catchall in(CitiesList))
on CustomerKey
| lookup kind=inner
(Products | where ColorName in (ColorsList) or Catchall in(ColorsList))
on ProductKey
}
The function applies a filter on the main table that will return 0 rows if both lists include the special value “__SelectAll__”.
At this point, the query will apply the lookups but will terminate immediately and will not use any resources.
Each one of the joined table is filtered by the list of values and the special value returns all values.
You can see the function in the help cluster.
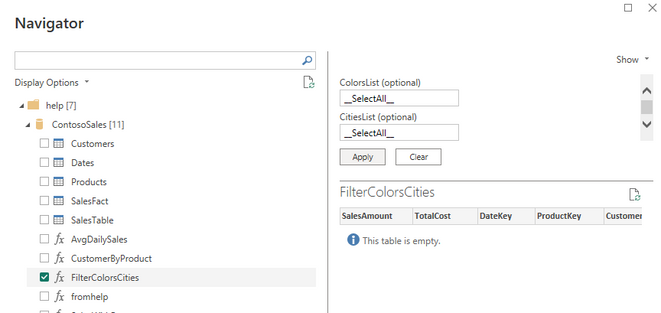
In Power BI
We will navigate to the function and provide the special value “__SelectAll__” as default values for both parameters:
We create two parameters two replace the default values in the step that invokes the function


We use the Customers table and the Products table to create lists of cities and of colors by removing all other columns and removing duplicate rows.
It is recommended to use these tables in Dual mode.
Each column in these two tables is bound of one of the two parameters.

We need to allow multiple selection and allow selecting all values.
The default special value representing all values is the same as the default value if no selection is done.
Final report
Any kind of visuals can use the data returned by the function.
A measure is created to notify the user that a selection is needed.
Empty = if(countrows(FilterColorsCities)=0,”No selection, please select either cities or colors”,””)
A button is added to the page that will apply all filters after a selection.

Summary
Using KQL functions in conjunction with M dynamic parameters allow more control on the order of operations in the query and in some cases can block runaway queries that can drain resources and affect other users.
by Contributed | May 19, 2023 | Technology
This article is contributed. See the original author and article here.
Introduction
AKS or Azure Kubernetes Service is a fully managed Kubernetes container orchestration service that enables you to deploy, scale, and manage containerized applications easily. However, even with the most robust systems issues can arise that require troubleshooting.
This blog post marks the beginning of a three-part series, that originated from an intensive one-day bootcamp focused on advanced AKS networking triage and troubleshooting scenarios. It offers a practical approach to diagnosing and resolving common AKS networking issues, aiming to equip readers with quick troubleshooting skills for their AKS environment.
Each post walks through a set of scenarios that simulate typical issues. Detailed setup instructions will be provided to build a functional environment. Faults will then be introduced that causes the setup to malfunction. Hints will be provided on how to triage and troubleshoot these issues using common tools such as kubectl, nslookup, and tcpdump. Each scenario concludes with fixes for the issues faced and explanation of the steps taken to resolve the problem.
Prerequisites
Before setting up AKS, ensure that you have an Azure account and subscription, with permissions that allows you to create resource groups and deploy AKS clusters. PowerShell needs to be available as PS scripts will be used. Follow instructions provided in this Github link to set up AKS and run scenarios. It is also recommended that you read up on troubleshooting inbound and outbound networking scenarios that may arise in your AKS environment.
For inbound scenarios, troubleshooting connectivity issues pertains to applications hosted on the AKS cluster. Link describes issues related to firewall rules, network security groups, or load balancers, and provides guidance on verifying network connectivity, checking application logs, and examining network traffic to identify potential bottlenecks.
For outbound access, troubleshooting scenarios are related to traffic leaving the AKS cluster, such as connectivity issues to external resources like databases, APIs, or other services hosted outside of the AKS cluster.
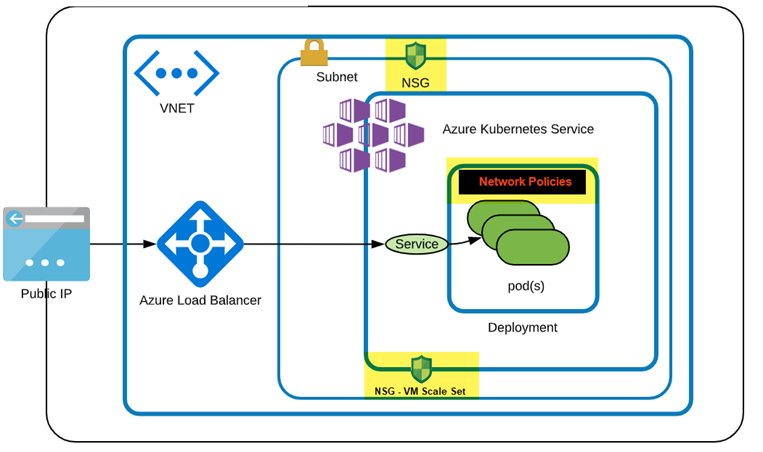
Figure below shows the AKS environment, which uses a custom VNet with its own NSG attached to the custom subnet. The AKS setup uses the custom subnet and will have its own NSG created and attached to the Network Interface of the Nodepool. Any changes to the AKS networking are automatically added to its NSG. However, to apply AKS NSG changes to the custom Subnet NSG, they must be explicitly added.
Scenario 1: Connectivity resolution between pods or services in same cluster
Objective: The goal of this exercise is to troubleshoot and resolve connectivity between pods and services within the same Kubernetes cluster.
Layout: AKS cluster layout with 2 Pods created by their respective deployments and exposed using Cluster IP Service.

Step 1: Set up the environment
- Setup up AKS as outlined in this script.
- Create namespace student and set context to this namespace
kubectl create ns student
kubectl config set-context –current –namespace=student

# Verify current namespace
kubectl config view –minify –output ‘jsonpath={..namespace}’
- Clone solutions Github link and change directory to Lab1 i.e., cd Lab1.
Step 2: Create two deployments and respective services
- Create a deployment nginx-1 with a simple nginx image:
kubectl create deployment nginx-1 –image=nginx
- Expose the deployment as a ClusterIP service:
kubectl expose deployment nginx-1 –name nginx-1-svc –port=80 –target-port=80 –type=ClusterIP
- Repeat the above steps to create nginx-2 deployment and a service:
kubectl create deployment nginx-2 –image=nginx
kubectl expose deployment nginx-2 –name nginx-2-svc –port=80 –target-port=80 –type=ClusterIP
Confirm deployment and service functional. Pods should be running and services listening on Port 80.
kubectl get all
Step 3: Verify that you can access both services from within the cluster by using Cluster IP addresses
# Services returned: nginx-1-svc for pod/nginx-1, nginx-2-svc for pod/nginx-2
kubectl get svc

# Get the values of  and
kubectl get pods

# below should present HTML page from nginx-2
kubectl exec -it  — curl nginx-2-svc:80

# below should present HTML page from nginx-1
kubectl exec -it  — curl nginx-1-svc:80

# check endpoints for the services
kubectl get ep
Step 4: Backup existing deployments
- Backup the deployment associated with nginx-2 deployment:
kubectl get deployment.apps/nginx-2 -o yaml > nginx-2-dep.yaml
- Backup the service associated with nginx-2 service:
kubectl get service/nginx-2-svc -o yaml > nginx-2-svc.yaml
Step 5: Simulate service down
- Delete nginx-2 deployment
kubectl delete -f nginx-2-dep.yaml
- Apply the broken.yaml deployment file found in Lab1 folder
kubectl apply -f broken.yaml
- Confirm all pods are running
kubectl get all
Step 6: Troubleshoot the issue
Below is the inbound flow. Confirm every step from top down.

- Check the health of the nodes in the cluster to see if there is a node issue
kubectl get nodes
- Verify that you can no longer access nginx-2-svc from within the cluster
kubectl exec -it  — curl nginx-2-svc:80
# msg Failed to connect to nginx-2-svc port 80: Connection refused
- Verify that you can access nginx-1-svc from within the cluster
kubectl exec -it  — curl nginx-1-svc:80
# displays HTML page
- Verify that you can access nginx-2 locally. This confirms no issue with the nginx-2 application.
kubectl exec -it  — curl localhost:80
# displays HTML page
- Check the Endpoints using below command and verify that the right Endpoints line up with their Services. There should be at least 1 Pod associated with a service, but none seem to exist for nginx-2 service but nginx-2 service/pod association is fine.
kubectl get ep

- Check label selector used by the Service experiencing issue, using below command:
kubectl describe service
Ensure that it matches the label selector used by its corresponding Deployment using describe command:
kubectl describe deployment
Use ‘k get svc’ and ‘k get deployment’ to get service and deployment names.
Do you notice any discrepancies?
- Using the Service label selector from #3, check that the Pods selected by the Service match the Pods created by the Deployment using the following command
kubectl get pods –selector=
If no results are returned then there must be a label selector mismatch.
From below figure, selector used by deployment returns pods but not the selector used by corresponding service.

- Check service and pod logs and ensure HTTP traffic is seen. Compare nginx-1 pod and service logs with nginx-2. Latter does not show GET requests, suggesting no incoming traffic.
k logs pod/ # no incoming traffic
k logs pod/ # HTTP traffic as seen below
k logs svc/
k logs svc/

Step 7: Restore connectivity
- Check the label selector the Service is associated with and get associated pods:
# Get label
kubectl describe service nginx-2-svc
# When attempting to obtain pods using the service label, results in “no resources found” or “no pods available”.
kubectl describe pods -l app=nginx-2
- Update deployment and apply changes.
kubectl delete -f nginx-2-dep.yaml
In broken.yaml, update labels ‘app: nginx-02’, to ‘app: nginx-2’, as shown below

kubectl apply -f broken.yaml # or apply dep-nginx-2.yaml

k describe pod
k get ep # nginx-2 svc should have pods unlike before
- Verify that you can now access the newly created service from within the cluster:
# Should return HTML page from nginx-2-svc
kubectl exec -it  — curl nginx-2-svc:80

# Confirm above from logs
k logs pod/
Step 8: Using Custom Domain Names
Currently Services in your namespace ‘student’ will resolve using ..svc.cluster.local.
Below command should return web page.
k exec -it — curl nginx-2-svc.student.svc.cluster.local
- Apply broken2.yaml in Lab1 folder and restart CoreDNS
kubectl apply -f broken2.yaml
kubectl delete pods -l=k8s-app=kube-dns -n kube-system

# Monitor to ensure pods are running
kubectl get pods -l=k8s-app=kube-dns -n kube-system
- Validate if DNS resolution works and it should fail wit ‘curl: (6) Could not resolve host:’
k exec -it  — curl nginx-2-svc.student.svc.cluster.local
k exec -it  — curl nginx-2-svc
- Check the DNS configuration files in kube-system which shows the configmap’s, as below.
k get cm -A -n kube-system | grep dns
- Describe each of the ones found above and look for inconsistencies
k describe cm coredns -n kube-system
k describe cm coredns-autoscaler -n kube-system
k describe cm coredns-custom -n kube-system
- Since the custom DNS file holds the breaking changes, either edit coredns-custom and remove data section OR delete the ConfigMap ‘coredns-custom’. Deleting kube-dns pods should re-create deleted ConfigMap ‘coredns-custom’.
kubectl delete cm coredns-custom -n kube-system
kubectl delete pods -l=k8s-app=kube-dns -n kube-system

# Monitor to ensure pods are running
kubectl get pods -l=k8s-app=kube-dns -n kube-system
- Confirm DNS resolution now works as before.
kubectl exec -it — curl nginx-2-svc.student.svc.cluster.local
# Challenge lab: Resolve using FQDN aks.com #
# Run below command to get successful DNS resolution
k exec -it  — curl nginx-2-svc.aks.com

# Solution #
k apply -f working2.yaml
kubectl delete pods -l=k8s-app=kube-dns -n kube-system

# Monitor to ensure pods are running
kubectl get pods -l=k8s-app=kube-dns -n kube-system

# Confirm working using below cmd
k exec -it  — curl nginx-2-svc.aks.com

# Bring back to default
k delete cm coredns-custom -n kube-system
kubectl delete pods -l=k8s-app=kube-dns -n kube-system

# Monitor to ensure pods are running
kubectl get pods -l=k8s-app=kube-dns -n kube-system
Step 9: What was in the broken files
In broken.yaml deployment labels didn’t match up with the service i.e., it should have been nginx-2

In broken2.yaml breaking changes were made that resolved ‘student.svc.cluster.local’ to ‘bad.cluster.local’, which broke DNS resolution.
$kubectl_apply=@”
apiVersion: v1
kind: ConfigMap
metadata:
  name: coredns-custom
  namespace: kube-system
data:
  internal-custom.override: | # any name with .server extension
    rewrite stop {
      name regex (.*).svc.cluster.local {1}.bad.cluster.local.
      answer name (.*).bad.cluster.local {1}.svc.cluster.local.
    }
“@
$kubectl_apply | kubectl apply -f –
Step 10: Cleanup
k delete deployment/nginx-1 deployment/nginx-2 service/nginx-1-svc service/nginx-2-svc
or just delete namespace >  k delete ns student
Scenario 2: DNS and External access failure resolution
Objective: The goal of this exercise is to troubleshoot and resolve Pod DNS lookups and DNS resolution failures.
Layout: Cluster layout as shown below has NSG applied to AKS subnet, with Network Policies in effect.

Step 1: Set up the environment
- Setup up AKS as outlined in this script.
- Create and switch to the newly created namespace
kubectl create ns student
kubectl config set-context –current –namespace=student

# Verify current namespace
kubectl config view –minify –output ‘jsonpath={..namespace}’
- Clone solutions Github link and change directory to Lab2 i.e., cd Lab2.
Step 2: Verify DNS Resolution works within cluster
- Create pod for DNS validation within Pod
kubectl run dns-pod –image=nginx –port=80 –restart=Never
kubectl exec -it dns-pod — bash

# Run these commands at the bash prompt
apt-get update -y
apt-get install dnsutils -y
exit
- Test and confirm DNS resolution resolves to the correct IP address.
kubectl exec -it dns-pod — nslookup kubernetes.default.svc.cluster.local
Step 3: Break DNS resolution
- From Lab2 folder apply broken1.yaml
kubectl apply -f broken1.yaml
- Confirm running below command results in ‘connection timed out; no servers could be reached’
kubectl exec -it dns-pod — nslookup kubernetes.default.svc.cluster.local
Step 4: Troubleshoot DNS Resolution Failures
- Verify DNS resolution works within the AKS cluster
kubectl exec -it dns-pod — nslookup kubernetes.default.svc.cluster.local
# If response ‘connection timed out; no servers could be reached’ then proceed below with troubleshooting
- Validate DNS service which should show port 53 in use
kubectl get svc kube-dns -n kube-system
- Check logs for pods associated with kube-dns
$coredns_pod=$(kubectl get pods -n kube-system -l k8s-app=kube-dns -o=jsonpath='{.items[0].metadata.name}’)
kubectl logs -n kube-system $coredns_pod
- If a custom ConfigMap is present, verify that the configuration is correct.
kubectl describe cm coredns-custom -n kube-system
- Check for networkpolicies currently in effect. If DNS related then describe and confirm no blockers. If network policy is a blocker then have that removed.
kubectl get networkpolicy -A
NAMESPACE     NAME              POD-SELECTOR
kube-system   block-dns-ingress  k8s-app=kube-dns
kubectl describe networkpolicy block-dns-ingress -n kube-system
# should show on Ingress path not allowing DNS traffic to UDP 53
- Remove the offending policy
kubectl delete networkpolicy block-dns-ingress -n kube-system
- Verify DNS resolution works within the AKS cluster. Below is another way to create a Pod to execute task as nslookup and delete on completion
kubectl run -it –rm –restart=Never test-dns –image=busybox –command — nslookup kubernetes.default.svc.cluster.local
# If the DNS resolution is working correctly, you should see the correct IP address associated with the domain name
- Check NSG has any DENY rules that might block port 80. If exists, then have that removed
# Below CLI steps can also be performed as a lookup on Azure portal under NSG
Step 5: Create external access via Loadbalancer
- Expose dns-pod with service type Load Balancer.
kubectl expose pod dns-pod –name=dns-svc –port=80 –target-port=80 –type LoadBalancer
- Confirm allocation of External-IP.
kubectl get svc
- Confirm External-IP access works within cluster.
kubectl exec -it dns-pod — curl
- Confirm from browser that External-IP access fails from internet to cluster.
curl
Step 6: Troubleshoot broken external access via Loadbalancer
- Check if AKS NSG applied on the VM Scale Set has an Inbound HTTP Allow rule.
- Check if AKS Custom NSG applied on the Subnet has an ALLOW rule and if none then apply as below.
$custom_aks_nsg = “custom_aks_nsg” # <- verify
$nsg_list=az network nsg list –query “[?contains(name,’$custom_aks_nsg’)].{Name:name, ResourceGroup:resourceGroup}” –output json

# Extract Custom AKS Subnet NSG name, NSG Resource Group
$nsg_name=$(echo $nsg_list | jq -r ‘.[].Name’)

$resource_group=$(echo $nsg_list | jq -r ‘.[].ResourceGroup’)
echo $nsg_list, $nsg_name, $resource_group

$EXTERNAL_IP=””
az network nsg rule create –name AllowHTTPInbound `
–resource-group $resource_group –nsg-name $nsg_name `
–destination-port-range 80 –destination-address-prefix $EXTERNAL_IP `
–source-address-prefixes Internet –protocol tcp `
–priority 100 –access allow
- After ~60s, confirm from browser that External-IP access succeeds from internet to cluster.
curl
Step 7: What was in the broken files
Broken1.yaml is a Network Policy that blocks UDP ingress requests on port 53 to all Pods

Step 8: Cleanup
k delete pod/dns-pod
or
k delete ns student

az network nsg rule delete –name AllowHTTPInbound `
–resource-group $resource_group –nsg-name $nsg_name
Conclusion
This post demonstrates common connectivity and DNS issues that can arise when working with AKS. The first scenario focuses on resolving connectivity problems between pods and services within the Kubernetes cluster. We encountered issues where the assigned labels of a deployment did not match the corresponding pod labels, resulting in non-functional endpoints. Additionally, we identified and rectified issues with CoreDNS configuration and custom domain names. The second scenario addresses troubleshooting DNS and external access failures. We explored how improperly configured network policies can negatively impact DNS traffic flow. In the next article, second of the three-part series, we will delve into troubleshooting scenarios related to endpoint connectivity across virtual networks and tackle port configuration issues involving services and their corresponding pods.
Disclaimer
The sample scripts are not supported by any Microsoft standard support program or service. The sample scripts are provided AS IS without a warranty of any kind. Microsoft further disclaims all implied warranties including, without limitation, any implied warranties of merchantability or of fitness for a particular purpose. The entire risk arising out of the use or performance of the sample scripts and documentation remains with you. In no event shall Microsoft, its authors, or anyone else involved in the creation, production, or delivery of the scripts be liable for any damages whatsoever (including, without limitation, damages for loss of business profits, business interruption, loss of business information, or other pecuniary loss) arising out of the use of or inability to use the sample scripts or documentation, even if Microsoft has been advised of the possibility of such damages.
by Contributed | May 18, 2023 | Technology
This article is contributed. See the original author and article here.
Code Optimizations: A New AI-Based Service for .NET Performance Optimization
We are thrilled to announce that Code Optimizations (previously known as Optimization Insights) is now available in public preview! This new AI-based service can identify performance issues and offer recommendations specifically tailored for .NET applications and cloud services.
What is Code Optimizations?
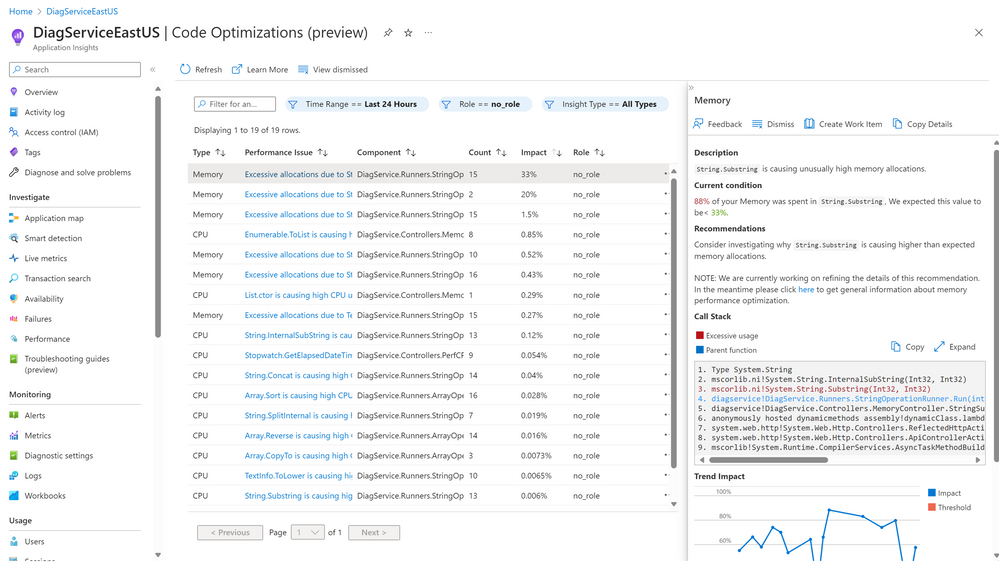
Code Optimizations is a service within Application Insights that continuously analyzes profiler traces from your application or cloud service and provides insights and recommendations on how to improve its performance.
Code Optimizations can help you identify and solve a wide range of performance issues, ranging from incorrect API usages and unnecessary allocations all the way to issues relating to exceptions and concurrency. It can also detect anomalies whenever your application or cloud service exhibits abnormal CPU or Memory behavior.
Code Optimizations Page
Why should I use Code Optimizations?
Code Optimizations can help you optimize the performance of your .NET applications and cloud services by:
- Saving you time and effort: Instead of manually sifting through gigabytes of profiler data or relying on trial-and-error methods, you can use Code Optimizations to automatically uncover complex performance bugs and get guidance on how to solve them.
- Improving your user experience: By improving the speed and reliability of your application or cloud service, you can enhance your user satisfaction and retention rates. This can also help you gain a competitive edge over other apps or services in your market.
- Saving you money: By fixing performance issues early and efficiently, you can reduce the need for scaling out cloud resources or paying for unnecessary compute power. This can help you avoid problems such as cloud sprawling or overspending on your Azure bill.
How does Code Optimizations work?
Code Optimizations relies on an AI model trained on thousands of traces collected from Microsoft-owned services around the globe. By learning from these traces, the model can glean patterns corresponding to various performance issues seen in .NET applications and learn from the expertise of performance engineers at Microsoft. This enables our AI model to pinpoint with accuracy a wide range of performance issues in your app and provide you with actionable recommendations on how to fix them.
Code Optimizations runs at no additional cost to you and is completely offline to the app. It has no impact on your app’s performance.
How can I use Code Optimizations?
If you are interested in trying out this new service for free during its public preview period, you can access it using the following steps:
- Sign up for Application Insights if you haven’t already. Application Insights is a powerful application performance monitoring (APM) tool that helps you monitor, diagnose, and troubleshoot your apps.
- Enable profiling for your .NET app or cloud service. Profiling collects detailed information about how your app executes at runtime.
- Navigate to the Application Insights Performance blade from the left navigation pane under Investigate and select Code Optimizations from the top menu.
 Link to Code Optimizations from Application Insights: Performance
Click here for the documentation.
Click here for information on troubleshooting.
Fill out this quick survey if you have any additional issues or questions.
by Contributed | May 17, 2023 | Technology
This article is contributed. See the original author and article here.
Microsoft has been on a journey to harness the power of artificial intelligence to help security teams scale more effectively. Microsoft 365 Defender correlates millions of signals across endpoints, identities, emails, collaboration tools, and SaaS apps to identify active attacks and compromised assets in an organization’s environment. Last year, we introduced automatic attack disruption, which uses these correlated insights and powerful AI models to stop some of the most sophisticated attack techniques while in progress to limit lateral movement and damage.
Today, we are excited to announce the expansion of automatic attack disruption to include adversary-in-the-middle attacks (AiTM) attacks, in an addition to the previously announced public preview for business email compromise (BEC) and human-operated ransomware attacks.
AiTM attacks are a widespread and can pose a major risk to organizations. We are observing a rising trend in the availability of adversary-in-the-middle (AiTM) phishing kits for purchase or rent, with our data showing that over organizations have already been attacked in 2023.
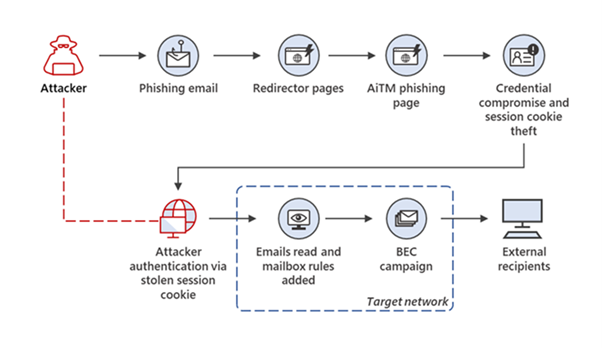
During AiTM attacks (Figure 1), a phished user interacts with an impersonated site created by the attacker. This allows the attacker to intercept credentials and session cookies and bypass multifactor authentication (MFA), which can then be used to initiate other attacks such as BEC and credential harvesting.
Automatic attack disruption does not require any pre-configuration by the SOC team. Instead, it’s built in as a capability in Microsoft’s XDR.
Figure 1. Example of an AiTM phishing campaign that led to a BEC attack
How Microsoft’s XDR automatically contains AiTM attacks
Similarly to attack disruption of BEC and human-operated ransomware attacks, the goal is to contain the attack as early as possible while it is active in an organization’s environment and reduce its potential damage to the organization. AiTM attack disruption works as follows:
- High-confidence identification of an AiTM attack based on multiple, correlated Microsoft 365 Defender signals.
- Automatic response is triggered that disables the compromised user account in Active Directory and Azure Active Directory.
- The stolen session cookie will be automatically revoked, preventing the attacker from using it for additional malicious activity.
 Figure 2. An example of a contained AiTM incident, with attack disruption tag
To ensure SOC teams have full control, they can configure automatic attack disruption and easily revert any action from the Microsoft 365 Defender portal. See our documentation for more details.
Get started
- Make sure your organization fulfills the Microsoft 365 Defender pre-requisites
- Connect Microsoft Defender for Cloud Apps to Microsoft 365.
- Deploy Defender for Endpoint. A free trial is available here.
- Deploy Microsoft Defender for Identity. You can start a free trial here.
Learn more
by Contributed | May 16, 2023 | Technology
This article is contributed. See the original author and article here.
Introduction
Earlier in May 2022, we launched Azure Monitor HCI Insights for public preview. Based on customer feedback during the preview, we improved the performance of the workbooks and supported the new Azure Monitor Agent and are excited to announce General Availability (GA) of Azure Monitor HCI Insights.
What is HCI Insights?
Azure Stack HCI Insights is an interactive, fully integrated service which provides health, performance, and usage insights about Azure Stack HCI clusters that are connected to Azure and are enrolled in Azure Monitor. In Microsoft Azure, you can see all your resources in Azure portal and monitor them with Azure Stack HCI Insights.
There are some key benefits of using Azure Stack HCI Insights:
- It’s managed by Azure and accessed from Azure portal, so it’s always up to date, and there’s no database or special software setup required.
- Azure Monitor Agent uses managed identity to interact with Log analytics workspace which ensures secure communication.
- It’s highly scalable, which means it is capable of loading more than 250 cluster information sets across multiple subscriptions at a time, with no boundary limitations on cluster, domain, or physical location.
- It’s highly customizable. The user experience is built on top of Azure Monitor workbook templates, where you can easily add/remove/edit visualizations and queries.
- HCI Insights follows Pay-as-you-go model which means you pay only for the logs that are collected and they can be removed/edited as per user need.
What’s new in GA?
The new, enhanced Azure Monitor HCI Insights uses the new improved Azure Monitor Agent and Data Collection Rule. These rules specify the event logs and performance counters that need to be collected and stores it in a Log Analytics workspace. Once the logs are collected, HCI Insights uses Azure Monitor Workbooks to provide deeper insights on the health, performance and usage of the cluster.
There are a few prerequisites for using Azure Stack HCI Insights:
- Azure Stack HCI cluster should be registered with Azure and Arc-enabled. If you registered your cluster on or after June 15, 2021, this happens by default. Otherwise, you’ll need to enable Azure Arc integration.
- The cluster must have Azure Stack HCI version 22H2 and the May 2023 cumulative update or later installed.
- Enable the managed identity for the Azure resource. For more information, see Enabled enhanced management.
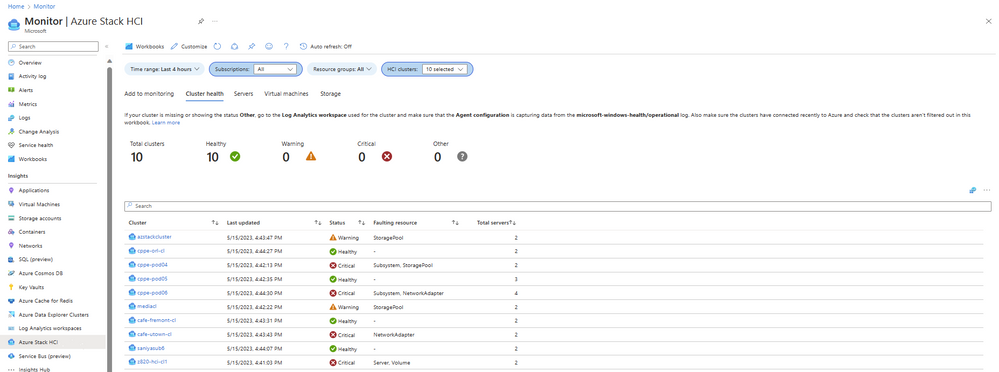
Below is a screenshot of the Azure workbook displayed for multiple clusters.
You can click on the cluster name, and it will redirect you to the single cluster workbook template with a drill down view and more details as shown below:

Pre-defined workbook templates exist with default views to give you a head-start. You can switch between different tabs like Health, Servers, Virtual machines, and Storage. Each tab provides data and metrics about the cluster which is carefully designed keeping your needs in mind. Health data such as faults and resource status, performance data like IOPS and throughput, and usage data like CPU usage and memory usage are collected. Moreover, the rich visualizations make it easier to decipher the data and give a quick glance of useful insights.
Additional data can be easily collected in the form of event logs or performance counters, and you can add it to the Data collection rule that was created while enabling monitoring for the cluster. Once the data starts flowing, the user can use Azure workbooks to visualize the collected data. A workbook provides a set of visualizations like charts, graphs, grids, honeycomb, composite bar, maps etc. and it is very convenient to modify and alter. It allows you to pin the graphs to Azure dashboards which gives a holistic view of resource health, performance, and usage. It is also very easy to share the data by downloading this information in Excel and deriving useful insights.
Customers also use logs and Insights workbook templates to create alerts. Some of the common alerts created by customers are if cluster node is down, and if CPU or memory usage exceeds set threshold. You can set up alerts for multiple clusters and integrate 3rd party solutions like PagerDuty to get notified. This will make sure that you take timely action and resources are healthy and performant.

Here is a video with more details.
Future plans
This is just the beginning of Monitoring Insights for Azure Stack HCI. We plan to build additional workbook templates for new HCI features and essential monitoring capabilities. If you have feedback, please send it to hcimonitoring@microsoft.com!
For more detailed information, please visit our documentation for Single Cluster Insights and Multiple Cluster Insights .

Recent Comments