by Scott Muniz | Sep 9, 2020 | Azure, Technology, Uncategorized
This article is contributed. See the original author and article here.
Use Case:
To peek/delete the scheduled messages from Azure service bus.
Pre-Requisites:
- Azure Service bus Namespace
- Azure Service bus SAS connection string
- Console Application to peek/delete the scheduled message
Scenarios:
- Query scheduled messages before the enqueue time.
- You can process the scheduled message with future enqueue time and can delete it post processing them.
Steps to follow:
You can schedule messages either by setting the ScheduledEnqueueTimeUtc property when sending a message through the regular send path, or explicitly with the ScheduleMessageAsync API. The latter immediately returns the scheduled message’s SequenceNumber, which you can later use to cancel the scheduled message.
Scheduled messages and their sequence numbers can also be discovered using message browsing.
Message browsing, or peeking, enables a Service Bus client to enumerate all messages that reside in a queue or subscription, typically for diagnostic and debugging purposes. The peek operations return all messages that exist in the queue or subscription message log, not only those available for immediate acquisition with Receive() or the OnMessage() loop. The State property of each message tells you whether the message is active (available to be received), deferred, or scheduled.
Pull messages from the service bus entity using the ‘Peek’ method, this method fetches all the active (available to be received) and scheduled messages (future Enqueue date) and if fetched message ScheduledEnqueueTimeUtc property is not null then that message is scheduled message.
Post processing the scheduled message if you want to delete it then please use the CancelScheduledMessageAsync method by passing the sequenceNumber.
Refer the sample code to Peek the messages from the queue and then delete the Scheduled messages.
using System.Threading.Tasks;
using Microsoft.Azure.ServiceBus;
using Microsoft.Azure.ServiceBus.Core;
using System.Collections;
using System.Collections.Generic;
namespace ReceiverQueueScheduledMessage
{
class Program
{
// Connection String for the namespace can be obtained from the Azure portal under the
// ‘Shared Access policies’ section.
const string ServiceBusConnectionString = “[Service bus connection string]”;
const string QueueName = “[Queue Name]”;
static IQueueClient queueClient;
static IMessageReceiver messageReceiver;
static void Main(string[] args)
{
MainAsync().GetAwaiter().GetResult();
}
static async Task MainAsync()
{
queueClient = new QueueClient(ServiceBusConnectionString, QueueName);
Console.WriteLine(“======================================================”);
Console.WriteLine(“Press ENTER key to exit after receiving all the messages.”);
Console.WriteLine(“======================================================”);
messageReceiver = new MessageReceiver(ServiceBusConnectionString, QueueName);
Message message = await messageReceiver.PeekAsync();
// Message with property ScheduledEnqueueTimeUtc not null means scheduled message
if (message != null && message.ScheduledEnqueueTimeUtc != null)
{
await queueClient.CancelScheduledMessageAsync(message.SystemProperties.SequenceNumber);
}
Console.ReadKey();
await queueClient.CloseAsync();
}
}
}
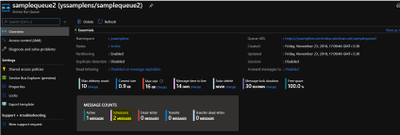
Pushed schedule messages to the queue, as shown in below screenshot (Queue name ‘samplequeue2’) has 2 scheduled messages:

Run the above code and Peek the message and check schedule message ‘ScheduledEnqueueTimeUtc’ property:

Once CancelScheduledMessageAsync method is called for the schedule message, schedule message will be deleted from the queue:

Running the above sample code, you should be able to peek/delete all the scheduled messages from Azure service bus.
Hope this helps!
by Scott Muniz | Sep 9, 2020 | Azure, Technology, Uncategorized
This article is contributed. See the original author and article here.
 TROUBLESHOOTING WINDOWS 10 UPDATE for BUSINESS
With AZURE UPDATE COMPLIANCE
& AZURE LOG ANALYTICS
____________________________________________________________________________________________Cory Roberts and Tan Tran
Dear IT Pros,
Recently I and Cory Roberts, Microsoft Sr. CE, worked together on a Customer’s Project, We were upgrading roughly eight thousands Windows 10 devices from multiple versions of Windows 10, (1803, 1809, 1903, 1909) to the current branch 2004. The upgrade deployment has been proceeded with Microsoft Endpoint Manager.
In Endpoint Manager, besides Device Status and End User Update Status, there was not much data provided by Endpoint Monitor or Log. It was hard to troubleshoot the windows 10 feature update process… We decided to go with Azure Update Compliance and Azure Log Analytics Query for monitoring and troubleshooting the Windows Feature Update deployment to match our Customer’s need.
The steps to use Log Analytics for troubleshooting of Endpoint Manager Deployment on Windows 10 Feature Update as follow:
- In Endpoint Manager, create Windows 10 Feature Update Deployment and assign to the related Device Group.
- Create Log Analytics Workspace (if you do not have one).
- Install Update Compliance from Azure Market Place
- Onboarding Update Compliance for Windows 10 devices
- Set Windows 10 Clients to forward telemetry data to Log Analytics Workspace.
- Using Kusto Queries to Monitor and Troubleshoot the Upgrade Process.
____________________________________________________________________________
- In Endpoint Manager, create Windows 10 Feature Update Deployment and assign to the related Device Group
– In Endpoint ManagerDevices,
– Windows 10 Feature Update, Create Profile

– Choose the update to deploy

– Assign to Device Group and create the deployment.
II. Create Log Analytics Workspace (if you do not have one).
- In Azure Portal, search for log analytic workspace

- Creating the Log Analytic Workspace:

- Configure Resource Group and location for Log Analytics Workspace


III. Install Azure Update Compliance from Market Place:
Update Compliance uses Windows 10 diagnostic data for all of its reporting. It collects system data including update deployment progress, Windows Update for Business configuration data, and Delivery Optimization usage data, and then sends this data to a customer-owned Azure Log Analytics workspace to power the experience.
- Update Compliance works only with desktops of Windows 10 Professional, Education, and Enterprise editions. It is not support for Windows Server, Surface Hub, IoT.
- Update Compliance required windows 10 device telemetry at minimum basic level and a Commercial ID, a globally-unique identifier assigned to a specific Solution of Log Analytics workspace.
- After Update Compliance is configured, it could take 48-72 hours before they first appear and continue refreshing its data every 12 hour
- Update Compliance also provide Windows Update Delivery Optimization Status (WUDOAggregratedStatus, WUDOStatus), and Windows Defender Antivirus Threat and Update status (WDAV Threat, WDAVStatus)
To Install Azure Update Compliance
- Go to Azure search and type Update Compliance,
- Choose MarketplaceUpdate Compliance

- Choose the same LogAnalytics Workspace

Now, the Update Compliance Log will be available for Query search in Log Analytics Workspace as shown here:

To Configure GPO for Update Compliance Clients:
- Go to Computer Configuration>Administrative Templates>Windows ComponentsData Collection and Preview Build
- Choose “Allow Telemetry” and set level of diagnostic to at least basic level
- Choose “Configure the Commercial ID” and copy and paste ID from WaaSUpdateInsight to the GPO setting box
You could view the Commercial ID from the WaaSUpdateInsight as shown:

- Choose “Allow device name to be sent in Windows diagnostic data” and Enabled
IV. Onboarding Update Compliance for Windows 10 Devices.
The Update Compliance Configuration Script is the recommended method of configuring devices to send Telemetry data to Azure Log Analytics Workspace for use with Update Compliance. The script configures device policies via Group Policy, ensures that required services are running, and more.
You can download the script here.
The script is organized into two folders Pilot and Deployment. Both folders have the same key files: ConfigScript.ps1 and RunConfig.bat.
You configure RunConfig.bat according to the directions in the .bat itself, which will then execute ConfigScript.ps1 with the parameters entered to RunConfig.bat.
- The Pilot folder is more verbose and is intended to be use on an initial set of devices and for troubleshooting. Pilot script will collect and output detailed logs
- The Deployment folder is intended to be deployed across an entire device population in a specific environment once devices in that environment have been validated with the Pilot script.
- Configure commercialIDValue in RunConfig.bat to your CommercialID.
- Use a management tool like Configuration Manager or Intune to broadly deploy the script to your entire target population.
Steps to Deploy Update Compliance to Clients:
- Edit PilotRunConfig.bat with Commercial ID of your WaaSInsight Solution and Location for log folder.
- Run the PilotRunConfig.bat and generate errors in report from log folder
- Review log files and correct the problems.
- Edit DeploymentRunConfig.bat with Commercial ID of your WaaSInsight Solution and Location for log folder.
- Run the DeploymentRunConfig.bat. Process may take more than 48hrs for collected data to show up in the Update Compliance Dashboard

V. Set Windows 10 Clients Agent to forward data to Log Analytics Workspace.
Deploy Microsoft Monitoring Agents (MMA) as installation application to all Windows 10 Clients using SCCM.
- Download MMASetup-AMD64.exe and use 7-zip to extract MOMAgent.msi from MMASetup-AMD64.exe
- Create SCCM MMA application using the following command:
msiexec /i MOMAgent.msi ADD_OPINSIGHTS_WORKSPACE=1 OPINSIGHTS_WORKSPACE_ID=Your-WorkspaceID OPINSIGHTS_WORKSPACE_KEY=Your-PrimaryKEY AcceptEndUserLicenseAgreement=1 /q
- Deploy the MOMAgent Application to all Windows 10 SCCM Clients
Configure Log Analytic to collect Windows 10 upgrade logs.
Configure Log Analytics to collect the system event log and application event log together with the Windows update client event logs.
To collect Event Viewer Log for Log Analytics Workspace:
- Log Analytics WorkspaceAdvanced settings

- Choose Windows Event Logs
- Type “Application” and click the + button
- Type “System” and click the + button
- Type “Microsoft-Windows-DeviceSetupManager/Admin” and click the + button
- Type “Microsoft-WindowsUpdateClient/Operation” and click the + button

To collect Windows Upgrade logs for Log Analytics:
There are 4 Windows 10 upgrade phases,
- Downlevel phase: prepare upgrade installer source and destination in Windows 10 OS current version.
- SafeOS phase, WinPE running phase, copying file for setup, prepare disk and file system table if needed, …
- Firstboot phase, Windows system driver installation and reboot.
- Secondboot phase, New version of Windows 10 OS is running, continue installing software applications and drivers.
Depend on the Windows 10 upgrade phases the same upgrade log name could be in different Windows directory locations as shown here, The $WINDOWS~BT path is not working in Log Analytics service:
|
Log file name
|
Location
|
Suggestions
|
|
|
|
|
|
setupact.log
|
$Windows.~BTSourcesPanther
|
All down-level failures and rollback investigations
|
|
setupact.log
|
$Windows.~BTSourcesPantherUnattendGC
|
OOBE phase rollbacks, 0x4001C, 0x4001D, 0x4001E, 0x4001F
|
|
setupact.log
|
$Windows.~BTSourcesRollback
|
Generic rollbacks, 0xC1900101
|
|
setupact.log
|
Windows
|
Setup launch failures
|
|
setupact.log
|
WindowsPanther
|
Post-upgrade issues
|
|
setuperr.log
|
$Windows.~BTSourcesPanther
|
Complete error listing
|
|
setuperr.log
|
$Windows.~BTSourcesPantherUnattendGC
|
Complete error listing
|
|
setuperr.log
|
$Windows.~BTSourcesRollback
|
Complete error listing
|
|
setuperr.log
|
Windows
|
Complete error listing
|
|
setuperr.log
|
WindowsPanther
|
Complete error listing
|
|
miglog.xml
|
WindowsPanther
|
Post-upgrade issues
|
|
BlueBox.log
|
WindowsLogsMosetup
|
WSUS and WU down-level failures
|
|
setupapi.dev.log
|
$Windows.~BTSourcesRollback
|
Device install issues
|
|
setupapi.dev.log
|
C:Windowsinf
|
Complete Device install issues
|
|
Setupapi.app.log
|
C:Windowsinf
|
PNP information about operations that install devices and drivers
|
|
…
|
|
|
- Go to DataCustom log

- Click Add, and “Choose File” button to browse to the log directories specified in the above table.

- Continue add all the logs and path as shown:

- Enter Name of log collection CL, no space allowed in Name.


You may get permission error, and you would need to “enable inheritance” permission as shown:

VI. Using Kusto Queries to Monitor and Troubleshoot the Upgrade Process.
All the search for upgrade status, update compliance status, Windows update delivery optimizaton information could be done by one tool, the Analytics Workspace Log Query as shown:

To Review Update Log and search for errors:
Run Log Analytics Query to search for update error in windows logs of devices:
- In Azure Portal, Log Analytics Workspace
- Logs, click on + to create new query

- Choose the Custom Logs, double click to insert the related log to Query Windows
- Run Query
Query Custom Logs for All Upgrade errors:
CompleteWindowsSetupLog_CL
| where TimeGenerated <= ago(24m)
| where RawData contains “error“

Query Custom Logs for Upgrade Device Driver Error
PNPDeviceError_CL
| where RawData contains “failure“

Query Custom Logs for Upgrade OOBE and other setup error:
WindowsUpdatePhaseGC_CL
| where RawData contains “error“
| where RawData contains “WimBoot“ or RawData contains “OOBE” or RawData contains “storage“
| project TimeGenerated, Computer, RawData, Type

To Search Event Log for Update Errors:
Query System Event for Update information:
Event
|where TimeGenerated > ago(1d)
| where EventLog contains “system“
| where RenderedDescription contains “Update“
| project TimeGenerated, EventLog, Computer, EventID

To Search Update Compliance Log for Ugrade Errors:
Update Compliance Log provide the pre-built Desktop Analytics queries for all status of update included the following:
- Deployment failures,
- Reboot pending,
- Feature or quality update deferral/pause,
- Update automatic hold by Windows 10 Safeguard (to prevent hardware or software incompatibilities)

In Log Analytics Workspace, there is very useful Update Compliance Logs’ tables related to WaaS and Windows Update Delivery Optimization as shown:

The Update Compliance Logs Query might become our best option in troubleshooting Endpoint Manager Update Feature Deployment.
- Query WaaS for Windows 10 Upgrade with “Not up-to-date” Status:
WaaSUpdateStatus
| where OSFeatureUpdateStatus contains “Not Up-to-date“
| project Computer, LastScan, OSName, OSVersion, FeatureDeferralDays, FeaturePauseState, NeedAttentionStatus

- Query WaaS for Upgrade Deployment with error:
WaaSDeploymentStatus
| where DeploymentErrorCode != “0”
- Query WaaS for Feature Update Deployment not successful, listed by Computer name, Last Scan time, Deployment Status, DetailedStatus…
The DetailedStatus column may show recent feature of Windows 10 2004 with “Safeguard Hold” in the column, Safeguard hold was used to prevent imcompatible device hardware from being upgraded.
WaaSDeploymentStatus
| where DetailedStatus != “UpdateSuccessful“
| where UpdateCategory == “Feature”
| project Computer, LastScan, DeploymentStatus, DeploymentErrorCode, DetailedStatus
- List Feature Update and Quality Update Status of a specific Computer:
WaaSUpdateStatus
| where Computer == “YourComputerName“ and TimeGenerated > ago(30d)
| summarize arg_max(TimeGenerated,OSFeatureUpdateStatus, OSQualityUpdateStatus, NeedAttentionStatus, OSVersion) by Computer
- Query WaaS for Upgrade Deployment with Failed Status and not contain a specific error code:
WaaSDeploymentStatus
| where TimeGenerated > ago(7d)
| where UpdateCategory == ‘Feature’
| where UpdateClassification == ‘Upgrade’
| where DeploymentStatus == ‘Failed‘
| where DeploymentErrorCode notcontains “8007001F”
| where DeploymentError == “N/A”
| where PauseState != “”
Export result to csv file for later investigation of update failure’s root cause.

After we get update error code from query result, then we will need to translate code error to meaningful root cause by using the error reference table from the following link:
https://docs.microsoft.com/en-us/windows/deployment/update/windows-update-error-reference
Continue troubleshooting and testing the deployment of feature updates until we get no error in Log Analytics Query.
You could generate an Intune’s update report-workbook as suggested by Jeff Gilbert blog
References:
Windows update logs file:
https://docs.microsoft.com/en-us/windows/deployment/update/windows-update-logs
Installing Log Analytics Agent for Windows Computers:
https://docs.microsoft.com/en-us/azure/azure-monitor/platform/agent-windows
Update Compliance Setup and Log Analytics Queries:
https://docs.microsoft.com/en-us/windows/deployment/update/update-compliance-get-started
https://docs.microsoft.com/en-us/windows/deployment/update/update-compliance-configuration-manual
https://docs.microsoft.com/en-us/windows/deployment/update/update-compliance-configuration-script
https://docs.microsoft.com/en-us/windows/deployment/update/update-compliance-configuration-manual
https://www.configjon.com/update-compliance-log-analytics-queries/
https://www.jeffgilb.com/update-compliance-with-intune/
Kusto Query tips and examples:
https://docs.microsoft.com/en-us/azure/azure-monitor/log-query/datetime-operations?toc=%2Fazure%2Fazure-monitor%2Ftoc.json#date-time-basics
https://docs.microsoft.com/en-us/azure/azure-monitor/log-query/get-started-portal
https://docs.microsoft.com/en-us/azure/azure-monitor/log-query/examples
https://docs.microsoft.com/en-us/azure/data-explorer/kusto/query/samples
I hope the information is useful for Windows Feature Update Troubleshooting.
On my next blogpost, we will re-visit and discuss Update Compliance again.
Cheers!
____________________________________________________________________________________________________
Disclaimer
The sample scripts are not supported under any Microsoft standard support program or service. The sample scripts are provided AS IS without warranty of any kind. Microsoft further disclaims all implied warranties including, without limitation, any implied warranties of merchantability or of fitness for a particular purpose. The entire risk arising out of the use or performance of the sample scripts and documentation remains with you. In no event shall Microsoft, its authors, or anyone else involved in the creation, production, or delivery of the scripts be liable for any damages whatsoever (including, without limitation, damages for loss of business profits, business interruption, loss of business information, or other pecuniary loss) arising out of the use of or inability to use the sample scripts or documentation, even if Microsoft has been advised of the possibility of such damages.
by Scott Muniz | Sep 8, 2020 | Azure, Technology, Uncategorized
This article is contributed. See the original author and article here.
A few months ago I wrote a post on how to use GraphQL with CosmosDB from Azure Functions, so this post might feel like a bit of a rehash of it, with the main difference being that I want to look at it from the perspective of doing .NET integration between the two.
The reason I wanted to tackle .NET GraphQL with Azure Functions is that it provides a unique opportunity, being able to leverage Function bindings. If you’re new to Azure Functions, bindings are a way to have the Functions runtime provide you with a connection to another service in a read, write or read/write mode. This could be useful in the scenario of a function being triggered by a file being uploaded to storage and then writing some metadata to a queue. But for todays scenario, we’re going to use a HTTP triggered function, our GraphQL endpoint, and then work with a database, CosmosDB.
Why CosmosDB? Well I thought it might be timely given they have just launched a consumption plan which works nicely with the idea of a serverless GraphQL host in Azure Functions.
While we have looked at using .NET for GraphQL previously in the series, for this post we’re going to use a different GraphQL .NET framework, Hot Chocolate, so there’s going to be some slightly different types to our previous demo, but it’s all in the name of exploring different options.
Getting Started
At the time of writing, Hot Chocolate doesn’t officially support Azure Functions as the host, but there is a proof of concept from a contributor that we’ll use as our starting point, so start by creating a new Functions project:
func init dotnet-graphql-cosmosdb --dotnet
Next, we’ll add the NuGet packages that we’re going to require for the project:
<PackageReference Include="Microsoft.Azure.Functions.Extensions" Version="1.0.0" />
<PackageReference Include="Microsoft.NET.Sdk.Functions" Version="3.0.3" />
<PackageReference Include="HotChocolate" Version="10.5.2" />
<PackageReference Include="HotChocolate.AspNetCore" Version="10.5.2" />
<PackageReference Include="Microsoft.Azure.WebJobs.Extensions.CosmosDB" Version="3.0.7" />
These versions are all the latest at the time of writing, but you may want to check out new versions of the packages if they are available.
And the last bit of getting started work is to bring in the proof of concept, so grab all the files from the GitHub repo and put them into a new folder under your project called FunctionsMiddleware.
Making a GraphQL Function
With the skeleton ready, it’s time to make a GraphQL endpoint in our Functions project, and to do that we’ll scaffold up a HTTP Trigger function:
func new --name GraphQL --template "HTTP trigger"
This will create a generic function for us and we’ll configure it to use the GraphQL endpoint, again we’ll use a snippet from the proof of concept:
using System.Threading;
using System.Threading.Tasks;
using Microsoft.AspNetCore.Mvc;
using Microsoft.Azure.WebJobs;
using Microsoft.Azure.WebJobs.Extensions.Http;
using Microsoft.AspNetCore.Http;
using Microsoft.Extensions.Logging;
using HotChocolate.AspNetCore;

namespace DotNet.GraphQL.CosmosDB
{
    public class GraphQL
    {
        private readonly IGraphQLFunctions _graphQLFunctions;

        public GraphQL(IGraphQLFunctions graphQLFunctions)
        {
            _graphQLFunctions = graphQLFunctions;
        }

        [FunctionName("graphql")]
        public async Task<IActionResult> Run(
            [HttpTrigger(AuthorizationLevel.Anonymous, "get", "post", Route = null)] HttpRequest req,
            ILogger log,
            CancellationToken cancellationToken)
        {
            return await _graphQLFunctions.ExecuteFunctionsQueryAsync(
                req.HttpContext,
                cancellationToken);
        }
    }
}
Something you might notice about this function is that it’s no longer a static, it has a constructor, and that constructor has an argument. To make this work we’re going to need to configure dependency injection for Functions.
Adding Dependency Injection
Let’s start by creating a new class to our project called Startup:
using Microsoft.Azure.Functions.Extensions.DependencyInjection;
using Microsoft.Extensions.DependencyInjection;

[assembly: FunctionsStartup(typeof(DotNet.GraphQL.CosmosDB.Startup))]

namespace DotNet.GraphQL.CosmosDB
{
    public class Startup : FunctionsStartup
    {
        public override void Configure(IFunctionsHostBuilder builder)
        {
        }
    }
}
There’s two things that are important to note about this code, first is that we have the [assembly: FunctionsStartup(... assembly level attribute which points to the Startup class. This tells the Function runtime that we have a class which will do some stuff when the application starts. Then we have the Startup class which inherits from FunctionsStartup. This base class comes from the Microsoft.Azure.Functions.Extensions NuGet package and works similar to the startup class in an ASP.NET Core application by giving us a method which we can work with the startup pipeline and add items to the dependency injection framework.
We’ll come back to this though, as we need to create our GraphQL schema first.
Creating the GraphQL Schema
Like our previous demos, we’ll use the trivia app.
We’ll start with the model which exists in our CosmosDB store (I’ve populated a CosmosDB instance with a dump from OpenTriviaDB, you’ll find the JSON dump here). Create a new folder called Models and then a file called QuestionModel.cs:
using System.Collections.Generic;
using Newtonsoft.Json;

namespace DotNet.GraphQL.CosmosDB.Models
{
    public class QuestionModel
    {
        public string Id { get; set; }
        public string Question { get; set; }
        [JsonProperty("correct_answer")]
        public string CorrectAnswer { get; set; }
        [JsonProperty("incorrect_answers")]
        public List<string> IncorrectAnswers { get; set; }
        public string Type { get; set; }
        public string Difficulty { get; set; }
        public string Category { get; set; }
    }
}
As far as our application is aware, this is a generic data class with no GraphQL or Cosmos specific things in it (it has some attributes for helping with serialization/deserialization), now we need to create our GraphQL schema to expose it. We’ll make a new folder called Types and a file called Query.cs:
using DotNet.GraphQL.CosmosDB.Models;
using HotChocolate.Resolvers;
using Microsoft.Azure.Documents.Client;
using Microsoft.Azure.Documents.Linq;
using System;
using System.Collections.Generic;
using System.Linq;
using System.Threading.Tasks;

namespace DotNet.GraphQL.CosmosDB.Types
{
    public class Query
    {
        public async Task<IEnumerable<QuestionModel>> GetQuestions(IResolverContext context)
        {
            // TODO
        }

        public async Task<QuestionModel> GetQuestion(IResolverContext context, string id)
        {
            // TODO
        }
    }
}
This class is again a plain C# class and Hot Chocolate will use it to get the types exposed in our query schema. We’ve created two methods on the class, one to get all questions and one to get a specific question, and it would be the equivalent GraphQL schema of:
type QuestionModel {
    id: String
    question: String
    correctAnswer: String
    incorrectAnswers: [String]
    type: String
    difficulty: String
    category: String
}

schema {
    query: {
        questions: [QuestionModel]
        question(id: String): QuestionModel
    }
}
You’ll also notice that each method takes an IResolverContext, but that’s not appearing in the schema, well that’s because it’s a special Hot Chocolate type that will give us access to the GraphQL context within the resolver function.
But, the schema has a lot of nullable properties in it and we don’t want that, so to tackle this we’ll create an ObjectType for the models we’re mapping. Create a class called QueryType:
using HotChocolate.Types;

namespace DotNet.GraphQL.CosmosDB.Types
{
    public class QueryType : ObjectType<Query>
    {
        protected override void Configure(IObjectTypeDescriptor<Query> descriptor)
        {
            descriptor.Field(q => q.GetQuestions(default!))
                .Description("Get all questions in the system")
                .Type<NonNullType<ListType<NonNullType<QuestionType>>>>();

            descriptor.Field(q => q.GetQuestion(default!, default!))
                .Description("Get a question")
                .Argument("id", d => d.Type<IdType>())
                .Type<NonNullType<QuestionType>>();
        }
    }
}
Here we’re using an IObjectTypeDescription to define some information around the fields on the Query, and the way we want the types exposed in the GraphQL schema, using the built in GraphQL type system. We’ll also do one for the QuestionModel in QuestionType:
using DotNet.GraphQL.CosmosDB.Models;
using HotChocolate.Types;

namespace DotNet.GraphQL.CosmosDB.Types
{
    public class QuestionType : ObjectType<QuestionModel>
    {
        protected override void Configure(IObjectTypeDescriptor<QuestionModel> descriptor)
        {
            descriptor.Field(q => q.Id)
                .Type<IdType>();
        }
    }
}
Consuming the GraphQL Schema
Before we implement our resolvers, let’s wire up the schema into our application, and to do that we’ll head back to Startup.cs, and register the query, along with Hot Chocolate:
public override void Configure(IFunctionsHostBuilder builder)
{
    builder.Services.AddSingleton<Query>();

    builder.Services.AddGraphQL(sp =>
        SchemaBuilder.New()
        .AddServices(sp)
        .AddQueryType<QueryType>()
        .Create()
    );
    builder.Services.AddAzureFunctionsGraphQL();
}
First off we’re registering the Query as a singleton so it can be resolved, and then we’re adding GraphQL from Hot Chocolate. With the schema registration, we’re using a callback that will actually create the schema using SchemaBuilder, registering the available services from the dependency injection container and finally adding our QueryType, so GraphQL understands the nuanced type system.
Lastly, we call an extension method provided by the proof of concept code we included early to register GraphQL support for Functions.
Implementing Resolvers
For the resolvers in the Query class, we’re going to need access to CosmosDB so that we can pull the data from there. We could go and create a CosmosDB connection and then register it in our dependency injection framework, but this won’t take advantage of the input bindings in Functions.
With Azure Functions we can setup an input binding to CosmosDB, specifically we can get a DocumentClient provided to us, which FUnctions will take care of connection client reuse and other performance concerns that we might get when we’re working in a serverless environment. And this is where the resolver context, provided by IResolverContext will come in handy, but first we’re going to modify the proof of concept a little, so we can add to the context.
We’ll start by modifying the IGraphQLFunctions interface and adding a new argument to ExecuteFunctionsQueryAsync:
Task<IActionResult> ExecuteFunctionsQueryAsync(
    HttpContext httpContext,
    IDictionary<string, object> context,
    CancellationToken cancellationToken);
This IDictionary<string, object> will allow us to provide any arbitrary additional context information to the resolvers. Now we need to update the implementation in GraphQLFunctions.cs:
public async Task<IActionResult> ExecuteFunctionsQueryAsync(
    HttpContext httpContext,
    IDictionary<string, object> context,
    CancellationToken cancellationToken)
{
    using var stream = httpContext.Request.Body;

    var requestQuery = await _requestParser
        .ReadJsonRequestAsync(stream, cancellationToken)
        .ConfigureAwait(false);

    var builder = QueryRequestBuilder.New();

    if (requestQuery.Count > 0)
    {
        var firstQuery = requestQuery[0];

        builder
            .SetQuery(firstQuery.Query)
            .SetOperation(firstQuery.OperationName)
            .SetQueryName(firstQuery.QueryName);

        foreach (var item in context)
        {
            builder.AddProperty(item.Key, item.Value);
        }

        if (firstQuery.Variables != null
            && firstQuery.Variables.Count > 0)
        {
            builder.SetVariableValues(firstQuery.Variables);
        }
    }

    var result = await Executor.ExecuteAsync(builder.Create());
    await _jsonQueryResultSerializer.SerializeAsync((IReadOnlyQueryResult)result, httpContext.Response.Body);

    return new EmptyResult();
}
There’s two things we’ve done here, first is adding that new argument so we match the signature of the interface, secondly is when the QueryRequestBuilder is being setup we’ll loop over the context dictionary and add each item as a property of the resolver context.
And lastly, we need to update the Function itself to have an input binding to CosmosDB, and then provide that to the resolvers:
[FunctionName("graphql")]
public async Task<IActionResult> Run(
    [HttpTrigger(AuthorizationLevel.Anonymous, "get", "post", Route = null)] HttpRequest req,
    ILogger log,
    [CosmosDB(
        databaseName: "trivia",
        collectionName: "questions",
        ConnectionStringSetting = "CosmosDBConnection")] DocumentClient client,
    CancellationToken cancellationToken)
{
    return await _graphQLFunctions.ExecuteFunctionsQueryAsync(
        req.HttpContext,
        new Dictionary<string, object> {
            { "client", client },
            { "log", log }
        },
        cancellationToken);
}
With that sorted we can implement our resolvers. Let’s start with the GetQuestions one to grab all of the questions from CosmosDB:
public async Task<IEnumerable<QuestionModel>> GetQuestions(IResolverContext context)
{
    var client = (DocumentClient)context.ContextData["client"];

    var collectionUri = UriFactory.CreateDocumentCollectionUri("trivia", "questions");
    var query = client.CreateDocumentQuery<QuestionModel>(collectionUri)
        .AsDocumentQuery();

    var quizzes = new List<QuestionModel>();

    while (query.HasMoreResults)
    {
        foreach (var result in await query.ExecuteNextAsync<QuestionModel>())
        {
            quizzes.Add(result);
        }
    }

    return quizzes;
}
Using the IResolverContext we can access the ContextData which is a dictionary containing the properties that we’ve injected, one being the DocumentClient. From here we create a query against CosmosDB using CreateDocumentQuery and then iterate over the result set, pushing it into a collection that is returned.
To get a single question we can implement the GetQuestion resolver:
public async Task<QuestionModel> GetQuestion(IResolverContext context, string id)
{
    var client = (DocumentClient)context.ContextData["client"];

    var collectionUri = UriFactory.CreateDocumentCollectionUri("trivia", "questions");
    var sql = new SqlQuerySpec("SELECT * FROM c WHERE c.id = @id");
    sql.Parameters.Add(new SqlParameter("@id", id));
    var query = client.CreateDocumentQuery<QuestionModel>(collectionUri, sql, new FeedOptions { EnableCrossPartitionQuery = true })
        .AsDocumentQuery();

    while (query.HasMoreResults)
    {
        foreach (var result in await query.ExecuteNextAsync<QuestionModel>())
        {
            return result;
        }
    }

    throw new ArgumentException("ID does not match a question in the database");
}
This time we are creating a SqlQuerySpec to do a parameterised query for the item that matches with the provided ID. One other difference is that I needed to enable CrossPartitionQueries in the FeedOptions, because the id field is not the partitionKey, so you may not need that, depending on your CosmosDB schema design. And eventually, once the query completes we look for the first item, and if none exists raise an exception that’ll bubble out as an error from GraphQL.
Conclusion
With all this done, we now have a our GraphQL server running in Azure Functions and connected up to a CosmosDB backend, in which we have no need to do any connection management ourselves, that’s taken care of by the input binding.
You’ll find the full code of my sample on GitHub.
While this has been a read-only example, you could expand this out to support GraphQL mutations and write data to CosmosDB with a few more resolvers.
Something else that would be worth for you to explore is how you can look at the fields being selected in the query, and only retrieve that data from CosmosDB, because here we’re pulling all fields, but if you create a query like:
{
    questions {
        id
        question
        correctAnswer
        incorrectAnswers
    }
}
It might be optimal to not return fields like type or category from CosmosDB.
by Scott Muniz | Sep 8, 2020 | Azure, Technology, Uncategorized
This article is contributed. See the original author and article here.
Final Update: Wednesday, 09 September 2020 00:17 UTC
We’ve confirmed that all systems are back to normal with no customer impact as of 09/08, 23:40 UTC. Our logs show the incident started on 09/08, 22:20 UTC and that during the 1 hour and 20 minutes that it took to resolve the issue small number of customers in the Switzerland North Region experienced intermittent metric data latency and data gaps, as well as incorrect metric alert activation.
- Root Cause: The failure was due to issue with one of the backend services.
- Incident Timeline: 1 Hours & 20 minutes – 09/08, 22:20 UTC through 09/08, 23:40 UTC
We understand that customers rely on Application Insights as a critical service and apologize for any impact this incident caused.
-Jayadev
by Scott Muniz | Sep 8, 2020 | Azure, Technology, Uncategorized
This article is contributed. See the original author and article here.
This installment is part of a broader series to keep you up to date with the latest features in Azure Sentinel. The installments will be bite-sized to enable you to easily digest the new content.
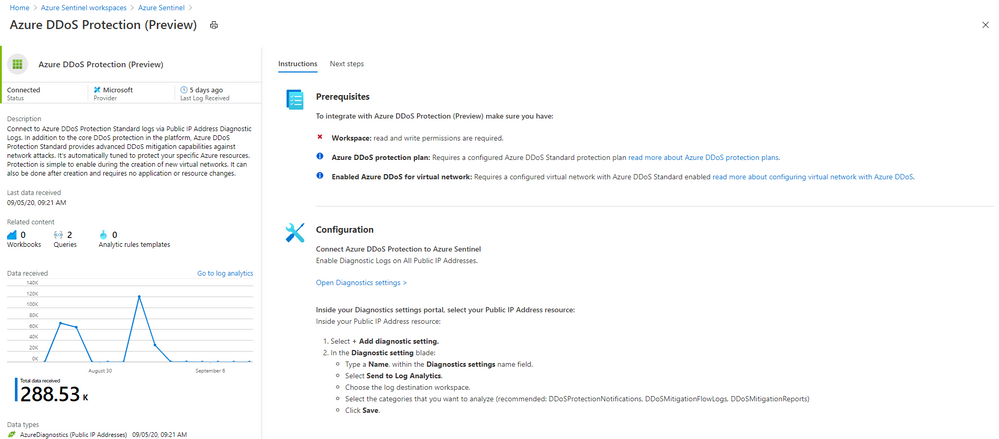
Even more Azure Sentinel connector news for you! If you are using Azure DDoS Standard Protection, you can now ingest this via our connector into your Azure Sentinel workspace.
In addition to the core DDoS protection in the Azure platform, Azure DDoS Protection Standard provides advanced DDoS mitigation capabilities against network attacks. It’s automatically tuned to protect your specific Azure resources. Protection is simple to enable during the creation of new virtual networks. It can also be done after creation and requires no application or resource changes.
Connecting Azure DDoS Protection Standard logs to Azure Sentinel enables you to view and analyze this data in your workbooks, query it to create custom alerts, and incorporate it to improve your investigation process, giving you more insight into your platform security.

How to enable Azure DDoS Protection log ingestion in Azure Sentinel
Prerequisite – You must have a configured Azure DDoS Standard protection plan.
1. From the Azure Sentinel navigation menu, select Data connectors.

2. Select Azure DDoS Protection from the data connectors gallery, and then select Open Connector Page on the preview pane.
3. Enable Diagnostic logs on all the firewalls whose logs you wish to connect:
a. Select the Open Diagnostics settings > link and choose a Public IP Address resource from the list.


b. Select + Add diagnostic setting.

c. In the Diagnostics settings screen
- Enter a name in the Diagnostic setting name field.
- Mark the Send to Log Analytics check box. Two new fields will be displayed below it. Choose the relevant Subscription and Log Analytics Workspace (where Azure Sentinel resides).
- Mark the check boxes of the rule types whose logs you want to ingest. We recommend DDoSProtectionNotifications, DDoSMitigationFlowLogs, and DDoSMitigationReports.

d. Click Save at the top of the screen. Repeat this process for any additional firewalls (public IP addresses) for which you have enabled DDoS protection.
4. To use the relevant schema in Log Analytics for Azure DDoS Protection alerts, search for AzureDiagnostics. Here’s an example query below:
AzureDiagnostics
| where ResourceType == "PUBLICIPADDRESSES"
| sort by TimeGenerated
And that’s it! You will now have Azure DDoS Standard logs connected to your Sentinel workspace.
Get Started Today!
Try out the new connector and let us know your feedback using any of the channels listed in the Resources.
You can also contribute new connectors, workbooks, analytics and more in Azure Sentinel. Get started now by joining the Azure Sentinel Threat Hunters GitHub community and follow the guidance.

Recent Comments