This article is contributed. See the original author and article here.
Our experience shows that cloud technology, and the architecture used to create solutions can have a substantial impact on human lives. Positive human experiences can encourage broader adoption of products, services, or ideas, and from a change management perspective can help individuals, teams, and organizations achieve lasting change. To positively affect lives, solution architects, sponsors, and stakeholders need to do their part by help transform the experiences of those interacting/transacting with their organization by designing adaptable, end-to-end data and analytics solutions. Architectures that have shown good results for our clients are based on these architectural styles (big data, event-driven, microservices).
Let’s start by looking at some of the architectural components and layers of an enterprise architecture.
Architectural Components
The major architectural components of any system are the software and the hardware. All software systems can be divided into four basic functions. These four functions (data storage, data access logic, application logic, and presentation logic) are the basic building blocks of any information system. The three primary hardware components of a system are client computers, servers, and the network that connects them.
System Analysis and Design, Fifth Edition by Roberta M. Roth; Barbara Haley Wixom; Alan Dennis Published by Wiley, 2012
When the storage, compute, network, database, web app, analytics, and AI and Machine Learning components are on the Azure data and analytics platform great things are possible. Here are some Enterprise Architecture diagrams that focus on the layers that make up a solution architecture.
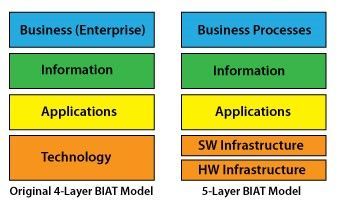
Enterprise Architecture (EA) Layers

Conventional BIAT Diagram and the 5-Layer BIAT Diagram
http://eitbokwiki.org/Enterprise_Architecture
This post uses the term data vs information because in the world of Data & AI the industry terms are more data centric: Big Data, Data Engineer, Data Science, Data Analyst, Data Warehouse, Data Mart, Data Model, Datastore, Database, Data Visualization, Data Wrangling, Data Mining, Data Lake, DataFrame, Change Data Capture, and Master Data. This is a lot of information, but it is all data! Combining the two references above you might end up with a diagram that looks like this:

Darwin’s munging (in a data wrangling kind of way) of EA layers and Architectural Components
Real-life scenario
For a real-life scenario to test some of this out, let’s use moving stuff (furniture, boxes, lamps, rugs, chairs tables) from one place to another (warehouse, house, apartment, office). To do this most people either hire a moving company, or if you like to be hands-on, do-it-yourself and rent a trailer or truck. Renting moving equipment is a very complex logistics business process. The moving equipment rental business process has many actors (users of the system) that are human users, and there is little control over the human users involved in the system (customer might not take the truck or trailer back in time, extend their rental, or return equipment to a location that has no demand for the being rented the next day); thus the need to check for human errors, contain bias, expedite last minute changes, and have the privileges setup to reduce any harm to the parties involved. It is real life, tough to automate, and kind of out of control. Such a process to far less controlled than fulfilling an online order from a online retailers warehouse to your house. Throw in Covid-19, with requirements to clean equipment, wear masks, and social distance and you have potential for some chaos! For example, no more paper rental agreement which probably changes the process.
Recommended solution architecture to approach and organize the chaos
What are some of the things to consider when building a data and analytics solution that works for the real-life scenario described? Using a Cloud-based Data, AI/ML, Modern Data Management, and Modern Application focused approach the design of an End-to-End (E2E) solution might use and combine these capabilities:
- OLTP (Online Transactional Processing) to create, read, update, and delete (CRUD stuff) the transactions in an operational RDBMS (Relational Database Management System) like Azure SQL Database
- NoSQL database like Azure Cosmos DB as the cloud-native operational database to store the data that is better stored in document databases (rental contract, attributes and preferences of the customers and dealers, and profiles of the rental equipment)
- Event-driven architecture to capture all the interactions between the human to human and device actors (emails, texts, social media tweets and Instagram posts, near real-time IoT telemetry data streaming from the fleet of trucks and trailers). Capture events using Azure Event Hub, Azure IoT Hub, Apache Kafka and perform complex event processing using Azure Stream Analytics. Much of this human created data comes from the endless mobile devices that the customers (drivers) use during the lifecycle from reservation – to pick up location – to return location. This also can include SOA/ESB driven application integration via APIs and messaging. This information could be landed in storage, in relational or NoSQL databases, or use Azure Data Explorer – a fast, fully managed data analytics service for real-time analysis on large volumes of data streaming from applications, websites, IoT devices, and more.
- Data Lake storage and Big Data analytical processing like Azure Databricks (Spark) and data integration tools like Azure Data Factory for combining data from the OLTP and operational systems as well as near real-time data streaming from fleet IoT device telemetry in trucks and trailers, from emails, from texts, from chats with chatbots, or from tweets. Change Data Capture, transactional replication and other data movement technologies need consideration here as well.
- Analytical data stores to create modern data warehouses like Azure Synapse Analytics. In fact Azure Synapse Analytics combines all of the capabilities in the first 4 items above and can be used to create HTAP (hybrid transactional and analytical processing) systems using offerings like Azure Synapse Link for Azure Cosmos DB.
- Business Intelligence analysis and data visualizations using Power BI. It is amazing what can be done with Cloud-based BI. The connectivity, capabilities, scalability, security, performance, and affordability make getting started easy.
- AI and Machine Learning like Azure Cognitive Services to process images like the pictures on drivers’ licenses, automating forms, predicting customer sentiment in texts, as well as tools like Azure Machine Learning for data scientists to build and deploy models to suggest next best offers to customers that have similar profiles, or to predict the need for additional insurance coverage or fraudulent activities. Maybe even predict who is having a bad experience and needs a call of support.
- Cloud Native Applications using microservices, serverless, and containers like Docker and container orchestration services like Kubernetes —optimized for cloud scale and performance. Apps built using programming languages like JavaScript and TypeScript, frameworks like React and Angular, and runtime environments like Node.js. With AI and machine learning built in.
Note: You will have some of the capabilities and technologies already in place, so this is an integration-based solution that often extends what you already have. You will want to migrate some of the applications and data sources to Azure, but the data and analytics components (stuff in land, stage, warehouse, information delivery, BI, AI and ML, and applications) are definitely best up on Azure.

Darwin’s end-to-end cloud solution architecture diagram
The diagram above currently excludes Master Data Management (MDM), Data Governance, Data Catalogs, and probably missed something. This post is already broad and complex. This complexity brings all these currently excluded capabilities to a greater level of importance but let’s leave that for another day.
Some of the inspiration for this post comes from the Data Vault methodology. Solutions I have created during the last 25 years used Land, Stage, and Publish tables and schema along with association tables to associate source system keys with surrogate keys. Information delivery was through star schema accessed by BI tools like Power BI. I considered my approach as Kimball-based but in many ways it was actually pretty aligned with the Data Vault methodology, which IMO is a nice blend of the Ralph Kimball and the Bill Inmon approaches to data warehousing. Below is a diagram of the Data Vault architecture.

Building a Scalable Data Warehouse with Data Vault 2.0 by Dan Linstedt and Michael Olschimke
I also found this illustration helpful from the eBook Data Warehouse Automation in Azure for Dummies by Matthew Basile, Clive Bearman, Rajeev Jain, and Kevin Pardue

So, to wrap up and test my real-life scenario, would this architecture improve the experience of someone renting moving equipment? In my opinion as both a solution architect and a consumer, a definitive yes! There are systems, people, and processes in place, but there are things to consider extending to improve the human experience. For example, if the people and processes change the pickup and drop off locations with the customer at too great a frequency; something has to report, predict the negative experience, and then the system, people, and processes have to adopt to prevent the occurrence of such negative experiences. It is the interactions that happen around the transactions that often determine the experience.
There is no immutable master plan for this type of architecture, and you need to get started to realize any of it. You have probably already started, but is something missing that this post helped surface? Start small with a business problem and combine some operational structured data sources and some streaming data sources needed to solve the problem; create some reports in Power BI, and build and deploy ML models to embed into a Power Apps or custom Apps so users can use them. Use Agile and DevOps and iterate on the solution, and then use what you learned and do more projects. Hopefully this post has provided some insights, but it is a journey that requires a growth mindset for the entire organization at the individual, team, and corporate level. Whether you categorize yourself as a consumer, architect, developer, designer, engineer, employee, student, teacher, line of business manager, administrator, or executive; hopefully you are inspired to take that next step in your journey. If you have an idea you would like to discuss, please call, email, or comment. Would love to help turn your vision into reality and help you embrace and harness the chaos in your organization.
Hope you enjoy your summer whether relaxing or productive (does not need to be house painting, could be camping or time at the lake house)!
Stay Safe,
Darwin
Brought to you by Dr. Ware, Microsoft Office 365 Silver Partner, Charleston SC.

Recent Comments