This article is contributed. See the original author and article here.
One of the most requested features in Azure Monitor Logs is the ability to track the queries being executed in the system. Recently, we released to public preview the capability to meet all of these needs: the Query Audit Logs for Azure Log Analytics!
A rich dataset to monitor your Workspace
The feature was designed to answer questions around the areas of compliance, security, and performance of queries in the system.
The dataset that you will see once you enable the collection of the Query Audit Logs will include full information about each query executed. This includes information that will help you identify who ran the query, what application was used to run the query, and for successful queries, a full set of performance counters. The rich dataset will let you answer a wide variety of questions: from detecting malicious attempts to access sensitive data, to identifying queries that are particularly inefficient, and even detecting broken automation through consistently-failing queries
Collecting query audit logs is simple
Full details about how to enable and use the feature are available on our documentation page here.
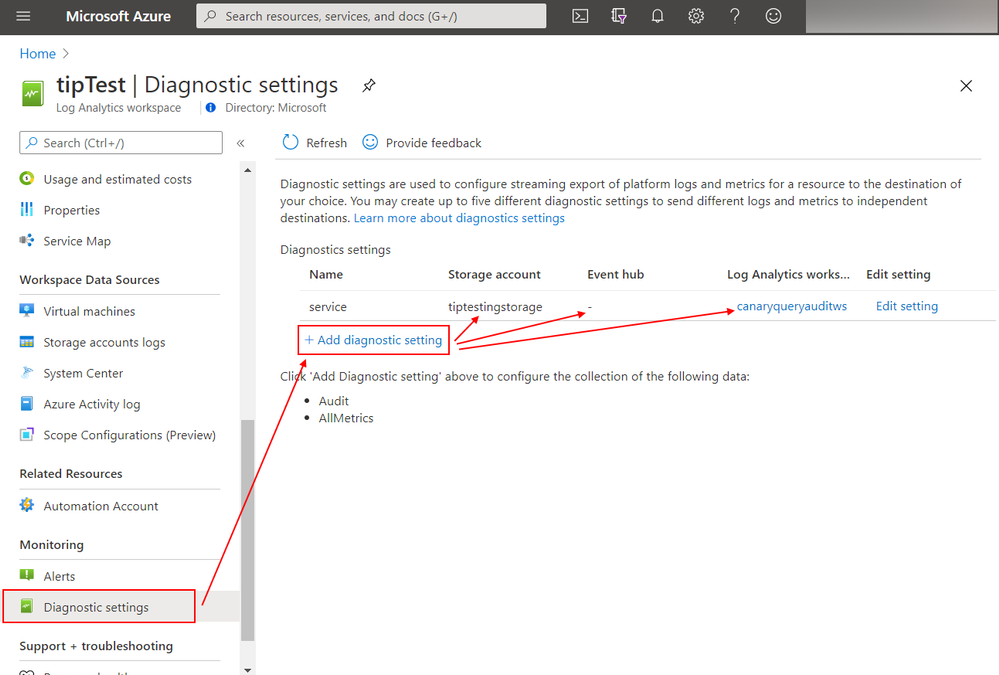
Enabling the collection of the query logs is simple – just open the workspace that you want to start tracking logs for, go to the diagnostic settings, and enable the collection of the query logs into any combination of a Storage Blob, Event Hub, and/or (of course!) Azure Monitor Logs.

If you prefer to use a programmatic approach, be it through an ARM template or Azure Policy, we provide full support for such an approach. You’ll find an example of an ARM template you can use here.
Answering a wide array of questions
So what can you do with these query logs once you enable them? Below are just a few examples.
You can see the number of queries each user in the system ran:

The response codes for these queries, useful for detection of failed logins (403s), or broken automation (409s):

And a list of the users most advanced in their knowledge of KQL, judged by the length of query they write:

While these are just a few examples to showcase the capabilities of these logs, many more questions can be answered – give it a go and see what insights you can come up with!
Next Steps
Enable the collection of the Query Audit Logs in Azure Monitor Logs today, and start getting visibility into how your Workspace is being used. Please do let us know of any questions or feedback you have around the feature – we’re excited to see the creative ways in which these get used!
Brought to you by Dr. Ware, Microsoft Office 365 Silver Partner, Charleston SC.

Recent Comments