This article is contributed. See the original author and article here.
Introduction
A common ask from enterprise customers is the ability to monitor for the creation of Azure Subscriptions. This is not as easy as you might think so I wanted to walk you through a solution I’ve used to accomplish this. Below we will walk through creating an Azure Logic App that runs on a schedule and inserts the current subscriptions into Log Analytics. Once we have the data in Log Analytics we can either visualize new subscriptions or alert on them.
Step 1: Create a Service Principal
Our Logic App will utilize a Service Principal to query for the existing subscriptions. For this solution to work as intended you need to create a new Service Principal and then give them at least “Read” rights at your root Management Group.
If you’ve never created a service principal, you can follow this article:
You’ll need the following information from the service principal:
- Application (client) id
- Tenant id
- Secret
Once the service principal has been created you need to give it reader rights at the Management Group level.
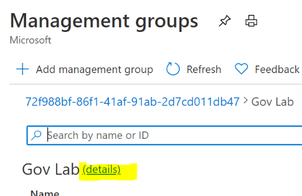
Open the “Management Group” blade in the Azure portal. From the root Management Group click on the (details) link.
Click on “Access Control” | “Add” | “Add role assignment”

Grant the Service Principal the “Reader” role.

Step 2: Create the Logic App
In the Logic App blade click on “Add”

Fill in the required fields and create the Logic App.

In the Logic App Designer choose the “Recurrence” template.

Configure the interval that you want to query for subscriptions. I chose to query every hour below. Then click on the “New step” button:

Search for “azure resource manager” and choose the “List subscriptions (preview)” action.

You want to connect with a service principal.

Fill in the information for your service principal (the “Connection Name” is just a display name):

Note that this action doesn’t require any configuration besides setting up the connection. After configuring the service principal click on “New Step” and search for “Azure Log Analytics.” Choose the “Send Data (preview)” action.

Connect to the Log Analytics workspace that you want to send the data to. You can get the workspace id and key within the Log Analytics blade in Azure:

Once the connection is made to the Log Analytics Workspace you need to configure the connector:
- JSON Request Body: click in the box and then choose “Item” from the dynamic content

- Custom Log Name: Name of the log to be created in Log Analytics. Below I chose SubscriptionInventory

Note that when you choose “Item” it will put the “Send Data” action into a loop.
We can go ahead and save the Logic App and optionally run it to test the insertion of data into Log Analytics.
Step 3: Wait
This Logic App will need to run for a while before the data is useful. You can verify that the Logic App runs every hour and view the raw data in Log Analytics to verify everything is working.
Below is an example of viewing the table “SubscirptionInventory_CL” in Log Analytics

Step 4: Setting up Alerts
We will setup an alert for Subscriptions created in the last 4 hours.
Below is the Kusto query we can use to find the subscriptions created in the last 4 hours:
SubscriptionInventory_CL
| summarize arg_min(TimeGenerated, *) by SubscriptionId
| where TimeGenerated >= ago(4h)
| project TimeGenerated, displayName_s, state_s, SubscriptionId
The key to this query is using the arg_min to get the first time we see the subscription added to log analytics. When we setup the alert we will look back a couple days and get the first occurrence of the subscription and then if the first occurrence is within the last 4 hours create an alert.
Now we are ready to create the alert within Azure Monitor. Open your Log Analytics Workspace and go to the Logs tab. Run the above query in Log Analytics and then click on “New alert rule”

**Note: I find this easier than going through Azure Monitor to create the alert because this selects your workspace and puts the correct query in the alert configuration.
You’ll see a red exclamation point next to the condition. Click on the condition to finish configuring the alert. Below are the parts you need to configure highlighted.

Now you just finish creating the alert. If you’ve never created an Azure Monitor Alert here is documentation to help you finish the process.
Create, view, and manage log alerts Using Azure Monitor – Azure Monitor | Microsoft Docs
**Note: Make sure you let the Logic App run for longer than the period you’re alerting on. In this example I’d need to let my Logic App run for at least 5 hours (4 hours is the alert threshold + 1 hour). The query relies on the history so if I run this before my Logic App has run long enough then it will trigger saying every subscription.
Step 5: Visualizing through Workbooks
We can utilize a simple Azure Workbook to visualize the data in Log Analytics. The below workbook has the following parameters:
- Created Since: set this to show all the subscriptions created since this date
- Subscription: Filter down to the subscription that has the Log Analytics Workspace with the data
- LA Workspace: Select the Log Analytics workspace that you’re Logic App is putting data into
**Note: This workbook is assuming that the table name that your using is SubscriptionInventory_CL. If you’re using a different table name then you’ll need to modify the queries in the workbook.
Once you fill in the parameters there will be a simple table showing the day we detected the subscription, the display name, the state and the subscription id.

Open the Azure Monitor blade and go to the Workbook tab. Click on “New”

Click on the “Advanced Editor”

Replace the content from the following link:
https://raw.githubusercontent.com/bwatts64/Downloads/master/New_Subscriptions
Click on Apply:

You can now verify that you’re able to visualize the data in Log Analytics. Once you’ve verified that click on “Save” to save the newly created workbook.

Summary
Monitoring new subscription creating in your Azure Tenant is a common ask by customers. Here we have utilized a Logic App to insert our subscription data into Log Analytics. From there we can both alert and visualize new subscriptions that are created in your environment.
Brought to you by Dr. Ware, Microsoft Office 365 Silver Partner, Charleston SC.

Recent Comments