This article is contributed. See the original author and article here.
In 2020 Kubernetes only marked its sixth birthday, but in that time its usage has grown exponentially and it is now considered a core part of many organization’s application platforms. The flexibility and scalability of containerized environments makes deploying applications as microservices in containers very attractive and Kubernetes has emerged as the orchestrator of choice for many. Azure offers Azure Kubernetes Service (AKS) where your Kubernetes cluster is managed and integrated into the platform. In this blog we are going to look at how you can use Azure Sentinel to monitor your AKS clusters for security incidents.
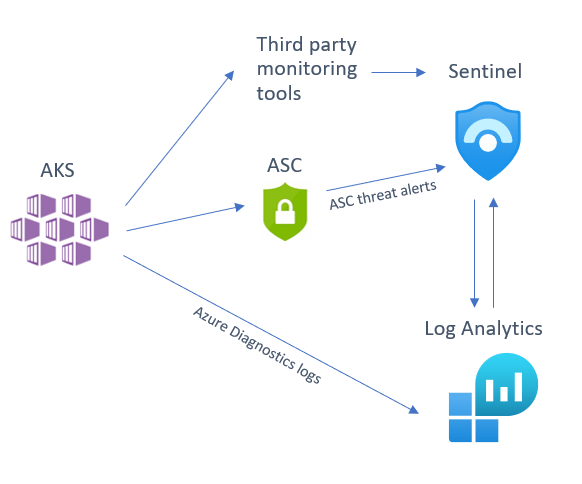
Overview
There are several sources that you can use to help monitor your AKS cluster, of which you can deploy one or several in tandem depending on your environment and the security posture of your organization. We will be looking at the following detection sources that you can integrate into Sentinel:
- Azure Security Center (ASC) AKS threat protection
- Azure Diagnostics logs
- Third party tool alert integration
Below is a diagram illustrating how these different sources integrate into Azure Sentinel:

Before we dive into each of these sources, I want to mention an excellent piece of work created by my colleague Yossi Weizman where he created a threat matrix for Kubernetes clusters, aligned to the MITRE ATT&CK framework. You can read his full article here but we will refer to this threat matrix when assessing whether you have considered if this scenario is applicable to your AKS implementation, and if it is, how you can get visibility of this happening in your environment.

Azure Security Center (ASC) AKS threat protection
Azure Security Center Standard has threat protection built-in for the resources that it monitors. ASC has an optional Kubernetes bundle that you can enable, and ASC threat protection will look at your AKS cluster for signs of suspicious activity. To enable the AKS bundle in ASC, go to “Pricing & settings”, select the subscription and make sure the “Kubernetes” resource type is enabled, as per the below:

(The ASC Kubernetes bundle also provides security configuration and hardening recommendations for your AKS cluster, but that is outside the scope of this blog post. You can read more about this here.)
If you have already connected ASC threat alerts to your Azure Sentinel workspace via the native ASC connector these AKS threat alerts will also be sent directly into Azure Sentinel. Some of the threats that ASC can detect in your AKS cluster are below:
- Container with a sensitive volume mount detected
- Digital currency mining container detected
- Exposed Kubernetes dashboard detected
For an up-to-date list of ASC AKS-specific detections, please go here.
To turn on Kubernetes in Azure Security Center, go to ASC Pricing & Settings, in the Select pricing tier by resource type, you need to Enable Kubernetes and Container Registries.
Azure Diagnostics logs
If you have use cases not covered by ASC threat detections, you can also turn on AKS diagnostic logs and send to a Log Analytics workspace (you may notice that some documents referenced here refer to Azure Monitor. Note that Log Analytics is part of the larger Azure Monitor platform.) Follow the steps found here to enable resource logging. The logs that can be retrieved from AKS in this manner include:
- kube-apiserver
- kube-controller-manager
- kube-scheduler
- kube-audit
- cluster-autoscaler
After you have enabled the logging to be sent your Log Analytics workspace, you can start to run detections on these logs. These logs will be sent to the AzureDiagnostics table.
Let’s look at a basic query you can on these logs in Sentinel to look at (in this case) an NGINX pod:
AzureDiagnostics
| where Category == "kube-apiserver"
| where log_s contains "pods/nginx"
| project log_s
Now let’s look at some more security-focused queries that you can run on AKS logs. Note that we are using the threat matrix mentioned earlier in this blog as a guide for the manner of detections one may require on an AKS cluster:
# query for cluster-admin clusterrolebinding + extend columns
# detects: kubectl create clusterrolebinding my-svc-acct-admin --clusterrole=cluster-admin --serviceaccount=brianredmond

AzureDiagnostics
| where Category == "kube-audit"
| where parse_json(log_s).verb == "create"
| where parse_json(tostring(parse_json(tostring(parse_json(log_s).requestObject)).roleRef)).name == "cluster-admin"
| where parse_json(tostring(parse_json(log_s).requestObject)).kind == "ClusterRoleBinding"
| extend k8skind = parse_json(tostring(parse_json(log_s).requestObject)).kind
| extend k8sroleref = parse_json(tostring(parse_json(tostring(parse_json(log_s).requestObject)).roleRef)).name
| extend k8suser = parse_json(tostring(parse_json(log_s).user)).username
| extend k8sipaddress = parse_json(tostring(parse_json(log_s).sourceIPs))[0]
# query for CronJob creation

AzureDiagnostics
| where Category == "kube-audit"
| where parse_json(log_s).verb == "create"
| where parse_json(tostring(parse_json(log_s).requestObject)).kind == "CronJob"
# query for actions from standard user account (az aks get-credentials)

AzureDiagnostics
| where Category == "kube-audit"
| project log_s
| where parse_json(tostring(parse_json(log_s).user)).username == "masterclient"
# query for specific source IP

AzureDiagnostics
| where Category == "kube-audit"
| project log_s
| where parse_json(tostring(parse_json(log_s).sourceIPs))[0] == "192.168.1.1"
# query for RBAC result (allow, deny, etc.)

AzureDiagnostics
| where Category == "kube-audit"
| project log_s
| where parse_json(log_s).verb == "create"
| where parse_json(tostring(parse_json(log_s).annotations)).["authorization.k8s.io/decision"] == "allow"
# query for Azure RBAC AKS role assignment

AzureActivity
| where OperationName == "Create role assignment"
| extend RoleDef = tostring(parse_json(tostring(parse_json(tostring(parse_json(Properties).requestbody)).Properties)).RoleDefinitionId)
| extend  Caller = tostring(parse_json(tostring(parse_json(tostring(parse_json(Properties).requestbody)).Properties)).Caller)
| where RoleDef contains "8e3af657-a8ff-443c-a75c-2fe8c4bcb635" or RoleDef contains "b24988ac-6180-42a0-ab88-20f7382dd24c"
| extend AccountCustomEntity = Caller
| extend IPCustomEntity = CallerIpAddress
| extend URLCustomEntity = HTTPRequest
| extend HostCustomEntity = ResourceId
Of course, this is just a start – there are many more AKS detections you could create with these logs that will be specific to your organization’s use cases and environment.
Third party tools
If you are using a third-party Kubernetes monitoring tool, this can also be integrated into Sentinel. At the time of writing, we already have a native connector for Alcide kAudit, but look for more native integrations to come in the future!
Remember, if you are using a third party tool that does not yet have a native connector in Sentinel, you can still integrate the logs using a custom connector. For example, Twistlock offers a number of ways to pull the audit events from the product itself.
Summary
Sentinel offers many options for monitoring AKS clusters, so we recommend that you look at your organization’s environment and the tools you have available to decide on a strategy that works best for you. Do you have some AKS-specific detections, Workbooks or something else to share? Please contribute to our GitHub repo here and share with the community!
With thanks to @GeorgeWilburn for his AKS queries and @Nicholas DiCola (SECURITY JEDI) and @Chi Nguyen for their comments and feedback on this article.
Brought to you by Dr. Ware, Microsoft Office 365 Silver Partner, Charleston SC.

Recent Comments