This article is contributed. See the original author and article here.
Setting up Telegraf, InfluxDB and Grafana using Azure CycleCloud
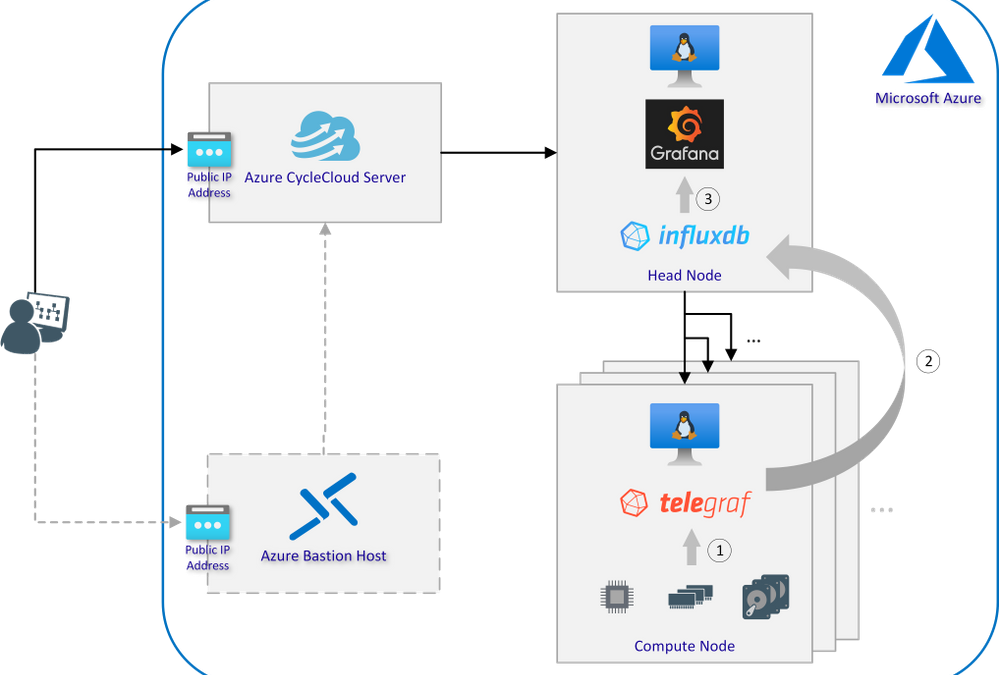
Architecture Overview

Interaction of Telegraf, InfluxDB and Grafana:
- Telegraf is a plugin-driven server agent for collecting and reporting system metrics and events
- InfluxDB is an open source time series database designed to handle high write and query loads and used to store the data from all compute nodes collected by Telegraf
- Using Grafana to turn metrics into graphs based on time-series data stored in InfluxDB
Prerequisites
- Azure account with an active subscription
- Azure CycleCloud instance which can be set up as described here
- Working CentOS or Ubuntu base image to deploy clusters with Azure CycleCloud
- Optional: Azure Bastion host configured to access the subnet in which the cluster will be deployed
Step-by-Step Installation Guide
- Connect to your Azure CycleCloud server via SSH (if necessary through the Bastion host)
- Use git to clone the aztig GitHub repository or download it from the website and extract it in a folder of your choice:
sudo yum install -y git git clone https://github.com/andygeorgi/aztig.git - Create a new CycleCloud project using the CycleCloud CLI:
cyclecloud project init cc-aztigYou will be prompted to enter the name of a locker. Press Enter to display a list of all valid Lockers and select one:
Project 'cc-aztig' initialized in … Default locker: Valid lockers: MS Azure-storage Default locker: MS Azure-storage - Link or copy the init scripts from the cloned GitHub repository to the project folder:
ln -s $(pwd)/aztig/specs/master cc-aztig/specs/master ln -s $(pwd)/aztig/specs/execute cc-aztig/specs/execute - Edit the configuration files for both node types and add a password for InfluxDB:
cat cc-aztig/specs/master/cluster-init/files/config/aztig.conf INFLUXDB_USER="admin" INFLUXDB_PWD="<INSERTPW>" GRAFANA_SHARED=/mnt/exports/shared/scratch cat cc-aztig/specs/execute/cluster-init/files/config/aztig.conf INFLUXDB_USER="admin" INFLUXDB_PWD="<INSERTPW>" GRAFANA_SHARED=/mnt/exports/shared/scratchMake sure that the parameters in both files are exactly the same!
- Switch to the CycleCloud project folder and upload it to the specified locker:
cd cc-aztig/ cyclecloud project upload Uploading to az://rgdemogpv2/cyclecloud/projects/cc-aztig/1.0.0 (100%) Uploading to az://rgdemogpv2/cyclecloud/projects/cc-aztig/blobs (100%) Upload complete! - Navigate to the CycleCloud web portal and create a new cluster (see “Software Versions Tested” for tested and working templates)
- In the advanced settings select the master folder for the head node and the execute folder for all nodes to be monitored:
-
Start the cluster and use SSH port forwarding to access Grafana on the head node without exposing the ports to the public Internet:
ssh -A -l azureuser -L 8080:<PRIVATE-HEAD-NODE-IP>:3000 -N <PUBLIC-CC-IP>Insert the private IP of your head node and the IP of the jump host (e.g. CycleCloud server or Bastion host)
- Login to Grafana by opening http://localhost:8080 and follow the steps for the first log in attempt from the Grafana documentation
- After setting your password, verify that the aztig data-source is working correctly:
-
Finally import the Telegraf system dashboard which is included into the GitHub repository:
- After successful import you should be redirected to the dashboard, where all collected metrics are displayed:
Note that an error is displayed if no data is available in InfluxDB. It will disappear as soon as first data comes in.


Customisation, Debugging and Optimisation
- By default the head node is observed as well. To remove it from the list of monitored nodes the init script for the client can be deleted from the master folder:
cc-aztig/specs/master/cluster-init/scripts/011-aztig-client.sh - Data collection can represent a significant overhead, depending on how many metrics and nodes need to be monitored. Therefore, it is highly recommended to adapt the telegraph configuration to the specific needs:
cc-aztig/specs/execute/cluster-init/files/config/telegraf.conf - In case of connection problems between Telegraf and InfluxDB check the firewall settings. By default InfluxDB listens on port 8086. Some example rules are already included in the master init script and can be commented out/adopted if necessary.
cc-aztig/specs/master/cluster-init/scripts/010-aztig-server.sh - Instead of manually selecting the init scripts in the GUI, CycleCloud also offers the ability to create customised cluster templates that include the scripts by default. Follow the instructions in the CycleCloud documentation to set the parameters accordingly.
Software Versions Tested
| Azure CycleCloud | 7.9.5 |
| cyclecloud-slurm | 2.1.1 |
| cyclecloud-pbspro | 1.3.7 |
| Cycle CentOS | 7.6.1810 |
| Cycle Ubuntu | 18.04.4 |
| Grafana | 7.1.1 |
| InfluxDB | 1.8.1 |
| Telegraf | 1.15.1 |
Brought to you by Dr. Ware, Microsoft Office 365 Silver Partner, Charleston SC.

Recent Comments