This article is contributed. See the original author and article here.
Hello,
My name is Jeffrey Worline, and I am a Senior Support Escalation Engineer on the Windows Performance Team at Microsoft. This blog addresses troubleshooting leaks occurring in a process to include identifying and data collection. This article assumes that you have already identified the process that is leaking. If you have not yet been able to identify where your leak is, please see my blog: MYSTERY MEMORY LEAK: WHERE DID MY MEMORY GO!
First thing we need to determine is memory consumption being caused by private data, heap data or some other memory type. We need to address the memory types differently.
- Download a Windows Sysinternals tool called VMMap
VMMap is an utility application analyzing virtual and physical memory. It shows a breakdown of a process’s committed virtual memory types as well as the amount of physical memory (working set) assigned by the operating system to those types.
This tool is used to attach to an individual process allowing a snapshot to be taken to see the memory map for that process.
- Simply launch VMMap and from the process list it displays, pick the instance showing the high private working set.
If the high memory is being caused by Heap, you will need to enable User Stack Tracking (UST) against the process using gflags.exe which is part of the Debugging Tools for Windows.
Note: If the high memory shows as Private Data or some other type other than heap, simply continue with getting procdump when memory usage is high.
Scenario A: Uniquely named process with high memory by Heap
- Download Debugging Tools for Windows
Just need the standalone version since we only need the debugging tool and not the whole WDK package.
Note: If the high memory shows as Private Data or some other type other than heap, simply continue with getting procdump when memory usage is high.
Disclaimer: The intent of this blog is not to teach you how to debug. If you are not familiar with debugging process dumps, please open a case with Microsoft support for assistance.
- Go to the directory where you installed the tool and you will find gflags.exe as one of the files, right-click on it and select “Run as administrator.”
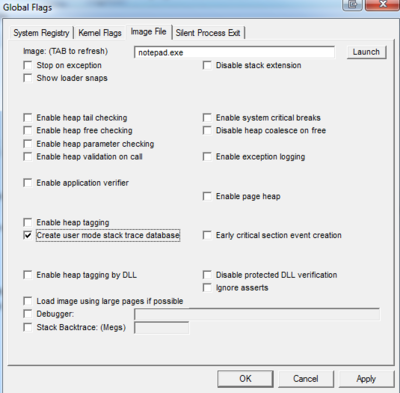
- Click on “Image File” tab.
- Type in the process name, for example notepad.exe

- Hit the keyboard TAB key to refresh
- Place check mark in “Create user mode stack trace database.”
Note: Be sure to reverse your gflag setting also by unchecking the “Create user mode stack trace database” when no longer needed.
- Click “OK”.
- The process or service will need to be restarted to put in to effect.
- Get procdump of process when memory is high.
Scenario B: High memory occurring in svchost.exe process by Heap
If the svchost process contains more than one service, you will need to break each service out to run in its own svchost process to determine which service is causing the high memory. Once that has been determined, then need to uniquely name that svchost process the service runs in and then enable UST against it. You do not want to enable UST globally against all svchost process as it will put a serious performance hit.
Note: We don’t ever want to enable UST against svchost.exe as that would enable against any and all instances of svchost.exe running and could cause a performance hit on the machine because of the overhead.
- Use Task Manager to document the PID of the service that is demonstrating high memory usage.
- From administrative command prompt run following command:
tasklist /svc
- Using PID you documented from Task Manager, locate that svchost process and document the services that it is hosting.
- Break each service out into its own svchost process if it is a shared svchost process hosting several services by running following command for each service:
sc config <service name> type= own
replace <service name> with actual service name
Note: there is no space in “type=” and there is a space between “= own”
- Restart the service for setting to take effect.
- Verify the services are running in their own svchost process by running tasklist /svc from command prompt again.
- At this point, you have broken each service out into its own svchost process; now identify which service was driving up memory usage before proceeding to next step.
- Once the service has been identified, from administrative command prompt change command focus to c:windowssystem32 folder if needed and run following command:
copy svchost.exe <unique name>
Replace <unique name> with something that represents the service. Example for wmi service – wmisvchost.exe
- Launch registry editor (Start > Run > “regedit.exe”) and navigate to HKLMSystemCurrentControlSetServices then the appropriate key for the service you are uniquely naming svchost process for.
- Modify existing ImagePath from %systemroot%system32svchost.exe -k netsvcs to %systemroot%system32<unique name> -k netsvcs
Replace <unique name> with that used in step 8. In this example that would be: %systemroot%system32wmisvchost.exe -k netsvcs
Note: Backup the registry key before modifying it
- Restart the service.
- Use gflags as noted earlier to enable “Create user mode stack trace database” against the uniquely name svchost process, then restart the service to apply the new settings.
Note: It is important that you go back and reverse what you did in step 4 and modify path back to original after you are no longer needing the service to be broken out and uniquely named as failure to do so can prevent future hotfixes from being installed associated with that service.
To reverse, replace sc config <service name> type= own with sc config <service name> type= share
Reverse your gflag setting also by unchecking the “Create user mode stack trace database”.
Reverse your setting in the registry under the service key for the ImagePath.
- Get a procdump of the process when memory is high.
Directions for Procdump
- Download Procdump tool from Sysinternals
Note: Use procdump if dumping 32-bit process and use procdump64 if dumping a 64-bit process
- From and administrative command prompt, navigate to the directory where you downloaded and unzipped procdump tool.
- Run the following command to dump a unique name process:
procdump -ma <process name>
The -ma switch is to perform a full memory dump of the process.
Replace <process name> with actual process name.
If there is more than one instance of a process running with the same name you must dump the process by PID as opposed to name.
e.g. procdump -ma <PID>
Replace <PID> with actual PID of the process.
Next Up: MYSTERY MEMORY LEAK: WHERE DID MY MEMORY GO!
– Jeffrey Worline
Brought to you by Dr. Ware, Microsoft Office 365 Silver Partner, Charleston SC.

Recent Comments