This article is contributed. See the original author and article here.
When operating an IoT solution, you have to be able to predict and identify operational malfunction and security issues in your IoT fleet. By using Time Series analysis to surface anomalies on IoT device telemetry data as described below you will be able to enhance your control over your IoT solution.
Using diagnostics logs from the Azure IoT Hub and Sentinel query capabilities, you can create custom ML (Machine Learning) based anomaly detection on your IoT telemetry data. See below the description for various functions used when compiling the Kusto Query Language (KQL) queries and how to use queries to either visualize the output or transform it to tabular data outputs.
In addition to using the information in this article, you can gain a more comprehensive and complete solution for securing and monitoring your IoT solution, by using Azure Defender for IoT. Defender for IoT is built to enhance your security capability for your entire IoT environment. Natively integrated with Azure IoT Hub and Azure Sentinel, Azure Defender for IoT will enrich your environment with unprecedented comprehensive investigation, monitoring and response capabilities.
Practical Time Series Analysis Applications on IoT Device Telemetry
Overview
As part of security monitoring and incident response, analysts often develop several detections based on static thresholds within a specified time interval window. Traditionally these threshold values are identified manually by an historical trend of events and are configured as a static value in the detection.
In addition, even though static thresholds are reached/exceeded slightly, the results are often uninteresting and generate false positives for analysts. As part of triage, analysts improve detections via Allow list creation to reduce the false positive rate.
This approach is not scalable. The good news is that time series analysis-based detections can effectively replace static detections. The results are robust to outliers and perform very well at scale due to vectorized implementation to process thousands of time series in seconds.
A typical Time Series analysis workflow involves the following:
- Select the data source table that contains raw events defined for the scope of the analysis. In this case it’s Device Telemetry.
- Define the field from the schema against which numeric data points will be calculated (such as count of device connection by device id’s).
- using make-series operator which transforms base logs into series of aggregated values of specified data points against time windows.
- Use Time Series functions (e.g., series_decompose_anomalies) to apply decomposition transformation on an input data series and extract anomalous points.
- Joining the anomalous points with other related data that can add context to the anomalies detected. In this case, getting the protocol and masked IP address related to the anomalous data points.
- Plot the output in a time chart by splitting seasonal, trend, and residual components in the data. This will visualize the outliers and help with understanding why these values were flagged.
For the demonstration purposes, we will run it against sample data from a lab and split the query to display various results step-by-step.
Requirements: Export IoT Hub Diagnostic logs into Azure Log Analytics.
Before starting, you need to create a diagnostic setting in the relevant IoT Hub to export its logs to a Log analytics workspace. These logs contain device communication telemetry of the IoT Hub. Based on this data, you can create different detections to locate security and operational issues on the entire IoT device fleet. The relevant logs for the scenario in this article are “Connections” and “Device Telemetry”. To more details on IoT Hub Diagnostic setting, see Set up and use metrics and logs with an Azure IoT hub.
Scenario: Device Telemetry Anomaly by Device ID.
This scenario will detect anomalies across your entire IoT fleet. Each IoT device will be compared to his own telemetry history based an hour time frame aggregation. This detection is suitable for meaningful deviations from the normal telemetry activity and detects trend changes in a specific device and time across the entire IoT fleet. Examples for use cases that can be detected: device down times, device malfunctions, device communication out of hours and configuration changes.
First Query – Transform the original telemetry table to a set of time series:
The first part of the query will prepare the time series data per each “deviceConnect” event by using make-series operator.
let starttime = 29d;
let endtime = 1d;
let timeframe = 1h;
let scorethreshold = 3;
let TimeSeriesData=
AzureDiagnostics
| where TimeGenerated between (startofday(ago(starttime))..startofday(ago(endtime)))
| where ResourceProvider == "MICROSOFT.DEVICES" and ResourceType == "IOTHUBS"
| where Category == "Connections" and OperationName == "deviceConnect"
| extend DeviceId = tostring(parse_json(properties_s).deviceId)
| make-series Total=count() on TimeGenerated from startofday(ago(starttime)) to startofday(ago(endtime)) step timeframe by DeviceId;
TimeSeriesData
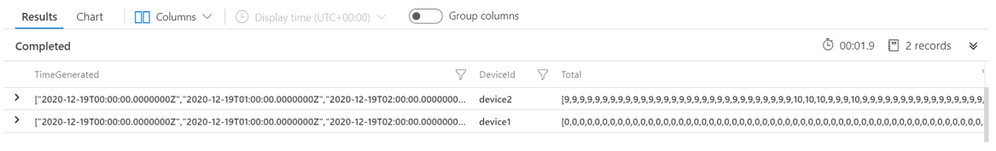
Results:
Sample results will look like the results shown below. Total and TimeGenerated columns are vector of multi-value array per telemetry. You can also notice 0 values which are filled by make-series operator for missing values in the Total column.
Second Query – finding anomalous points on a set of time series:
The next part of the query will detect seasonality and trends in your data automatically and will use it to flag spikes as anomalies based on provided parameters. (3 as threshold, -1 to detect auto-seasonality, linefit for trend analysis).
let TimeSeriesAlerts=TimeSeriesData
| extend (anomalies, score, baseline) = series_decompose_anomalies(Total, scorethreshold, -1, 'linefit')
| mv-expand Total to typeof(double), TimeGenerated to typeof(datetime), anomalies to typeof(double),score to typeof(double), baseline to typeof(long)
| project TimeGenerated, Total, baseline, anomalies, score, DeviceId;
TimeSeriesAlerts
| where anomalies != 0
Results:
Sample results will look like the results shown below. The total column indicates the actual count observed in that hour and the baseline count indicates the expected count in that hour. Note that since the timestamps are aggregated per hour, timestamp will show only round hours. The results shown are the anomalies detected.

Third Query – Enriching data on the anomalous points:
The next part of the query will correlate the results of the anomalies with base data to populate additional fields. This provides additional context to determine if the anomaly detected is malicious or not.
TimeSeriesAlerts
| where anomalies != 0
| join (
      AzureDiagnostics | where OperationName contains "deviceConnect"
      | extend DeviceId = strcat(parse_json(properties_s)["deviceId"])
| extend RemoteAddress = strcat(parse_json(properties_s)["maskedIpAddress"])
| extend protocol = strcat(parse_json(properties_s)["protocol"])
  | where TimeGenerated between (startofday(ago(starttime))..startofday(ago(endtime)))
  | extend DateHour = bin(TimeGenerated, 1h)
  | summarize TimeGeneratedMax = arg_max(TimeGenerated, *), RemoteIPlist = make_set(RemoteAddress, 100), ProtocolList = make_set(protocol, 100) by DeviceId, TimeGeneratedHour= bin(TimeGenerated, 1h)
  ) on   DeviceId, $left.TimeGenerated == $right.TimeGeneratedHour
  | project DeviceId, RemoteIPlist, ProtocolList, TimeGeneratedMax, TimeGenerated, Total, baseline, anomalies , score
Results:
Sample results will look like the results shown below, with IP address, port and protocol details seen in the respective hour. The screenshot below is filtered to interesting events for demo purposes.

Fourth Query – Visualizing time series data:
This part of the query will further investigate the results of the anomalies on a specific device. You can use chart rendering options to visualize the telemetry data over time. You can use different Y – axis values, to understand what normal and abnormal behavior is.
TimeSeriesAlerts
| where DeviceId == "specific device"
| render timechart
Results:
Sample results will look like the results shown below. The chart renders the device trend and seasonality of IoT device communication with the IoT Hub and can shed light on why the algorithm decided to mark certain timeframes as anomalies. In this example, you can see very clearly what the anomalies in this device communication are.

Creating an Analytic rule on Azure Sentinel:
When finding the detection that suits your needs, you can create a custom analytic rule on Azure Sentinel based on the same detection. Using the scheduled query rule feature, create a detection that will run every day and look for anomalies from last 24 hours on top of your IoT device telemetry data.
Conclusion
Time series analysis is an effective technique for understanding various time-based patterns in your data. Applying time series analysis technique on various telemetry data provides unique capability compared to traditional detection mechanisms which are atomic or static in nature. Together with Azure Sentinel, this detection can become an integrated part of your IoT security solution.
In this article, we investigated practical example where we analyzed different series of IoT device telemetry data across a fleet of IoT assets.
To explore more on security features on the IoT platform, Join IoT Security community.
References:
- Time Series – Wikipedia
- Anomaly detection and forecasting in Azure Data Explorer
- Time series analysis in Azure Data Explorer
- KQL operators syntax and example usage documentation:
- IoT Hub – Exporting Diagnostic logs
- Azure Sentinel – Scheduled query analytic rule
Brought to you by Dr. Ware, Microsoft Office 365 Silver Partner, Charleston SC.

Recent Comments