This article is contributed. See the original author and article here.
Intro:
Pinning a visualization from Log Analytics to Azure Dashboards is a fast and easy way to operationalize logs, creating a single pane of glass that allows fast and easy monitoring of resources in your Azure estate.
Multi scope pinning
We have upgraded our pinning capabilities to allow pinning from multi scope queries.
This allows the selection of multiple resources of the same type as the scope of the query – and simply pin a unified visualization spanning cross the selected scopes.
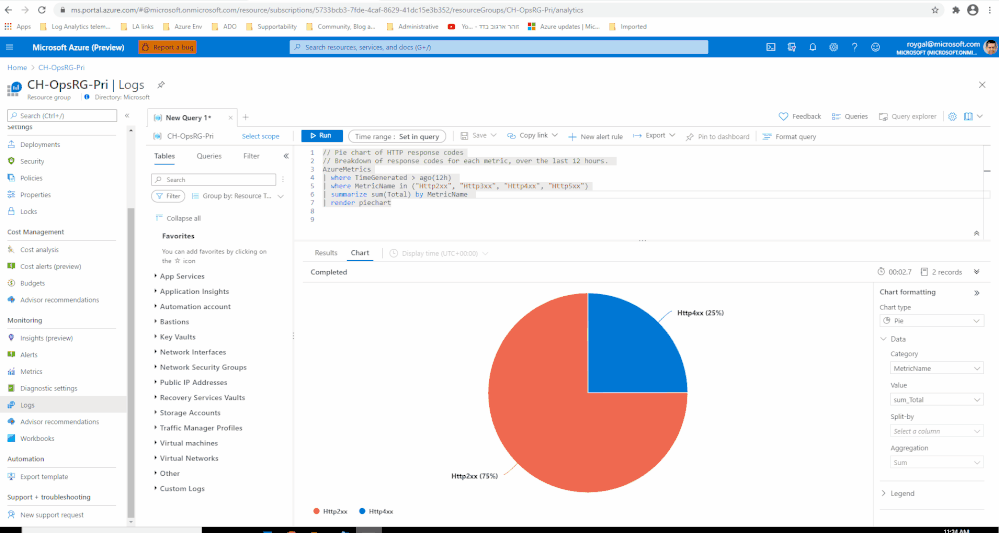
To take advantage of this new capability, use the resource picker to select the scope or scopes you want for your query, run your query and pin to an Azure Dashboard as you normally would:
Feedback
We appreciate your feedback! comment on this blog post and let us know what you think of the this feature.
You may also use our in app feedback feature to provide us with additional feedbacks:

Brought to you by Dr. Ware, Microsoft Office 365 Silver Partner, Charleston SC.

Recent Comments