This article is contributed. See the original author and article here.
Yesterday, we received a question from our customer that needs to know if it is possible to receive an email or alert about the main database wait stats usage for performance monitoring. Following, I would like to share an example how to do it.
Once we have enabled in our database the option of diagnostics setting to capture the database wait statistics this information will be saved in a specific table AutoDiagnostics in the Category DatabaseWaitStatistics.
Basically, we need to filter by the resource that we want to monitor and add some logic to calculate the delta.
AzureDiagnostics
| where Category == "DatabaseWaitStatistics"
| where ResourceId =~ '/SUBSCRIPTIONS/XXXX-XXXX-XXX-XXX-D6C13FEF4316/RESOURCEGROUPS/ResourceGroupName/PROVIDERS/MICROSOFT.SQL/SERVERS/Servername/DATABASES/DatabaseName'
| where TimeGenerated >= ago(10m)
| project delta_wait_time_ms_d, wait_type_s
| summarize total_wait_time_in_ms = sum(delta_wait_time_ms_d) / 1000
    by wait_type_s
| sort by total_wait_time_in_ms desc
| extend Rank=row_rank(total_wait_time_in_ms)
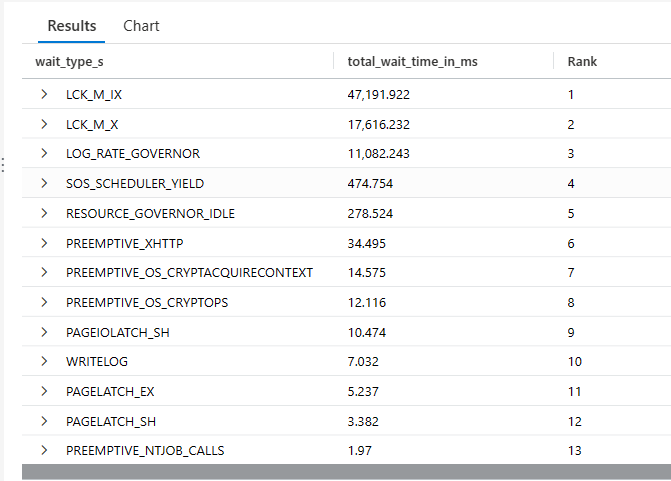
Once we run this query we have:
With this Kusto Query already implemented, basically, we could create an alert using the button New alert rule:

and configure the alert and the details needed:

Enjoy!
Brought to you by Dr. Ware, Microsoft Office 365 Silver Partner, Charleston SC.

Recent Comments