This article is contributed. See the original author and article here.
Thanks to Preeti Krishna and Alp Babayigit for the great help.
We have published several Blog posts on how Azure Sentinel can be used Side-by-Side with 3rd Party SIEM tools, leveraging cloud-native SIEM and SOAR capabilities to forward enriched alerts.
Today many enterprises consume more and more cloud services, there is a huge requirement for cloud-native SIEM, this is where Azure Sentinel comes in play and has following advantages:
- Easy collection from cloud sources
- Effortless infinite scale
- Integrated automation capabilities
- Continually maintained cloud and on-premises use cases enhanced with Microsoft TI (Threat Intelligence) and ML (Machine Learning)
- Github community
- Microsoft research and ML capabilities
- Avoid sending cloud telemetry downstream (send cloud data to on-premise SIEM)
There are several best practice integration options available how to operate Azure Sentinel in Side-by-Side.
| Alerts | Events |
Upstream to sentinel | CEF Logstash Logic Apps API | CEF Logstash API |
Downstream from Sentinel | Security Graph Security API PowerShell Logic Apps API | API PowerShell |
In this Blog post we want to focus more on how Azure Sentinel can consume security telemetry data directly from a 3rd Party SIEM like Splunk.
Why do we want to share this scenario? For some scenarios it makes sense to use data from 3rd Party SIEMs for correlation with available data sources in Azure Sentinel, also Sentinel can be used as single pane of glass to centralize all incidents (generated by different SIEM solutions) and finally you will probably have to deliver the side-by-side for a while until your security team will be more comfortable working within the new SIEM (Azure Sentinel).
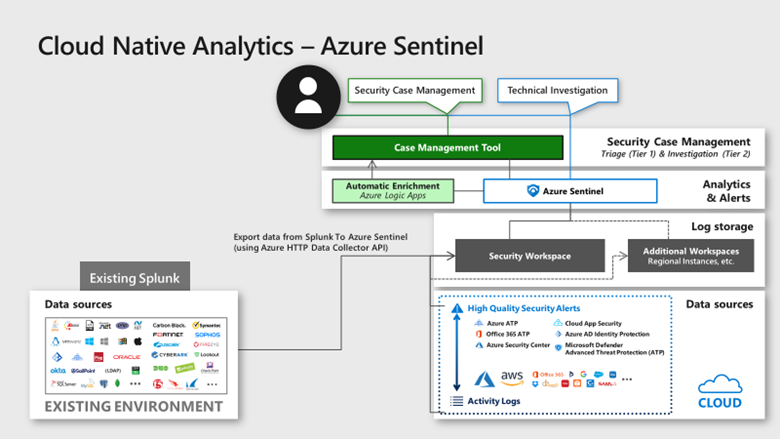
In this diagram, we show how Splunk data can be correlated into Azure Sentinel providing a consolidated SIEM view

Scenario description:
When you add data to Splunk, the Splunk indexer processes it and stores it in a designated index (either, by default, in the main index or in the one that you identify). Searching in Splunk involves using the indexed data for the purpose of creating metrics, dashboards and alerts.
Let’s assume that your security team wants to collect data from Splunk platform to use Azure Sentinel as their centralized SIEM. In order to implement this scenario, we can rely on different options but the one I was thinking about is to rely on data stored in Splunk index then create a scheduled custom alert to push this data to the Azure Sentinel API.
In order to send data from Splunk to Azure Sentinel, my idea was to use the HTTP Data Collector API, more information can be found here. You can use the HTTP Data Collector API to send log data to a Log Analytics workspace from any client that can call a REST API.
All data in the Log Analytics workspace is stored as a record with a particular record type. You format your data to send to the HTTP Data Collector API as multiple records in JSON. When you submit the data, an individual record is created in the repository for each record in the request payload.
Based on Splunk Add-on Builder here, I created an add-on which trigger an action based on the alert in Splunk. You can use Alert actions to define third-party integrations (like Azure Sentinel) or add custom functionality. Splunk Add-on Builder uses Python code to create your alert action, here is the code I used within the Add-on: https://docs.microsoft.com/en-us/azure/azure-monitor/platform/data-collector-api#python-3-sample
To make this simple I have created an Add-on for you to use. You need just to install it in your Splunk platform.
Let’s start the configuration!
Preparation & Use
The following tasks describe the necessary preparation and configurations steps.
- Onboarding of Splunk instance (latest release), can be found here
- Get the Log Analytics workspace parameters: Workspace ID and Primary Key from here
- Install the Azure Sentinel App for Splunk: can be found here
Onboard Azure Sentinel
Onboarding of Azure Sentinel is not part of this blog post, however required guidance can be found here.
Add-on Installation in Splunk Enterprise
In Splunk home screen, on the left side sidebar, click “+ Find More Apps” in the apps list, or click the gear icon next to Apps then select Browse more apps.

Search for Azure Sentinel in the text box, find the Azure Sentinel Add-On for Splunk and click Install.
After the add-on is installed reboot of Splunk is required, click Restart Now.
Configure the Azure Sentinel add-on for Splunk
Refer to Define RealTime Alerts documentation to set up Splunk alerts to send logs to Azure Sentinel. To validate the integration, the audit index is used as an example, for an “_audit”- this repository stores events from the file system change monitor, auditing, and all user search history. You can query the data by using index=”_audit” in the search field as illustrated below.

Then use a scheduled or real-time alert to monitor events or event patterns as they happen. You can create real-time alerts with per-result triggering or rolling time window triggering. Real-time alerts can be costly in terms of computing resources, so consider using a scheduled alert, when possible.
Set up alert actions, which can help you respond to triggered alerts. You can enable one or more alert actions. Select “Send to Azure Sentinel” action, which appears after you install the Azure-Sentinel add-on as shown in the diagram below.

Fill in the required parameters as shown in the diagram below:
- Customer_id: Azure Sentinel Log Analytics Workspace ID
- Shared_key: Azure Sentinel Log Analytics Primary Key
- Log_Type: Azure Sentinel custom log name
Note: These parameters are required and will be used by the application to send data to Azure Sentinel through the HTTP Data Collector API.


View Splunk Data in Azure Sentinel
The logs will go to a custom Azure Sentinel table called ‘Splunk_Audit_Events_CL’ as shown below. The table name aligns with the log name provided in the Figure 4 above. It can take few minutes for events to be available.

You can query the data in Azure Sentinel using Kusto Query Language (KQL) as shown below.
Splunk_Audit_Events_CL | summarize count() by user_s, action_s | render barchart

As mentioned at the beginning of this blog, Azure Sentinel can be used as single pane of glass to centralize all incidents (generated by different SIEM solutions).
When a correlation search included in the Splunk Enterprise Security or added by a user, identifies an event or pattern of events, it creates an incident called notable event. Correlation searches filter the IT security data and correlate across events to identify a particular type of incident (or pattern of events) and then create notable events.
Correlation searches run at regular intervals (for example, every hour) or continuously in real-time and search events for a particular pattern or type of activity. The notable event is stored in a dedicated notable index. You can import all notable events into Azure Sentinel using the same procedure described above.

The results will be added to a custom Azure Sentinel table called ‘Splunk_Notable_Events_CL’ as shown below.

You can easily query Splunk incidents in Azure Sentinel:
Splunk_Notable_Events_CL
| extend Origin_Time= extract(“([0-9]{2}/[0-9]{2}/[0-9]{4} [0-9]{2}:[0-9]{2}:[0-9]{2})”, 0, orig_raw_s )| project TimeGenerated=Origin_Time , search_name_s, threat_description_s, risk_object_type_s

Splunk SPL to KQL
As mentioned above, you will probably have to deliver the side-by-side for a while until your security team will be more comfortable working within the new SIEM (Azure Sentinel). One challenge is how migrate rules and searches from Splunk to Azure Sentinel.
Azure Sentinel is using Kusto Query Language (KQL) to query the data. Splunk is using search-processing-language (SPL) for that.
You can consider this project: https://uncoder.io to transform the query!

Uncoder.io is SOC Prime’s free tool for SIEM search language conversion. Uncoder relies to enable event schema resolution across platforms.
Uncoder.IO is the online translator for SIEM saved searches, filters, queries, API requests, correlation and Sigma rules to help SOC Analysts, Threat Hunters and SIEM Engineers. Serving as one common language for cyber security it allows blue teams to break the limits of being dependent on single tool for hunting and detecting threats.
Also consider this nice initiative from Alex Teixeira:
https://github.com/inodee/spl-to-kql
Summary
We just walked through the process of standing up Azure Sentinel Side-by-Side with Splunk. Stay tuned for more Side-by-Side details in our blog channel.
Brought to you by Dr. Ware, Microsoft Office 365 Silver Partner, Charleston SC.

Recent Comments