This article is contributed. See the original author and article here.
When you see your cloud-based application architecture, no matter it is microservices architecture or not, many systems are inter-connected and send/receive messages in real-time, near real-time or asynchronously. You all know, in this environment, at some stage, some messages are often failed to deliver to their respective destinations or halted while processing them.
In the cloud environment, components in a system run with their rhythm. Therefore, you should assume that a particular component gets hiccup at any point in time and design the architecture based on this assumption. Therefore, to minimise message loss, you should be able to trace them from one end to the other end. We use the term “Observability” and “Traceability” for it.
In my previous post, a citizen dev in a fusion team uses an Azure Functions app that enables the OpenAPI capability, and build a Power Apps app. This time, I’m going to add a capability that traces the workout data from the Power Apps app to Azure Cosmos DB through Azure Monitor and Application Insights. I will also discuss how this ability is related to the concepts from Open Telemetry.
- Developing Power Apps in Fusion Teams
- Tracing End-to-End Data from Power Apps to Azure Cosmos DB
- Putting DevOps and Power Apps Together
You can find the sample code used in this post at this GitHub repository.
Scenario
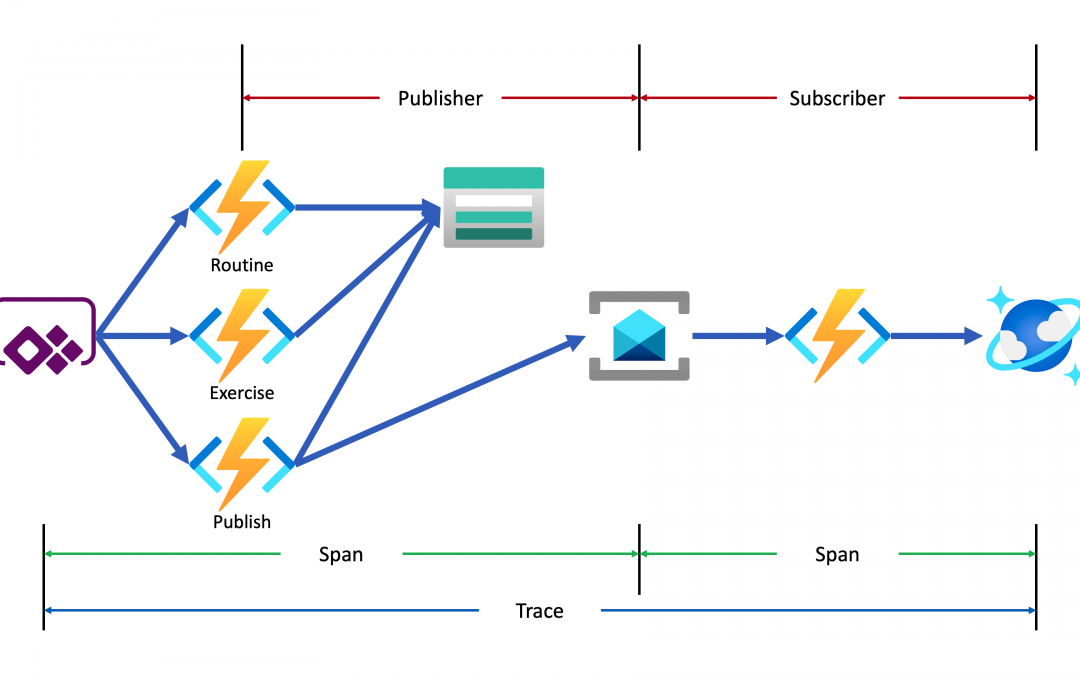
Lamna Healthcare Company runs a fitness centre in Korea for their members. The centre provides their members with a Power Apps app to record their workout details. Ji Min, the trainer team lead, recently got some feedback from her members that the app gets crashed while putting their workout logs. As she represents the trainers in the fusion team, she started discussing this issue with Su Bin, the pro dev in the team. As a result, Su Bin decided to add a tracing logic into the Function app. Here’s the high-level diagram that describes the data processing flow.
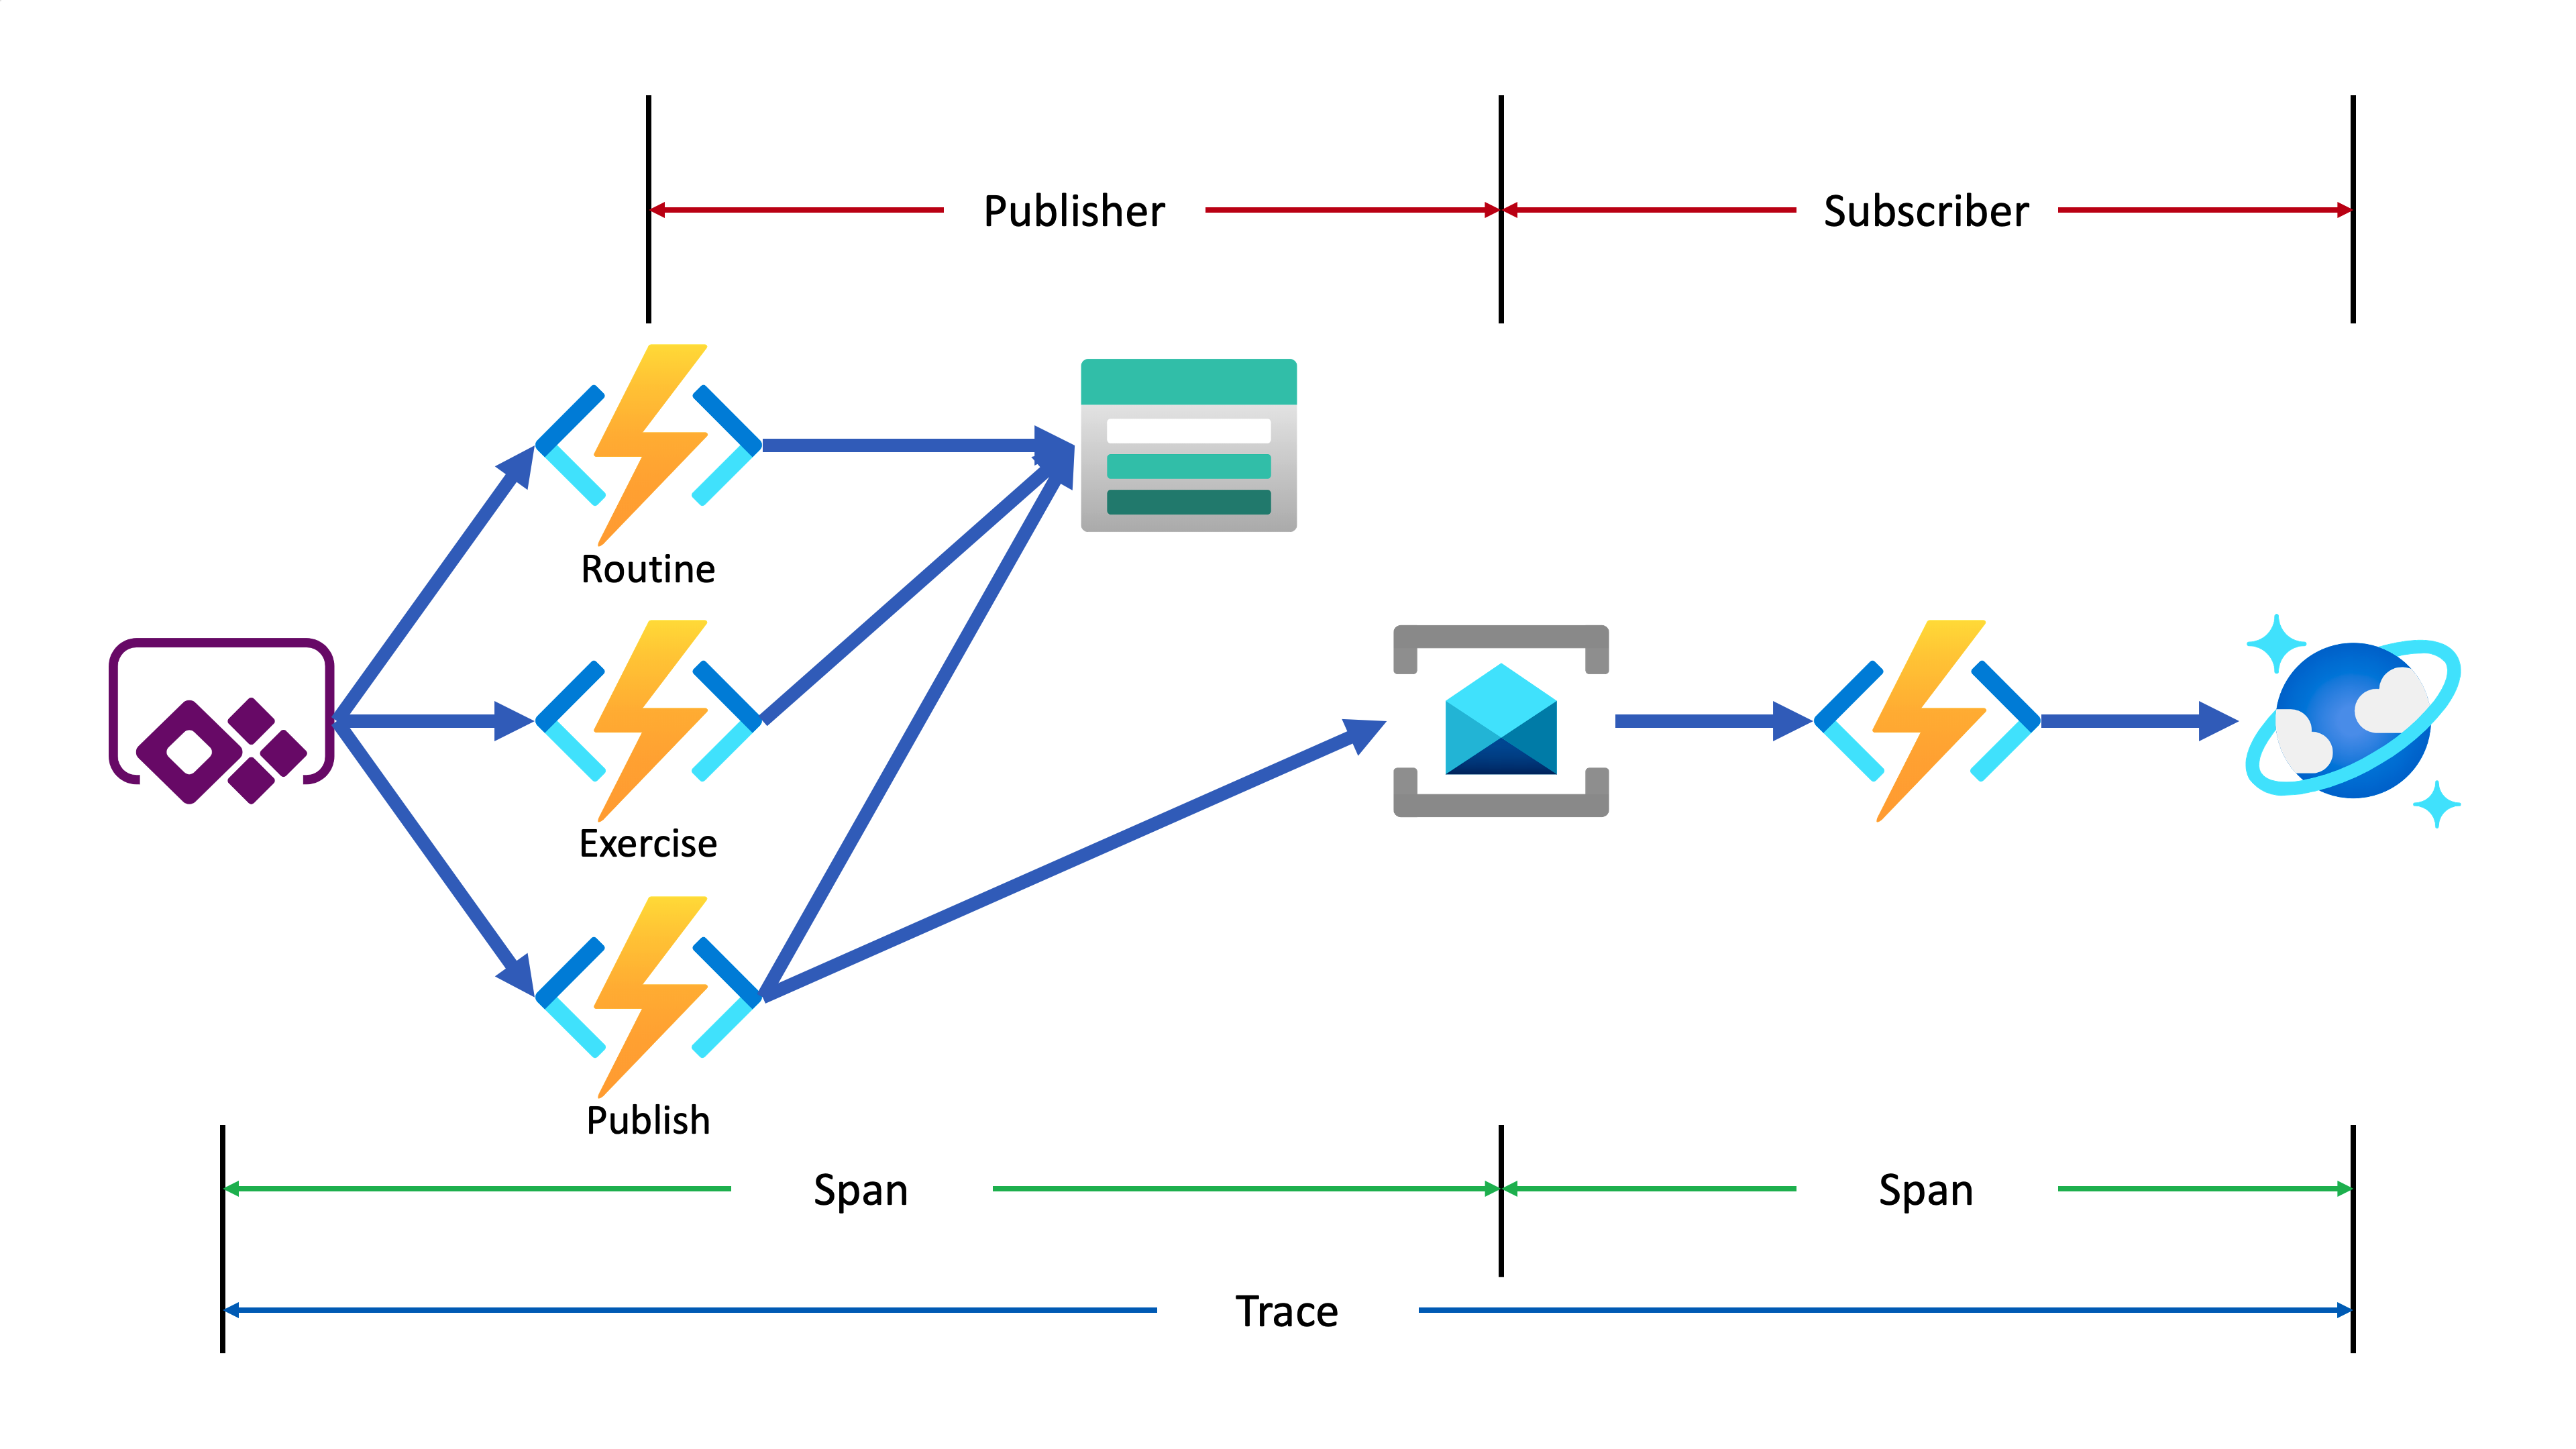
Let’s analyse the diagram based on the Open Telemetry spec.
- The entire data flow from Power Apps to Cosmos DB is called “Trace“.
- The whole flow is divided into two distinctive parts by Azure Service Bus because both sides are totally different and independent applications (Publisher and Subscriber). So, these two individual parts are called “Span“. In other words, the Span is a unit of work that handles messages.
- The Publisher stores the data sent from Power Apps to Azure Table Storage, aggregates them through the
publishaction, and send them to Azure Service Bus.
- The Publisher stores the data sent from Power Apps to Azure Table Storage, aggregates them through the
In the picture above, the Publisher consists of three actions,
routine,exerciseandpublish. Although you can split it into three sub Spans, let’s use one Span for now.
- The Subscriber receives the message from Azure Service Bus, transforms the message and stores it to Cosmos DB.
- When a message traverses over spans, you need a carrier for metadata so that you can trace the message within the whole Trace. The metadata is called “Span Context“.
Power Apps Update
As mentioned earlier, trace starts from the Power Apps app. Therefore, the app needs an update for the tracing capability. Generate both correlationId and spanId when tapping the Start button and send both to API through the routine action.
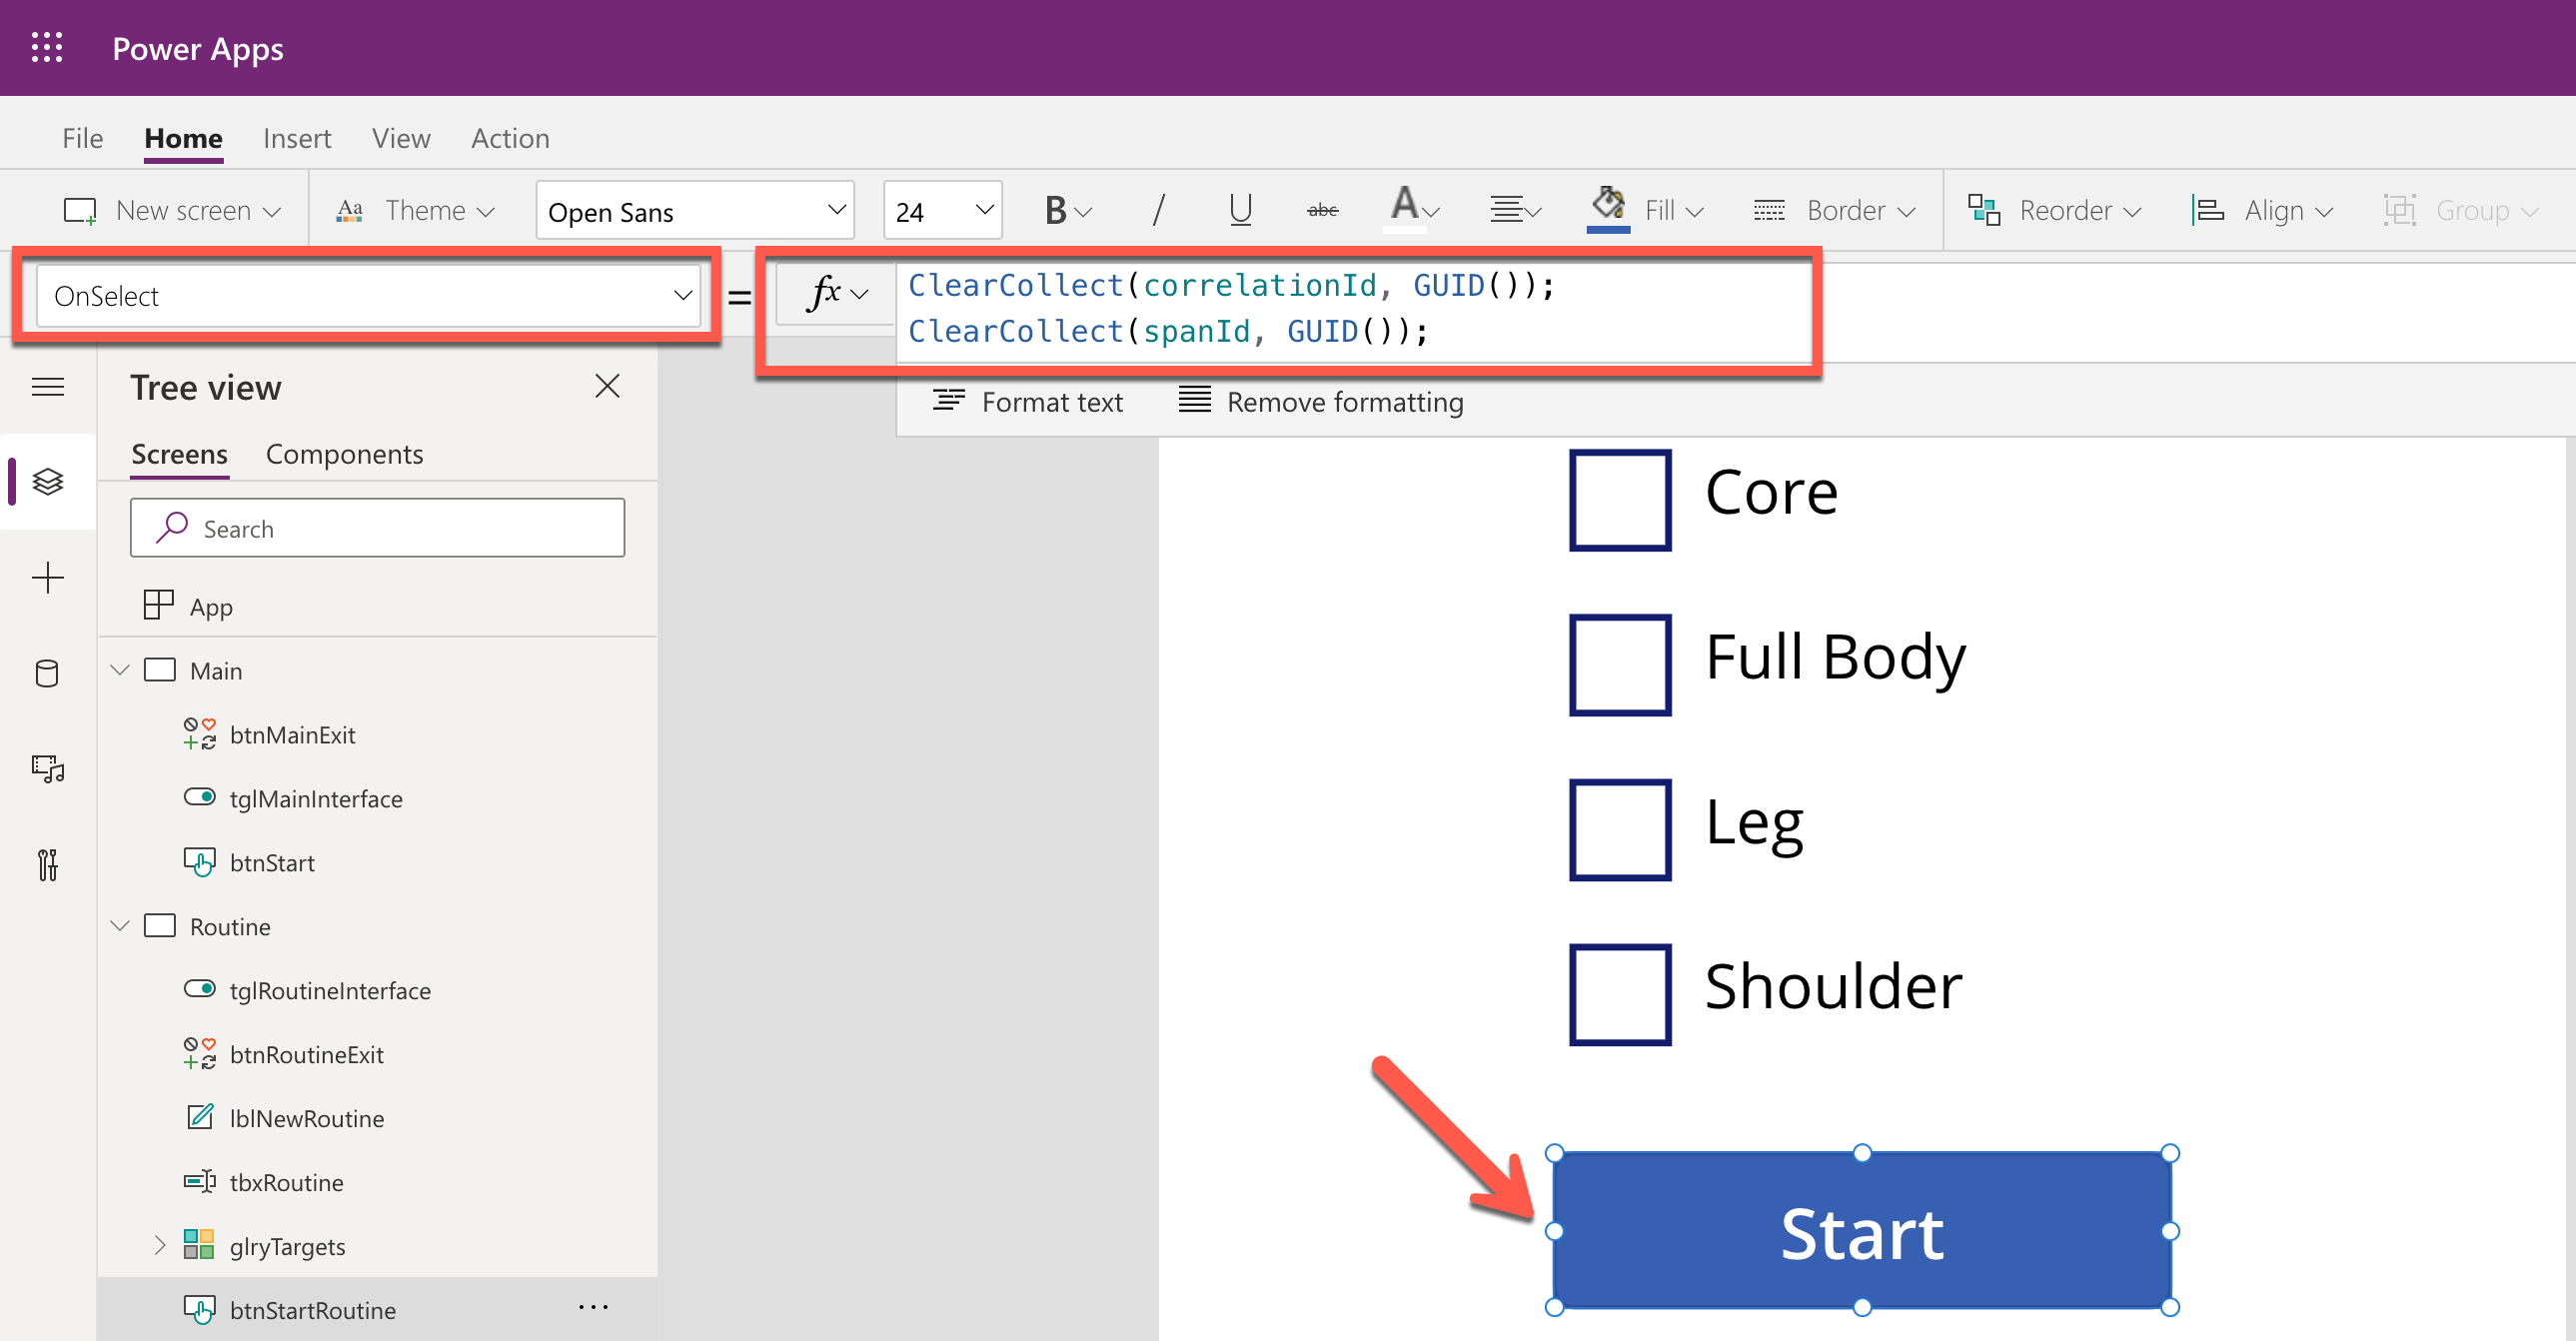
By doing so, you know the tracing starts from the Power Apps app side while monitoring, and the first Span starts from it as well. Both correlationId and spanId travels until the publish action is completed. Moreover, the correlationId is transferred to the other Span through the Span Context.
Backend Update
As long as the Azure Functions app knows the instrumentation key from an Application Insights instance, it traces almost everything. OpenTelemetry.NET is one of the Open Telemetry implementations, which has recently released v1.0 for tracing. Both metrics and logging are close to GA. However, it doesn’t work well with Azure Functions. Therefore, in this post, let’s manually implement the tracing at the log level, which is sent to Application Insights.
Publisher – HTTP Trigger
When do we take the log?
In this example, the backend APIs consist of routine, exercise and publish actions. Each action stores data to Azure Table Storage, by following the event sourcing approach. So, it’s good to take logs around the data handling as checkpoints. In addition to that, while invoking the publish action, it aggregates the data stored from the previous actions and sends the one to Azure Service Bus, which is another good point that takes the log as a checkpoint.
All the logging features used in Azure Functions implement the ILogger interface. Through this interface, you can store custom telemetry values to Application Insights. Then, what could be the values for the custom telemetry?
- Event Type: Action and its invocation result –
RoutineReceived,ExerciseCreatedorMessageNotPublished - Event Status: Success or failure of the event –
SucceededorFailed - Event ID: Azure Functions invocation ID – whenever a new request comes in a new GUID is assigned.
- Span Type: Type of Span –
PublisherorSubscriber - Span Status: Current Span status –
PublisherInitiated,SubscriberInProgressorPublisherCompleted - Span ID: GUID assigned to Span each time it is invoked
- Interface Type: Type of user interface –
Test HarnessorPower Apps App - Correlation ID: Unique ID for the whole Trace
It could be the bare minimum stored to Application Insights. Once you capture them, you will be able to monitor in which trace (correlation ID) the data flow through which user interface (interface type), span (span type), and event (event type) successfully or not (event status).
Here’s the extension method for the ILogger interface. Let’s have a look at the sample code below that checks in the request data from Power Apps is successfully captured on the routine action. Both correlationId and spanId are sent from Power Apps (line #9-10). The invocationId fro the Azure Functions context has become the eventId (line #12). Finally, event type, event status, span type, span status, interface type and correlation ID are logged (line #14-17).
public async Task<IActionResult> CreateRoutineAsync(
[HttpTrigger(AuthorizationLevel.Function, HttpVerbs.Post, Route = “routines”)] HttpRequest req,
ExecutionContext context,
ILogger log)
{
var request = await req.ToRequestMessageAsync<RoutineRequestMessage>().ConfigureAwait(false);
var @interface = request.Interface;var correlationId = request.CorrelationId;
var spanId = request.SpanId;var eventId = context.InvocationId;
log.LogData(LogLevel.Information, request,
EventType.RoutineReceived, EventStatusType.Succeeded, eventId,
SpanType.Publisher, SpanStatusType.PublisherInitiated, spanId,
@interface, correlationId);…
}
The code below shows another checkpoint. Store the request data to Azure Table Storage (line #14). If it’s successful, log it (line #18-23). If not, throw an exception, handle it and log the exception details (line #29-34).
public async Task<IActionResult> CreateRoutineAsync(
[HttpTrigger(AuthorizationLevel.Function, HttpVerbs.Post, Route = “routines”)] HttpRequest req,
ExecutionContext context,
ILogger log)
{
…try
{
…await this._client.CreateTableIfNotExistsAsync(this._settings.GymLog.StorageAccount.Table.TableName).ConfigureAwait(false);
var table = this._client.GetTableClient(this._settings.GymLog.StorageAccount.Table.TableName);
var response = await table.UpsertEntityAsync(entity).ConfigureAwait(false);…
log.LogData(response.Status.ToLogLevel(), res.Value,
EventType.RoutineCreated, EventStatusType.Succeeded, eventId,
SpanType.Publisher, SpanStatusType.PublisherInProgress, spanId,
@interface, correlationId,
clientRequestId: response.ClientRequestId,
message: response.Status.ToResponseMessage(res));
}
catch (Exception ex)
{
…log.LogData(LogLevel.Error, res.Value,
EventType.RoutineNotCreated, EventStatusType.Failed, eventId,
SpanType.Publisher, SpanStatusType.PublisherInProgress, spanId,
@interface, correlationId,
ex: ex,
message: ex.Message);
}…
}
In similar ways, the other exercise and publish actions capture the checkpoint logs.
Publisher – Span Context
The publish action in the Publisher Span doesn’t only capture the checkpoint log, but it should also implement Span Context. Span Context contains metadata for tracing, like correlation ID. Depending on the message transfer method, use either the HTTP request header or message envelope. As this system uses Azure Service Bus, use the ApplicationProperties dictionary in its message envelope.
Let’s have a look at the code for the publish action. This part describes that the message body is about the workout details (line #23-24). Other data is stored to CorrelationId and MessageId properties of the message object (line #26-27) and the ApplicationProperties dictionary so that the subscriber application makes use of them (line #30-33). Finally, after sending the message to Azure Service Bus, capture another checkpoint that message has been successfully sent (line #37-42).
public async Task<IActionResult> PublishRoutineAsync(
[HttpTrigger(AuthorizationLevel.Function, HttpVerbs.Post, Route = “routines/{routineId}/publish”)] HttpRequest req,
Guid routineId,
ExecutionContext context,
[ServiceBus(GymLogTopicKey)] IAsyncCollector<ServiceBusMessage> collector,
ILogger log)
{
var request = await req.ToRequestMessageAsync<PublishRequestMessage>().ConfigureAwait(false);
var @interface = request.Interface;var correlationId = request.CorrelationId;
var spanId = request.SpanId;var eventId = context.InvocationId;
try
{
…var messageId = Guid.NewGuid();
var subSpanId = Guid.NewGuid();
var timestamp = DateTimeOffset.UtcNow;
var message = (RoutineQueueMessage)(PublishResponseMessage)res.Value;
var msg = new ServiceBusMessage(message.ToJson())
{
CorrelationId = correlationId.ToString(),
MessageId = messageId.ToString(),
ContentType = ContentTypes.ApplicationJson,
};
msg.ApplicationProperties.Add(“pubSpanId”, spanId);
msg.ApplicationProperties.Add(“subSpanId”, subSpanId);
msg.ApplicationProperties.Add(“interface”, @interface.ToString());
msg.ApplicationProperties.Add(“timestamp”, timestamp.ToString(CultureInfo.InvariantCulture));await collector.AddAsync(msg).ConfigureAwait(false);
log.LogData(LogLevel.Information, msg,
EventType.MessagePublished, EventStatusType.Succeeded, eventId,
SpanType.Publisher, SpanStatusType.PublisherInProgress, spanId,
@interface, correlationId,
messageId: messageId.ToString(),
message: EventType.MessagePublished.ToDisplayName());…
}
catch (Exception ex)
{
…
}…
}
Subscriber – Service Bus Trigger
As the tracing metadata is transferred from Publisher via Span Context, Subscriber simply uses it. The following code describes how to interpret the message envelop. Restore the correlation ID (line #10) and Message ID (line #13). And capture another checkpoint whether the message restore is successful or not (line #16-19).
public async Task IngestAsync(
[ServiceBusTrigger(GymLogTopicKey, GymLogSubscriptionKey)] ServiceBusReceivedMessage msg,
ExecutionContext context,
ILogger log)
{
…var @interface = Enum.Parse<InterfaceType>(msg.ApplicationProperties[“interface”] as string, ignoreCase: true);
var correlationId = Guid.Parse(msg.CorrelationId);
var spanId = (Guid)msg.ApplicationProperties[“subSpanId”];var messageId = Guid.Parse(msg.MessageId);
var eventId = context.InvocationId;log.LogData(LogLevel.Information, message,
EventType.MessageReceived, EventStatusType.Succeeded, eventId,
SpanType.Subscriber, SpanStatusType.SubscriberInitiated, spanId,
@interface, correlationId);…
}
Then, store the message to Azure Cosmos DB (line #12), log another checkpoint (line #16-21). If there’s an error while processing the message, handle the exception and capture the checkpoint as well (line #25-30).
public async Task IngestAsync(
[ServiceBusTrigger(GymLogTopicKey, GymLogSubscriptionKey)] ServiceBusReceivedMessage msg,
ExecutionContext context,
ILogger log)
{
…try
{
…var response = await container.UpsertItemAsync<RoutineRecordItem>(record, new PartitionKey(record.ItemType.ToString())).ConfigureAwait(false);
…
log.LogData(LogLevel.Information, message,
EventType.MessageProcessed, EventStatusType.Succeeded, eventId,
SpanType.Subscriber, SpanStatusType.SubscriberCompleted, spanId,
@interface, correlationId,
recordId: record.EntityId.ToString(),
message: response.StatusCode.ToMessageEventType().ToDisplayName());
}
catch (Exception ex)
{
log.LogData(LogLevel.Error, message,
EventType.MessageNotProcessed, EventStatusType.Failed, eventId,
SpanType.Subscriber, SpanStatusType.SubscriberCompleted, spanId,
@interface, correlationId,
ex: ex,
message: ex.Message);…
}
}
So far, all paths the data sways have been marked as checkpoints and store the check-in log to Application Insights. Now, how can we check all the traces on Azure Monitor?
KUSTO Query on Azure Monitor
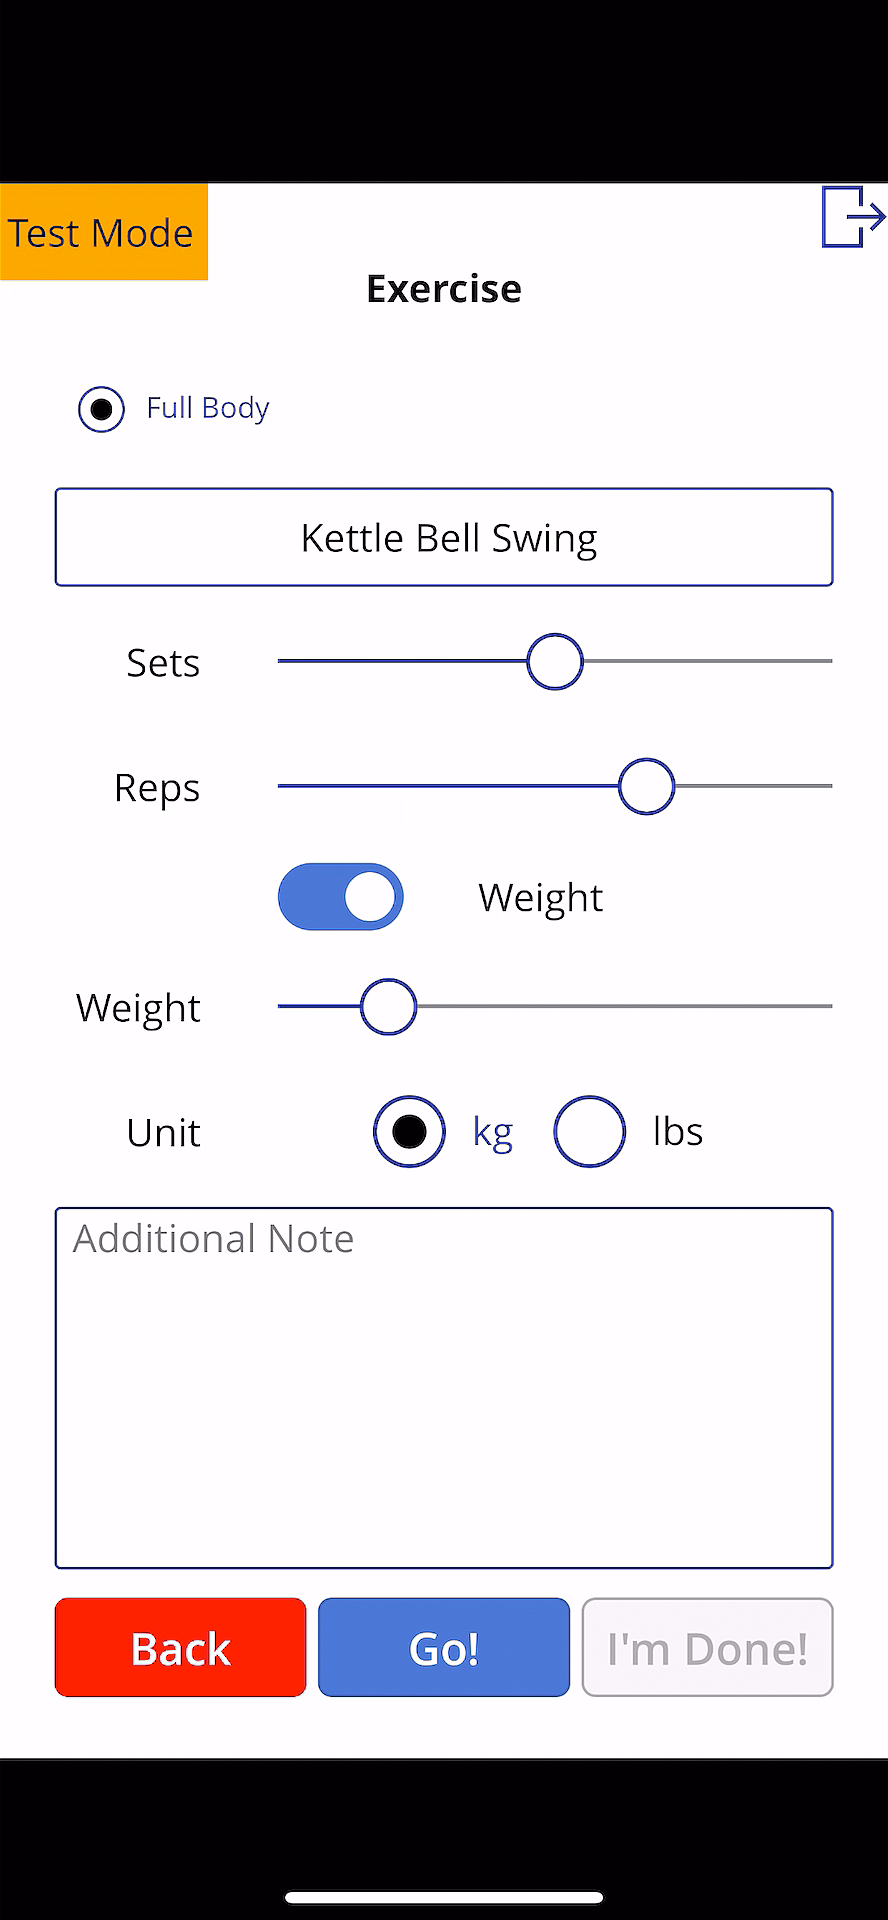
This time, Ji Min received another feedback that a new error has occurred while storing the workout details with screenshots.
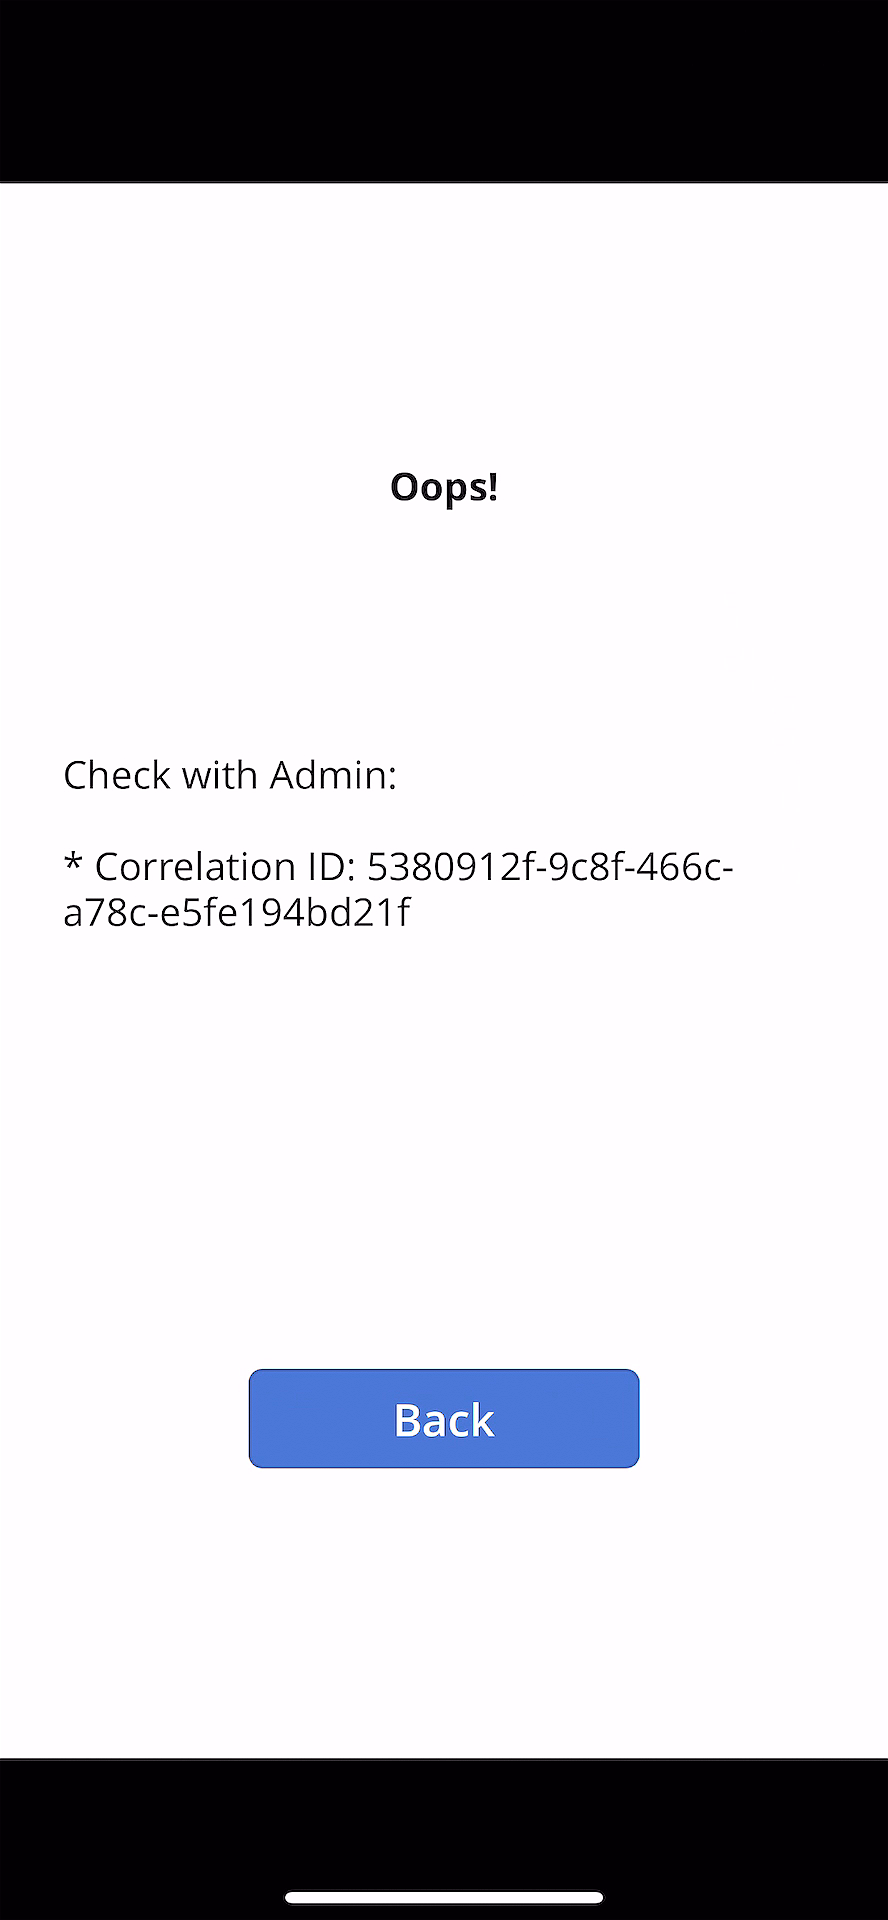
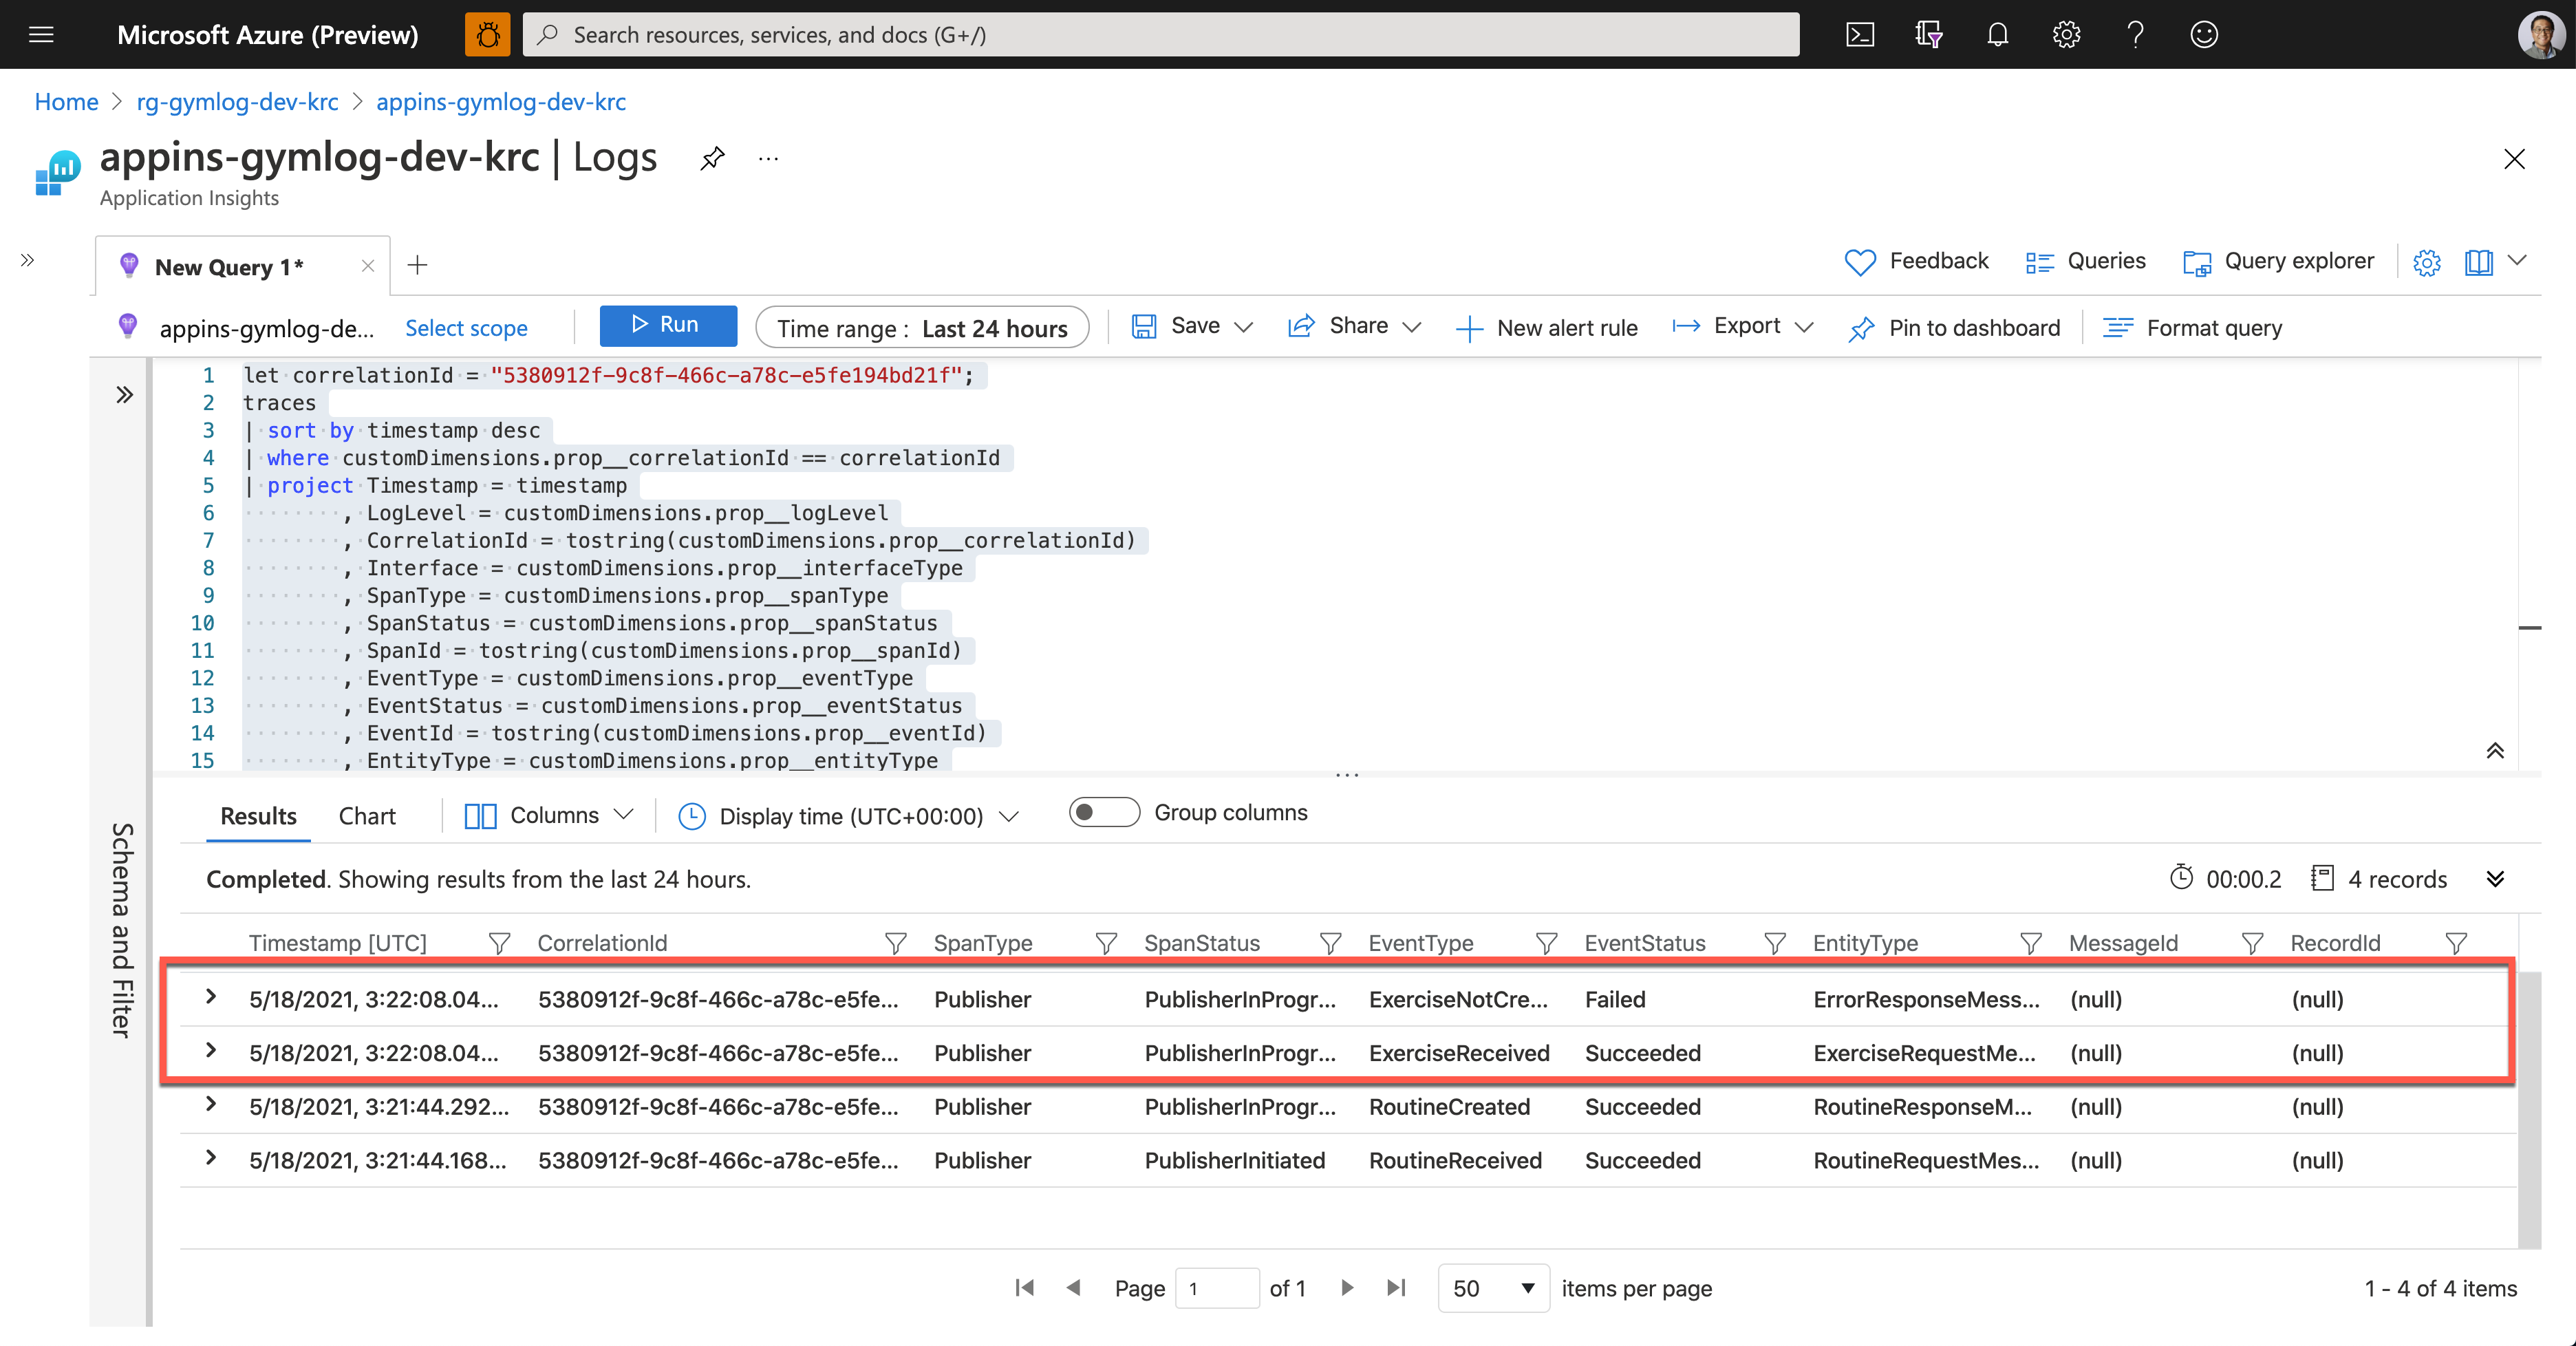
As soon as Ji Min shared the pictures with Su Bin, Su Bin wrote a Kusto query and ran it on Application Insights. Assign the correlationId value for tracing (line #1). Then use the custom telemetry values for the query. As all the custom properties start with customDimensions.prop__, include them in the where clause with the correlation ID for filtering (line #4), and in the project clause to select fields that I want to see (line #5-18).
let correlationId = “5380912f-9c8f-466c-a78c-e5fe194bd21f”;

traces

| sort by timestamp desc

| where customDimensions.prop__correlationId == correlationId

| project Timestamp = timestamp

          , LogLevel = customDimensions.prop__logLevel

          , CorrelationId = tostring(customDimensions.prop__correlationId)

          , Interface = customDimensions.prop__interfaceType

          , SpanType = customDimensions.prop__spanType

          , SpanStatus = customDimensions.prop__spanStatus

          , SpanId = tostring(customDimensions.prop__spanId)

          , EventType = customDimensions.prop__eventType

          , EventStatus = customDimensions.prop__eventStatus

          , EventId = tostring(customDimensions.prop__eventId)

          , EntityType = customDimensions.prop__entityType

          , ClientRequestId = customDimensions.prop__clientRequestId

          , MessageId = customDimensions.prop__messageId

          , RecordId = customDimensions.prop__recordId

| project Timestamp

          , CorrelationId

          , SpanType

          , SpanStatus

          , EventType

          , EventStatus

          , EntityType

          , MessageId

          , RecordId
And here’s the query result. It says it was OK to receive the exercise data, but it failed to store it to Azure Table Storage.
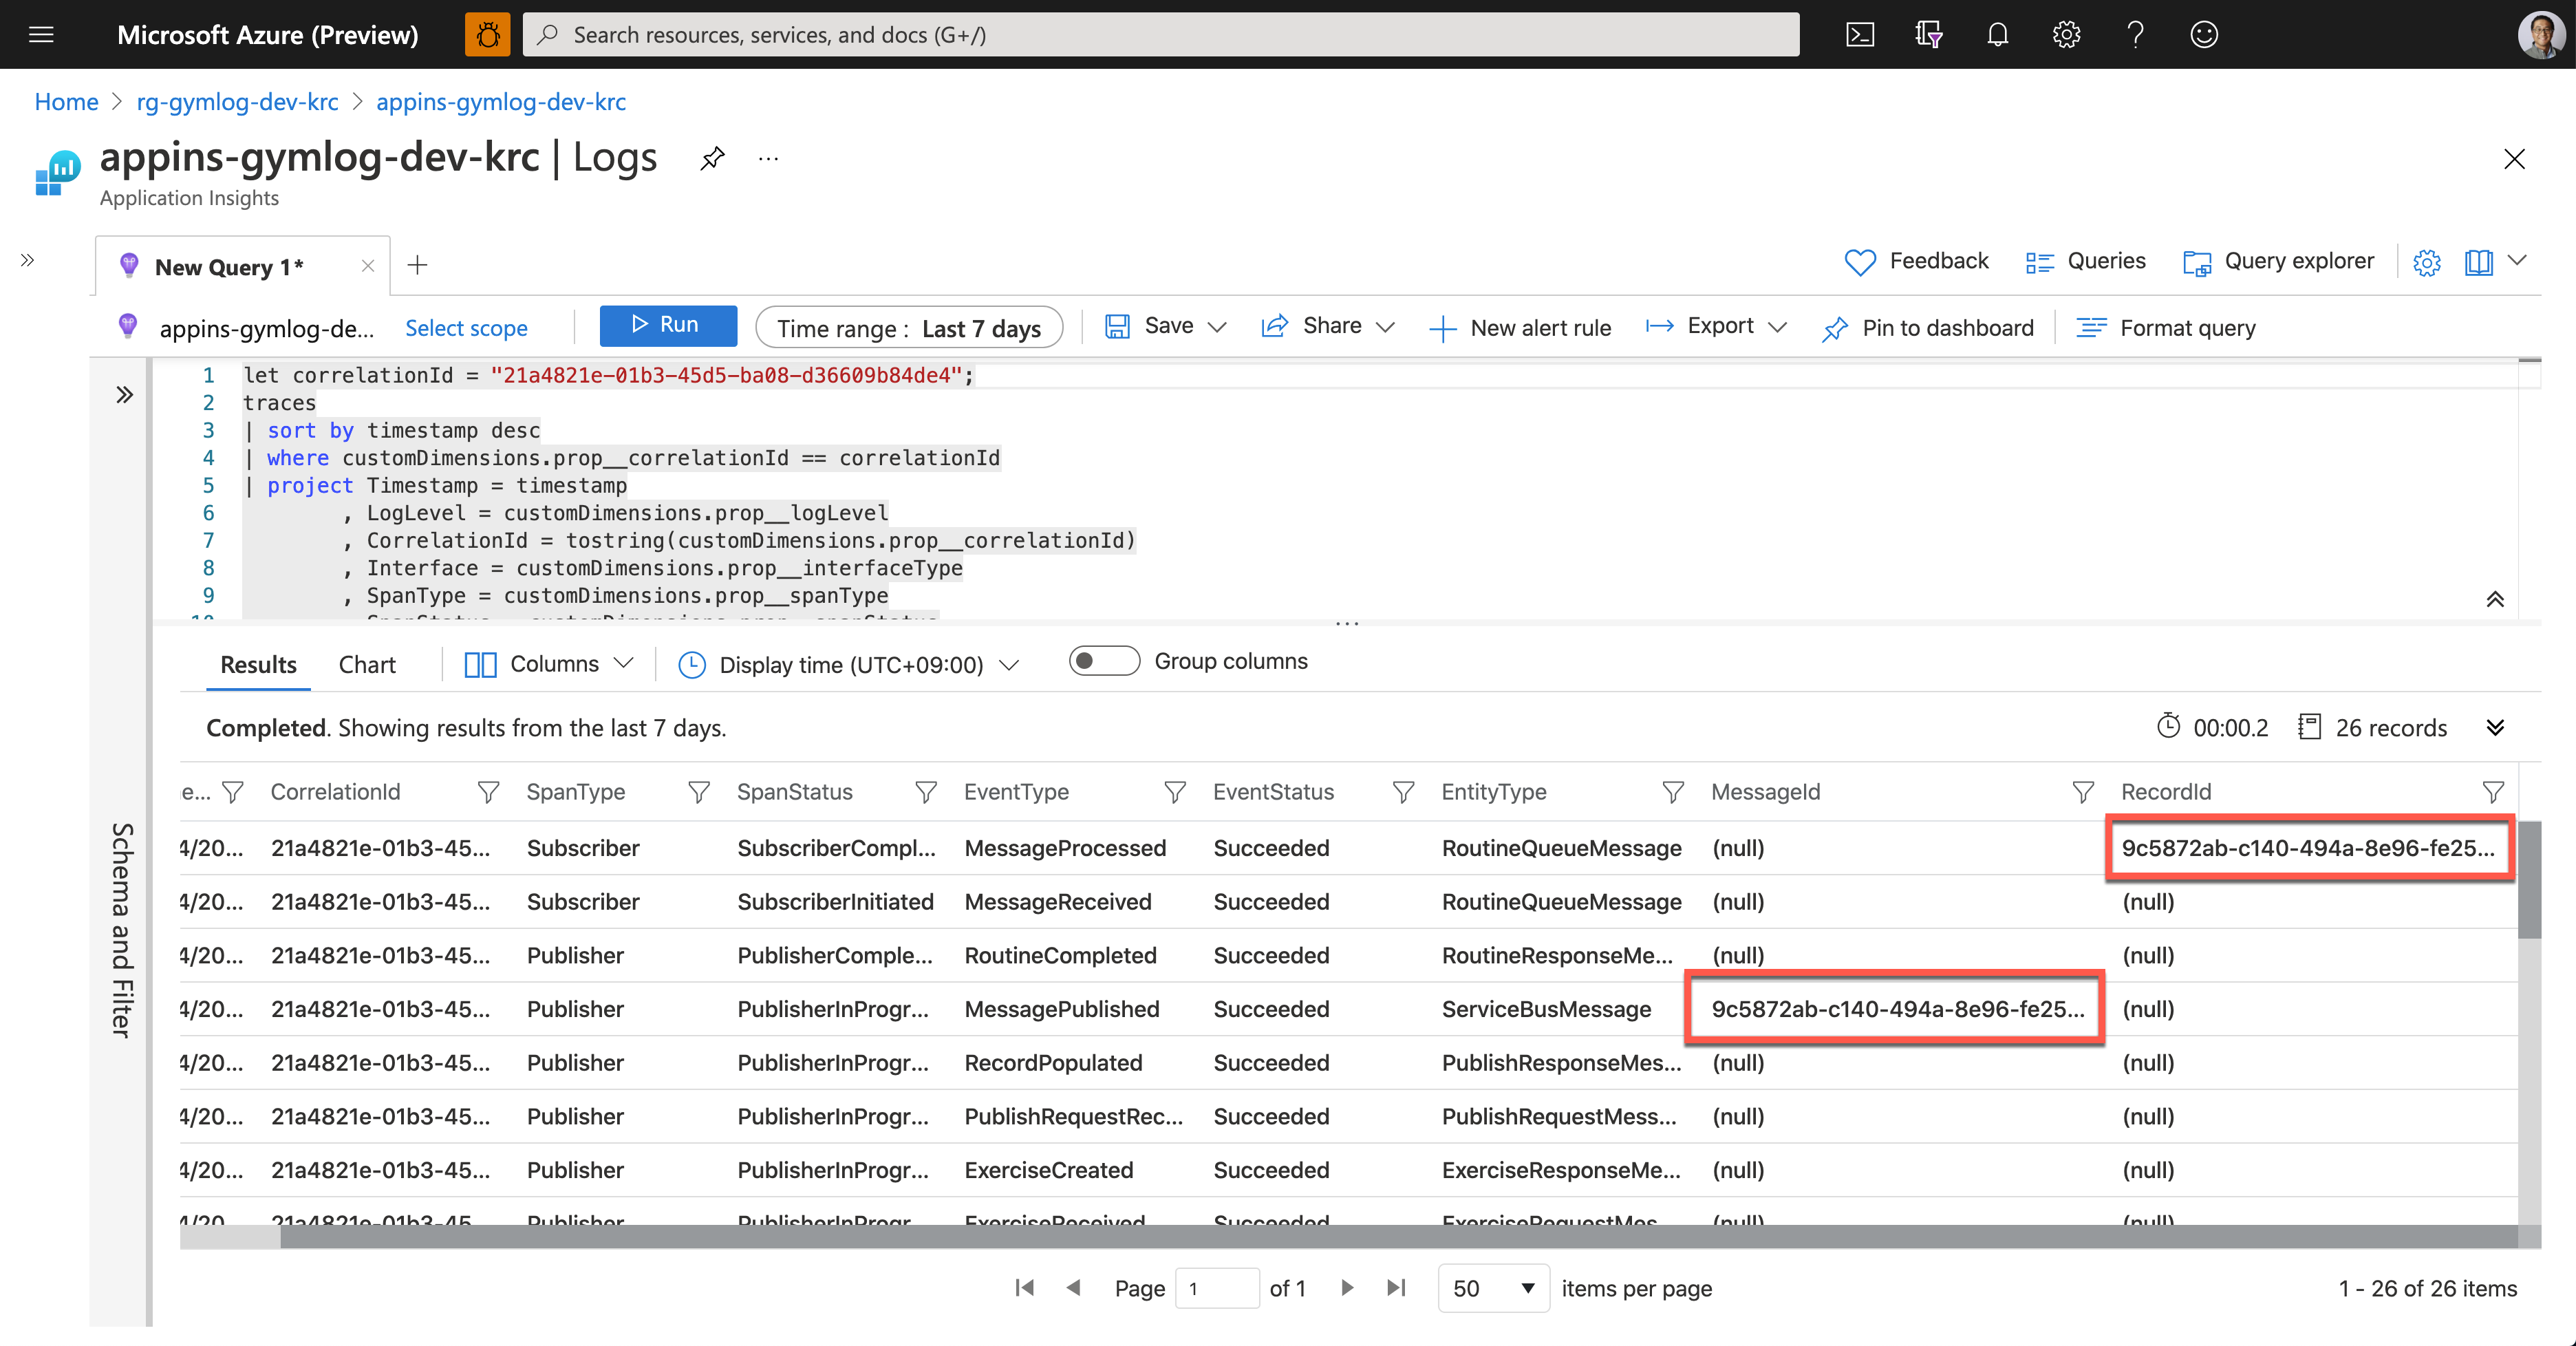
Now, Su Bin found out where the error has occurred. She fixed the code and deployed the API again, and all is good! The following screenshot shows one of the successful end-to-end tracking logs. A Message sent from Publisher has processed well on the Subscriber side, and the message has become a record based on the logic implemented on the Subscriber side.
So, we confirm that the data tracing logic has been implemented by following the Open Telemetry concepts through Application Insights. Ji Min and her trainer crews, and all the members in the gym are now able to know the reference ID for tracing.
So far, we’ve walked through the implementation of data tracing logic with the concept of Open Telemetry, from Power Apps to Cosmos DB through Application Insights.
Unfortunately, the OpenTelemetry.NET doesn’t work in Azure Functions as expected for now. But we can still implement the concept through Application Insights for the time being. In the next post, let’s try the DevOps journey with Power Apps.
This article was originally published on Dev Kimchi.
Brought to you by Dr. Ware, Microsoft Office 365 Silver Partner, Charleston SC.

Recent Comments