This article is contributed. See the original author and article here.
When monitoring the health of your applications written for Azure Sphere, you need to be able to diagnose bugs and errors. During application development, you can use a debugger, print statements, and similar tools to help find problems. However, when devices are deployed in the field, it becomes more challenging to debug an application, and a different approach is needed. For example, an application might unknowingly crash or exit, leaving you unable to detect the reason for the occurrence. Tools like the CLI command can help you gain a better understanding as to why your application crashed or reported an error.
We recently released additional documentation to help you interpret error reports, along with a new sample tutorial demonstrating how to analyze app crashes. Read on to find out about the new tools and additional ways to help make debugging easier in the future.
Automatically generated error reports
Whenever an issue occurs on your device, such as an app crash or an app exit, the device logs an error reporting event. These events are uploaded to the Azure Sphere Security Service (AS3) daily, and you can get a csv file containing the error reporting data by running azsphere tenant download-error-report. The csv file contains information on errors reported by devices in the current tenant from the last 14 days. The reports provide system-level error data that a traditional application would not be able to collect on its own. A sample error reporting entry in the csv is:
AppCrash (exit_status=11; signal_status=11; signal_code=3; component_id=685f13af-25a5-40b2-8dd8-8cbc253ecbd8;
image_id=7053e7b3-d2bb-431f-8d3a-173f52db9675)
This example shows an error event as it appears in the log. Here, an AppCrash occurred; the additional information includes the exit status, signal status, signal code, component id, and image id. These details are helpful when it comes to diagnosing an error in an application. See Collect and interpret error data in the Azure Sphere documentation to understand how to use this information to debug. Additional interpretation details have recently been added.
In addition to the CLI command azsphere tenant download-error-report, you can also use the Public API to acquire the same error reporting information. The API returns a JSON object, containing the same error reporting information as the csv, that you can parse according to your needs.

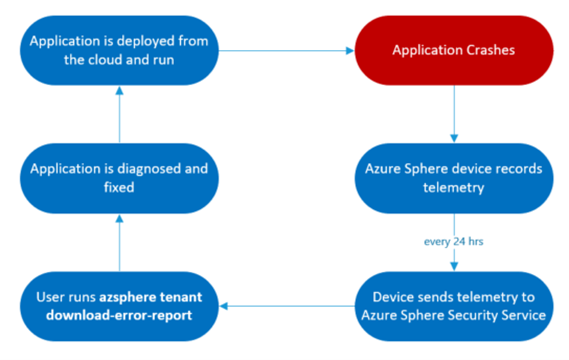
The typical lifecycle for using error reporting data to remotely detect a problem with your application in the field and deploy a fix OTA.
New tools for diagnosing applications
Azure Sphere recently released an Error Reporting Tutorial. This tutorial demonstrates how you can interpret expected app crashes and app. The tutorial lets you simulate application crashes and exits for an Azure Sphere and test the Azure Sphere error reporting functionality as well as experiment with sample error reporting data. Within 24 hours after you run the tutorial, you can download a csv that contains error reporting events, and you can then follow the instructions in Collect and interpret error data to learn how to use the csv to diagnose application failures.
Going forward
Exit codes
To further improve error diagnosis, try implementing exit codes in your application code. Exit codes are important as they are reported directly from the application and help you determine where something went wrong in your app. Location-specific exit codes identify exactly where the exit happened. The exit codes will appear in the error reports and can be compared with your code to better understand where the application exited and why. By following the steps and example in the exit codes documentation, you can easily implement exit codes and as a result be more equipped to debug and fix issues in the future. The highlighted portion of the sample error reporting entry below shows how exit codes appear in error reports:
AppExit (exit_code=0; component_id=685f13af-25a5-40b2-8dd8-8cbc253ecbd8;
image_id=0a7cc3a2-f7c2-4478-8b02-723c1c6a85cd)

Exit code definitions from the Error Reporting tutorial.
Watchdog timers
Another useful tool is the watchdog timer. If an application becomes unresponsive, the system timer will act as a watchdog and restart the application. When the watchdog is set and expires, it raises a SIGALRM signal that the application is purposely unable to handle. As a result, the application terminates (or crashes) and restarts. The highlighted portion of the sample error reporting entry below shows how a watchdog timer alarm appears in an error report. Signal status 14 corresponds to a SIGALRM, indicating that the application crashed because a watchdog expired:
AppCrash (exit_status=11; signal_status=14; signal_code=3; component_id=685f13af-25a5-40b2-8dd8-8cbc253ecbd8;
image_id=7053e7b3-d2bb-431f-8d3a-173f52db9675)
Next steps
We have updated and published documentation to assist you in diagnosing your Azure Sphere applications:
- For more information on the CLI command azsphere tenant download-error-report to acquire your error report in csv form see our Reference page (and Public API if you prefer to acquire a json object).
- See Collect and interpret error data to understand how to use the information provided in the report to diagnose your application.
- Try out the Error Reporting Tutorial for a demonstration on how you can interpret app crashes and app exits.
See the exit codes and watchdog timer documentation for ways to further assist yourself in the future when writing applications.
About Azure Sphere
Azure Sphere is a secured, high-level application platform with built-in communication and security features for internet-connected devices. It comprises a secured, connected, crossover microcontroller unit (MCU), a custom high-level Linux-based operating system (OS), and a cloud-based security service that provides continuous, renewable security.
- Need help? Connect with experts through the Azure Sphere forum or on Stack Overflow.
- Share product feedback and requests.
- Stay current with the latest Azure Updates.
Brought to you by Dr. Ware, Microsoft Office 365 Silver Partner, Charleston SC.

Recent Comments