This article is contributed. See the original author and article here.
With the evolving need to keep up with growing data volumes, increased data dependency on the business decision making process and the evolution of data platforms with Cloud Computing, enterprises have widely adopted Unified Analytics systems, Data Warehouses and Data Lakes to fulfil their data analytics and machine learning requirements. To that end, there are technologies to support a modern data warehouse architecture in Azure using platforms like Azure Synapse which is an analytics service that brings together enterprise data warehousing and Big Data analytics. While the modern data warehouse architecture is well poised to serve as a central data repository and to fulfil advanced analytics requirements for many enterprises, there is also a growing desire to be able to support a hybrid OLTP database / Datamart for a wide variety of reporting and data visualization needs to simply serve an enriched dataset.
Organizations have invested significantly in leveraging the work of data engineers and data scientists to perform complex data transformations and to produce meticulously crafted machine learning models to deliver invaluable business insights. Disparate datasets are put through a process of sophisticated transformation along with batch scoring / predictions derived from Machine Learning models whose resulting datasets are often required to be stored in relational databases (Operational Data Stores, HTAP databases, Fit-for-purpose Reporting Datamarts etc.). These are use cases where data scientists or data engineers want to be able to simply land and store computed data insights in a relational SQL database to make it easily available to downstream applications and data visualization tools. The purpose of these use cases is not to perform complex computations and aggregations that is best suited for Massively Parallel Processing (MPP) based data warehouses but to serve the transformed dataset to business users and applications via Symmetric-Multi Processing (SMP) SQL databases.
The objective of this article is to focus on a use case that demonstrates the integration between Azure Databricks and Azure SQL to deliver insights and data visualizations using a publicly available COVID-19 dataset. While Azure Databricks provides the distributed computing power to process and transform complex datasets, Azure SQL is a fitting recipient of the transformed dataset that surfaces these insights to business users.
Azure SQL is a family of fully managed, secure, and intelligent SQL database services that support a wide range of application patterns, from re-hosting and modernizing existing SQL Server workloads to modern cloud application development. With the SQL Server engine powering the Azure SQL family of database services, Azure SQL offers the best-in-class relational, transactional and hybrid analytics database services that truly meets the varying data demands of our customers.
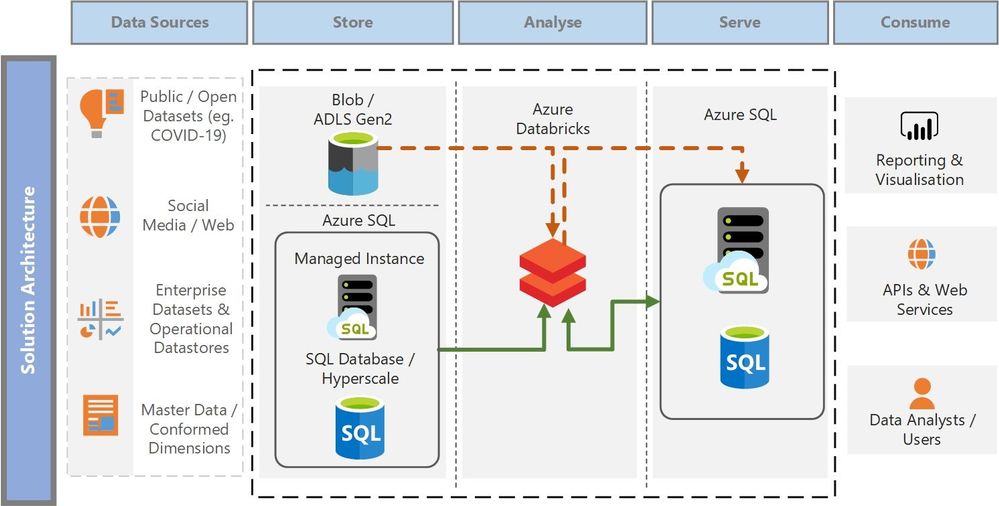
The architecture diagram below shows the various layers in a typical data analytics scenario and how Azure SQL can meet the requirements of both the storage layer (storing mission critical application transactions) and the serving layer (delivering pre-aggregated, transformed or predictive insights) that organizations need today. There are various technology services in Azure that can be overlayed on top of these generic architectural layers and we focus on one such pattern in this article that focusses on performing data transformation and producing machine learning predictive insights (using Azure Databricks) while serving the transformed datasets via a Datamart for visualizations and reporting (using Azure SQL).

Apache Spark Connector for SQL Server and Azure SQL
One of the key requirements of the architectural pattern above is to ensure we are able to read data seamlessly into Spark DataFrames for transformation and to write back the transformed dataset to Azure SQL in a performant manner. We recently open-sourced the Spark connector for SQL Server and Azure SQL that was announced here. The Spark connector for SQL Server and Azure SQL is a high-performance connector that enables you to use transactional data in big data analytics and persists results for ad-hoc queries or reporting.
Key features of this connector include:
- Support for all Spark bindings (Scala, Python, R).
- Basic authentication and Active Directory (AD) keytab support.
- Reordered DataFrame write support.
- Reliable connector support for single instance.
The connector can either be downloaded from this GitHub repo.
Solution Walkthrough
To immerse into a working solution to demonstrate the architectural pattern mentioned above, the solution uses a publicly available COVID-19 dataset and runs a machine learning model in Azure Databricks to predict the fatalities of COVID-19 per day in each country. These predictions are then transformed and written into a DataMart in Azure SQL Managed Instance for visualization and reporting. Azure SQL Managed Instance is just one of the services in the Azure SQL family and the same solution can be modified to use other services in Azure SQL.
The dataset is from COVID-19 Data Lake published on Microsoft Azure Open Datasets. The dataset is the latest available public data on geographic distribution of COVID-19 cases worldwide from the European Center for Disease Prevention and Control (ECDC). More information on the dataset and COVID-19 Data Lake can be found here.
The solution comprises of the following parts as described in the data flow below.

- The solution extracts the COVID-19 public dataset from the pandemic data lake into Azure Databricks as a Spark DataFrame.
- The extracted COVID-19 dataset is cleaned, pre-processed, trained and scored using a Gradient Boosted Trees (GBT) Machine Learning model. GBT is chosen to predict the deaths per day in each country purely for demonstration purposes only and should not be considered as the only model for such prediction
- The resulting dataset with the predicted scores is stored into a staging table in Azure SQL Managed Instance for further downstream transformation.
- Common data dimension tables and the staging tables from Azure SQL Managed Instance are read into DataFrames in Azure Databricks. Note the two Managed Instances shown in the “Store” and the “Serve” layer are essentially the same instance just depicted in different phases of the data flow. Azure SQL can play the role of both a data storage service and a data serving service for consuming applications / data visualization tools.
- The DataFrames containing the necessary dimension and staging data are further refined, joined and transformed to produce a denormalized fact table for reporting. Denormalization of data is highly recommended for reporting and data visualization as the data is structured in a way that optimizes performance of reporting queries and enables slicing-and-dicing of data as desired by business decision makers.
- The resulting denormalized data is written to Azure SQL Managed Instance (using the highly performant Spark connector for SQL Server and Azure SQL) which is ready to serve the data to its consumers.
Azure SQL Managed Instance Business Critical tier provides a readable secondary by default and is a fitting solution to read data off the replica while the primary is busy transacting from the application. The solution works just as good with the General Purpose tier except that there is no readable secondary by default (unless a Geo-Replica is provisioned) . Public endpoint for Azure SQL Managed Instance is securely enabled to allow Azure Databricks to connect to the instance. If there are security restrictions in your organization that prevents the usage of public endpoint, the solution will require Azure Databricks to be injected into a Vet and use one of the connectivity architectures either using VNet Peering or VNet-to-VNet VPN Gateway to establish connectivity between Azure Databricks and SQL MI.
The solution artefacts and a detailed walkthrough of the various steps are published here.
The transformed dataset can be visualized by data visualization tools like Power BI, consumed by APIs in downstream applications or even visualized in a Databricks notebook as shown below.

Note the predictions can be further refined by tuning the hyperparameters, by combining features from supplementary datasets and by leveraging other techniques to improve the accuracy of the model.
Conclusion
With continuous innovation to meet the growing demands of relational database services, Azure SQL offers the flexibility and deployment options to meet a wide variety of customers’ workloads ranging from real-time IoT streaming scenarios to business decision support systems with Hybrid Transactional and Analytical databases. This article touched upon one such scenario for interaction between predictive batch scoring using Azure Databricks and serving the data to consumers using Azure SQL. Find more scenarios and architectural references at the Azure Architecture Center.
Brought to you by Dr. Ware, Microsoft Office 365 Silver Partner, Charleston SC.

Recent Comments