by Contributed | Sep 23, 2020 | Azure, Technology, Uncategorized
This article is contributed. See the original author and article here.
SAP IQ High-Availability can be achieved with IQ Multiplex architecture [ SAP Note 2477758], but not when deployed in NLS mode. As per the SAP First Guidance for SAP IQ 16.x, here, Multiplex Architecture is not available/evaluated for the SAP-NLS solution. This blog discusses one of the solutions to achieve SAP IQ-NLS Highly Available Solution using Azure NetApp Files on SLES 12.x.
Overview
High availability architecture allows an application to be resilient against hardware failure and to minimise downtime during maintenance activities. Many customers use SAP IQ to store historical data by extracting the old data from the SAP BW system to optimise the performance of the SAP BW system & achieve overall lower cost. It is significant to implement SAP IQ highly-available architecture to ensure data is online when required by the business processes. We have worked with our partners [Accenture, Microsoft, SAP, SUSE] & customers to develop a highly available SAP IQ-NLS solution using Pacemaker along with other Clustering Components & Azure NetApp Files to eliminates a single point of failure. With this architecture servers [VM’s] are continuously monitored, and the workload is transferred to a healthy server when a fault or failure occurs using Azure Standard Load Balancer. The application is automatically restarted on a known healthy system to maintain business continuity and minimize unplanned downtime.
There is no official SAP IQ-NLS HA architecture reference from SAP or SUSE, and therefore, a custom solution must be created to achieve a solution to meet customer needs. The complete solution has been built and tested on the Microsoft Azure Cloud.
Architectural Overview

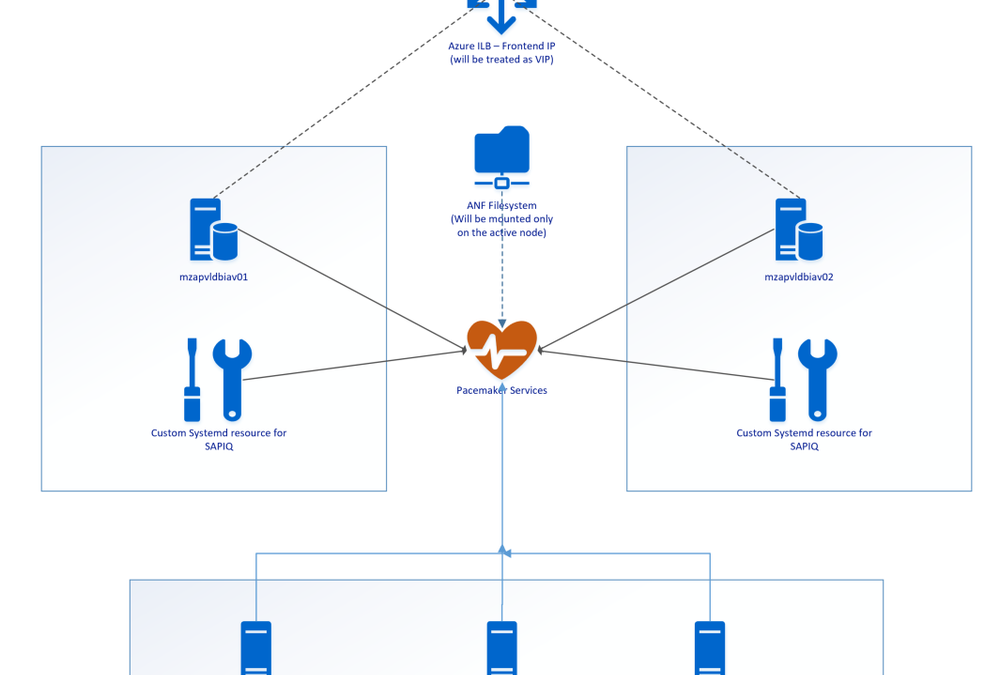
SAP IQ High-Availability Architecture on Azure VMs using Azure NetApp Files on SUSE Linux Enterprise Server.
Above SAP IQ-NLS Architecture contains:
- Two Azure VMs (mzapvldbiav01 & mzapvldbiav02) running with SLES 12 SP4 for SAP.
- Three Azure VMs (mzapvlapsbd01, mzapvlapsbd02 & mzapvlapsbd03) running with SLES 12 SP4 for SAP with iSCSI Components which will be used as STONITH (SBD Devices) for Pacemaker Cluster Fencing.
- iav-ilb-sybase : Azure load balancer which will monitor health probe port and forward the traffic to the node where this health probe port is active.
The Cluster includes following resources:
- systemd:sapiq : Cluster resource for custom systemd service controlling sapiq database. Custom Systemd unit file which will take care of Start, Stop and Health check for Sybase IQ Database.
- azure_lb_health_probe : Cluster resources which create and listens custom port only on the active node.
- pri-ip_vip_63 : Cluster resource for floating IP which will be running only on the active node and works as virtual IP.
- anf_filesystem : Cluster resource containing shared azure netapp filesystem information to enable mounting filesystems only on the active node
- email-agent : Cluster resource which will trigger an email to recipients if any resource changes status like start, stop etc.
Installation & Configuration Steps
- Configuring iSCSI Target Servers
- Create iSCSI devices on iSCSI target server
- iSCSI Discovery on Cluster Nodes
- Set up SBD Device on Cluster Nodes
- Preparing operating system on cluster nodes
- Cluster Installation
- Joining Nodes to Cluster
- Tuning Cluster Configuration
- Preparing Custom Scripts for systemd service
- ANF Shared Filesystem Configuration
- Cluster Configuration
1. Configuring iSCSI Target Servers
Reference Link: https://docs.microsoft.com/en-us/azure/virtual-machines/workloads/sap/high-availability-guide-suse-pacemaker#set-up-iscsi-target-servers
The following Steps needs to be repeated on all iSCSI Target Servers
Step 1: Update SLES
Step 2: Remove packages
|
sudo zypper remove lio-utils python-rtslib python-configshell targetcli
|
Step 3: Install iSCSI target packages
|
sudo zypper install targetcli-fb dbus-1-python
|
Step 4: Enable the iSCSI target service
|
sudo systemctl enable targetcli
sudo systemctl start targetcli
|
2. Create iSCSI devices on iSCSI target server
Reference Link: https://docs.microsoft.com/en-us/azure/virtual-machines/workloads/sap/high-availability-guide-suse-pacemaker#create-iscsi-device-on-iscsi-target-server
The following Steps needs to be repeated on all iSCSI Target Servers
Step 1: Create the root folder for sbd devices
Step 2: Create the SBD device for Cluster Nodes on all iSCSI target servers
|
targetcli backstores/fileio create sbdiav /sbd/sbdiav 50M write_back=false
|
|
targetcli iscsi/ create iqn.2006-04.sbd01.domain.net:iav
|
- Adding iSCSI disks to the TPG
|
targetcli iscsi/iqn.2006-04.sbd01.domain.net:iav/tpg1/luns/ create /backstores/fileio/sbdiav
|
- Allow iSCSI initiators to connect to the iSCSI target.
|
targetcli iscsi/iqn.2006-04.sbd01.domain.net:iav/tpg1/acls/ create iqn.1996-04.de.suse:01:19b9f6iav01
|
|
targetcli iscsi/iqn.2006-04.sbd01.domain.net:iav/tpg1/acls/ create iqn.1996-04.de.suse:01:19b9f6iav02
|
Step 3: Save the targetcli changes
|
sudo targetcli saveconfig
|
Step 4: Confirm the changes
Step 5: Perform Steps 1 – 4 on all iSCSI Target Servers with their respective iqn.
|
targetcli iscsi/ create iqn.2006-04.xxx.domain.net:iav
|
3. iSCSI Discovery on Cluster Nodes
Reference Link: https://docs.microsoft.com/en-us/azure/virtual-machines/workloads/sap/high-availability-guide-suse-pacemaker#set-up-sbd-device
Step 1: Enable the iSCSI and SBD services on Cluster Nodes.
|
sudo systemctl enable iscsid
sudo systemctl enable iscsi
sudo systemctl enable sbd
|
Step 2: Change the initiator name on Cluster Nodes
|
sudo vi /etc/iscsi/initiatorname.iscsi
|
Initiator name should be unique on each server.
Step 3: Restart the iSCSI service on Cluster Nodes
|
sudo systemctl restart iscsid
sudo systemctl restart iscsi
|
Step 4: Connect the iSCSI devices
|
iscsiadm -m discovery –type=st –portal=170.162.93.128:3260
|
|
iscsiadm -m node -T iqn.2006-04.sbd03.domain.net:iav –login –portal=170.162.93.128:3260
|
|
iscsiadm -m node -p 170.162.93.128:3260 –op=update –name=node.startup –value=automatic
|
Step 5: Verify iSCSI Sessions
Step 6: Verify if disks are available on Cluster Nodes
Step 7: Retrieve the IDs of the iSCSI devices on Cluster Nodes
|
ls -l /dev/disk/by-id/scsi-* | grep 3600*
|
4. Set up SBD Device on Cluster Nodes
Reference Link: https://docs.microsoft.com/en-us/azure/virtual-machines/workloads/sap/high-availability-guide-suse-pacemaker#set-up-sbd-device
Step 1: Create the SBD Device on Cluster Nodes
|
sudo sbd -d /dev/disk/by-id/scsi-360014052328283facd444a1994a65cf2 -1 60 -4 120 create
|
Step 2: Adapt the SBD Config on First Node in the Cluster
|
sudo vi /etc/sysconfig/sbd
|
Populate the following parameters within the sbd file
|
[…]
SBD_DEVICE=”/dev/disk
/by-id/scsi-36001405afb0ba8d3a3c413b8cc2cca03;/dev/disk/by-id/scsi-360014053fe4da371a5a4bb69a419a4df”
[…]
SBD_PACEMAKER=”yes”
SBD_STARTMODE=”clean”
SBD_DELAY_START=”yes”
|
Note: SBD_STARTMODE=”clean”, this will not allow any node to join to the cluster once node is fenced or rebooted. This is part of the Solution Requirement.
Step 3: Create the softdog configuration file
|
echo softdog | sudo tee /etc/modules-load.d/softdog.conf
|
Step 4: Now load the module
5. Preparing Operating System on cluster nodes
Reference Link: https://docs.microsoft.com/en-us/azure/virtual-machines/workloads/sap/high-availability-guide-suse-pacemaker#cluster-installation
Step 1: Perform system update on all Cluster Nodes
Step 2: Install components needed for Cluster resources on all Cluster Nodes
Step 3: Configure the operating system on all Cluster Nodes
Increase the maximum allowed processes
Edit the configuration file
|
sudo vi /etc/systemd/system.conf
|
Change the DefaultTasksMax
to
Activate this setting
|
sudo systemctl daemon-reload
|
Test if the change was successful
|
sudo systemctl –no-pager show | grep DefaultTasksMax
|
Step 4: Reduce the size of the dirty cache on all Cluster Nodes
Change/set the following settings
|
vm.dirty_bytes = 629145600
vm.dirty_background_bytes = 314572800
|
Step 5: Configure NTP on all cluster nodes and confirm
stop ntpd daemon
edit the /etc/ntp.conf to make appropriate entries of NTP servers.
|
server xxx.xxx.xxx.xxx iburst
|
Now start the ntp daemon.
check the NTP status
6. Cluster Installation
Reference Link: https://docs.microsoft.com/en-us/azure/virtual-machines/workloads/sap/high-availability-guide-suse-pacemaker#cluster-installation
Step 1: Install Cluster on first node
|
ha-cluster-init –name cls_iqdb_iav
|
Step 2: Respond to the following on-screen instructions
|
# /root/.ssh/id_rsa already exists – overwrite (y/n)? n
# Address for ring0 [10.0.0.6] Press ENTER
# Port for ring0 [5405] Press ENTER
# SBD is already configured to use/dev/disk/by-id/scsi-36001405afb0ba8d3a3c413b8cc2cca03 – overwrite (y/n)? n
# Do you wish to configure an administration IP (y/n)? n
|
7. Joining Nodes to Cluster
Reference Link: https://docs.microsoft.com/en-us/azure/virtual-machines/workloads/sap/high-availability-guide-suse-pacemaker#cluster-installation
Step 1: Add Secondary node to cluster
Step 2: Respond to the following on-screen instructions
|
Do you want to continue anyway (y/n)? y
IP address or hostname of existing node (e.g.: 192.168.1.1) []xxx.xxx.xxx.xxx
root/.ssh/id_rsa already exists – overwrite (y/n)? y
|
8. Tuning Cluster Configuration
Reference Link: https://docs.microsoft.com/en-us/azure/virtual-machines/workloads/sap/high-availability-guide-suse-pacemaker#cluster-installation
Step 1: Change hacluster password on all cluster nodes
Step 2: Adjust corosync settings on First Node
|
sudo vi /etc/corosync/corosync.conf
|
Change token to 30000 and consensus to 36000
|
[…]
token: 30000
token_retransmits_before_loss_const: 10
join: 60
consensus: 36000
max_messages: 20
|
Restart the corosync service
|
sudo service corosync restart
|
9. Preparing Custom Scripts for systemd service
Step 1: Create Systemd Service which can initiate start and stop scripts of the SAP IQ DB and place it under /etc/systemd/system/
|
vi /etc/systemd/system/sapiq.service
|
sapiq.service should contain the following
|
[Unit]
Description=SAP IQ DB
[Service]
Type=simple
ExecStart=/bin/bash /usr/bin/sapiq_start.sh
ExecStop=/bin/bash /usr/bin/sapiq_stop.sh
Restart=on-failure
[Install]
WantedBy=multi-user.target
|
When Start initiated on sapiq.service, the following script will be called
|
ExecStart=/bin/bash /usr/bin/sapiq_start.sh
|
When Stop initiated on sapiq.service, the following script will be called
|
ExecStop=/bin/bash /usr/bin/sapiq_stop.sh
|
Step 2: Creating sapiq_start.sh & sapiq_stop.sh
sapiq_start.sh:
|
#!/bin/bash
runuser -l siqiav -c ‘start_siq’
sleep 20
while [ 1 ]
do
pid=$(ps -ef | grep iqsrv16 | grep -v grep | awk ‘{print $2}’)
if [ “$pid” != “” ]
then
echo “Process iqsrv16 is running”
dsn=$(runuser -l siqiav -c ‘dbping -d -c dsn=SAPIQDB_IAV’ | grep Connected | awk ‘{print $1}’)
if [ “$dsn” == “Connected” ]
then
echo “Database can be reached using DBPING with DSN”
else
echo “iqsrv16 Process is there but unable to ping DSN using DBPING…. Exiting”
exit
fi
else
echo “Process iqsrv16 is not there…. Exiting”
exit
fi
sleep 3
done
|
Note: Contact your NLS Admin for DSN Value (SAPIQDB_IAV, in this case) and replace the same in the above script.
sapiq_stop.sh:
|
runuser -l siqiav -c ‘stop_siq’
|
The above two scripts should be placed under /usr/bin
10. ANF Shared Filesystem Configuration
Reference Link: https://docs.microsoft.com/en-us/azure/virtual-machines/workloads/sap/sap-hana-scale-out-standby-netapp-files-suse#operating-system-configuration-and-preparation
Step 1: Prepare the OS for running SAP IQ NLS on NetApp Systems with NFS
Create configuration file /etc/sysctl.d/netapp-hana.conf for the NetApp configuration settings.
|
vi /etc/sysctl.d/netapp-hana.conf
|
|
Within the file, keep the below entries
|
net.core.rmem_max = 16777216
net.core.wmem_max = 16777216
net.core.rmem_default = 16777216
net.core.wmem_default = 16777216
net.core.optmem_max = 16777216
net.ipv4.tcp_rmem = 65536 16777216 16777216
net.ipv4.tcp_wmem = 65536 16777216 16777216
net.core.netdev_max_backlog = 300000
net.ipv4.tcp_slow_start_after_idle=0
net.ipv4.tcp_no_metrics_save = 1
net.ipv4.tcp_moderate_rcvbuf = 1
net.ipv4.tcp_window_scaling = 1
net.ipv4.tcp_timestamps = 1
net.ipv4.tcp_sack = 1
|
Step 2: Create configuration file /etc/sysctl.d/ms-az.conf with Microsoft for Azure configuration settings.
|
vi /etc/sysctl.d/ms-az.conf
|
|
Within the file, keep the below entries
|
ipv6.conf.all.disable_ipv6 = 1
net.ipv4.tcp_max_syn_backlog = 16348
net.ipv4.ip_local_port_range = 40000 65300
net.ipv4.conf.all.rp_filter = 0
sunrpc.tcp_slot_table_entries = 128
vm.swappiness=10
|
Step 3: Adjust the sunrpc settings
|
vi /etc/modprobe.d/sunrpc.conf
|
|
Within the file, keep the below entries
|
options sunrpc tcp_max_slot_table_entries=128
|
Step 4: Ensure to set the NFS domain in /etc/idmapd.conf on the VM to match the default domain configuration on Azure NetApp Files: defaultv4iddomain.com.
11. Cluster Configuration
Following cluster resources needs to be configured
- Floating IP: Configure Virtual IP which is always available on active node. Here we need to use frontend IP address of Azure Load balancer as Floating IP in Cluster.
|
primitive pri-ip_vip_63 IPaddr2
params ip=170.162.92.63 cidr_netmask=24 nic=eth0
op monitor interval=0
|
- Health Probe Port: Configure 61000 as health probe port which is always available on active node. Azure Load Balancer always monitor this port and sends the traffic to the node where this port is running.
|
primitive azure_lb_health_probe azure-lb
params port=61000
|
- Systemd Service: Cluster Primitive which controls start & stop operations of SAP IQ Database.
|
primitive pri-sapiq_systemd systemd:sapiq
op start timeout=40 interval=0
op stop timeout=40 interval=0
op monitor timeout=100 interval=10
|
- ANF Shared Filesystems: Individual Cluster Primitive for each ANF Shared filesystem for log, system, dbspace & database. These four filesystems will be shared between two cluster nodes.
|
primitive anf_filesystem Filesystem
params device=”170.162.118.4:/Database” directory=”/usr/sap/IAV” fstype=nfs options=”rw,vers=4,minorversion=1,hard,sync,timeo=600,rsize=65536,wsize=65536,intr,noatime,lock,_netdev,sec=sys”
op stop timeout=60s interval=0
op start timeout=60s interval=0
op monitor interval=20s timeout=40s
|
- Email Alerting: One of the easiest ways to get notifications of any cluster resource events is to add a ClusterMon resource. Whenever any resource is started or stopped, the ClusterMon resource will send notification to the custom script which will trigger email to configured recipients.
|
primitive email-agent ClusterMon
params extra_options=”-E /usr/bin/crm_email.sh -e xxxx@xxxx.com”
|
|
And clone the resource “email-agent”
|
clone cln_email-agent email-agent
|
|
Post-Configurations
Create the custom script and place under /usr/bin
Within the file, place the following content
|
#!/bin/bash
MAIL_TO=”xxxx@xxxx.com”;
SUBJECT=”!!! ATTENTION NEEDED !!! CLUSTER-ALERT on ${CRM_notify_node}”;
echo “$MESSAGE”|mailx -s “$SUBJECT” “$MAIL_TO” <<EOF
———————– CLUSTER EVENT TRIGGERED:
Node: ${CRM_notify_node}
Resource Affected: ${CRM_notify_rsc}
Action on Resource: ${CRM_notify_task}
———————– CURRENT CLUSTER STATUS:
$(crm status)
—————————————————
This mail has been generated automatically
EOF
|
|
- Grouping of Resources: Grouping of resources will make all child resources to start or stop together on same node.
Grouping resources which includes ANF Filesystem, Floating IP, Health Probe Port & Systemd service. In this case, group name is “grp_anf-sapiq_systemd-azure_lb-vip_6” with migration threshold set to 1**.
|
group grp_anf-sapiq_systemd-azure_lb-vip_63 anf_filesystem pri-sapiq_systemd azure_lb_health_probe pri-ip_vip_63
meta target-role=Started migration-threshold=1
|
** Migration threshold will allow resource to restart on failure with the provided value on the same node.
- Order Constraint: As the group containing systemd resource rely on shared file system to start the database, file system group should start before the group with systemd resource then health probe and virtual IP must start.
|
order ord_anf-sapiq_systemd-azure_lb-vip_63 inf: anf_filesystem pri-sapiq_systemd azure_lb_health_probe pri-ip_vip_63
|
- Resource Stickiness: This is to prevent healthy resources from being moved around the cluster.
|
rsc_defaults rsc-options:
resource-stickiness=1000
|
Note: Defaults don’t apply to resources which overwrite them with their own defined resource stickiness value.
Complete CRM Configuration as follows
primitive anf_filesystem Filesystem
params device=”170.162.118.4:/Database” directory=”/usr/sap/IAV” fstype=nfs options=”rw,vers=4,minorversion=1,hard,sync,timeo=600,rsize=65536,wsize=65536,intr,noatime,lock,_netdev,sec=sys”
op stop timeout=60s interval=0
op start timeout=60s interval=0
op monitor interval=20s timeout=40s
mzapvldbiav01:~ # crm configure show pri-ip_vip_63
primitive pri-ip_vip_63 IPaddr2
params ip=170.162.92.63 cidr_netmask=24 nic=eth0
op monitor interval=0
mzapvldbiav01:~ # crm configure show grp_anf-sapiq_systemd-azure_lb-vip_63
group grp_anf-sapiq_systemd-azure_lb-vip_63 anf_filesystem pri-sapiq_systemd azure_lb_health_probe pri-ip_vip_63
meta target-role=Started migration-threshold=2
mzapvldbiav01:~ # crm configure show
node 1: mzapvldbiav02
node 2: mzapvldbiav01
primitive anf_filesystem Filesystem
params device=”170.162.118.4:/Database” directory=”/usr/sap/IAV” fstype=nfs options=”rw,vers=4,minorversion=1,hard,sync,timeo=600,rsize=65536,wsize=65536,intr,noatime,lock,_netdev,sec=sys”
op stop timeout=60s interval=0
op start timeout=60s interval=0
op monitor interval=20s timeout=40s
primitive azure_lb_health_probe azure-lb
params port=61000
primitive email-agent ClusterMon
params extra_options=”-E /usr/bin/crm_email.sh -e ramesh.petla@accenture.com”
meta target-role=Started
primitive pri-ip_vip_63 IPaddr2
params ip=170.162.92.63 cidr_netmask=24 nic=eth0
op monitor interval=0
primitive pri-sapiq_systemd systemd:sapiq
op start timeout=60 interval=0
op stop timeout=60 interval=0
op monitor timeout=100 interval=10
primitive stonith-sbd stonith:external/sbd
params pcmk_delay_max=30s
meta target-role=Started
op start interval=0
group grp_anf-sapiq_systemd-azure_lb-vip_63 anf_filesystem pri-sapiq_systemd azure_lb_health_probe pri-ip_vip_63
meta target-role=Started migration-threshold=2
clone cln_email-agent email-agent
order ord_anf-sapiq_systemd-azure_lb-vip_63 inf: anf_filesystem pri-sapiq_systemd azure_lb_health_probe pri-ip_vip_63
property cib-bootstrap-options:
have-watchdog=true
dc-version=”1.1.19+20181105.ccd6b5b10-3.16.1-1.1.19+20181105.ccd6b5b10″
cluster-infrastructure=corosync
cluster-name=cls_iqdb_iav
stonith-enabled=true
last-lrm-refresh=1594989262
maintenance-mode=false
rsc_defaults rsc-options:
resource-stickiness=1000
op_defaults op-options:
timeout=600
record-pending=true
Monitoring and Managing the Cluster
CRM Status: The status of the cluster can be checked by issuing command “crm status”

CRM Monitoring: Real time changes in the cluster can be monitored continuously by issuing command “crm_mon” on any node which is part of cluster.

The above similar things can be monitored using HAWK Web Console.
To access HAWK Console, enter the following URL with username “hacluster”
|
https:// 170.162.92.63:7630/
|
where 170.162.92.63 is the ip address of any cluster node or virtual IP.
Resources Status:

Node Status:

Node Cleanup Script: Whenever nodes reboots because of Kernel Panic or any other issues, run the crm_node_cleanup.sh script which is placed under /usr/bin to clean the node so that it can join to Cluster.
For mzapvldbiav01:
|
#!/bin/bash
sbd -d /dev/disk/by-id/scsi-360014052328283facd444a1994a65cf2 message mzapvldbiav01 clear
sbd -d /dev/disk/by-id/scsi-360014052752bf5ef8d14b308cf29c3f5 message mzapvldbiav01 clear
sbd -d /dev/disk/by-id/scsi-3600140557a61ec52d994744872c42246 message mzapvldbiav01 clear
crm cluster start
crm_mon
|
For mzapvldbiav02:
|
#!/bin/bash
sbd -d /dev/disk/by-id/scsi-360014052328283facd444a1994a65cf2 message mzapvldbiav02 clear
sbd -d /dev/disk/by-id/scsi-360014052752bf5ef8d14b308cf29c3f5 message mzapvldbiav02 clear
sbd -d /dev/disk/by-id/scsi-3600140557a61ec52d994744872c42246 message mzapvldbiav02 clear
crm cluster start
crm_mon
|
The above scripts are made only for saving time, otherwise, one can run individual commands to clear node messages.
Testing Scenarios
Scenario 1: Stop database on mzapvldbiav01
Stop the IQ DB on database mzapvldbiav01 gracefully. This should failover the database into mzapvldbiav02 and promote it as a master.
The cluster detects the stopped primary IQ database (on mzapvldbiav01) and marks the resource failed. The cluster promotes the secondary IQ NLS database (on mzapvldbiav02) to take over as primary. The cluster migrates the IP address to the new primary (on mzapvldbiav02). The cluster “failed actions” are cleaned up after following the recovery procedure.
Before Test: Cluster Status

Stopping Database:

After Failover:

Resource Cleanup: As the resource pri-sapiq_systemd is failed to restart on mzapvldbiav01, need to perform resource cleanup on mzapvldbiav01 for pri-sapiq_systemd. So next time if mzapvldbiav02 is down for some reason, resource can migrate to mzapvldbiav01 without any issues.

Cockpit View:

Scenario 2: Crash mzapvldbiav01
Simulate a site crash situation using kernel panic (echo ‘b’ > /proc/sysrq-trigger) on database server mzapvldbiav01. This should failover the cluster resources to mzapvldbiav02.
The cluster detects the failure on mzapvldbiav01 and declares it UNCLEAN. The cluster fences mzapvldbiav01. The cluster declares the failed node mzapvldbiav01 as OFFLINE. The cluster promotes the secondary IQ database on mzapvldbiav02 as active.
Before Test: Cluster Status

Simulate Kernel Panic on mzapvldbiav01:

After Failover:

As SBD fencing is used, we need to clear reset message on mzapvldbiav01 once root cause for kernel panic is identified and fixed. The reset message can be cleared with the help of the script /usr/bin/crm_node_cleanup.sh on respective nodes.

After Cleanup:

The node mzapvldbiav01 status will change to Online from Offline.
Cockpit View:

Troubleshooting
Resource Fail count Cleanup: Resource needs to be cleaned if any resource has failed errors like follows

In the above screenshot, we have errors associated with systemd resource “pri-sapiq_systemd”
|
crm resource cleanup pri-sapiq_systemd
|
Clearing Temporary Constraints: When we move any resource to other node manually, then location constraints will be created. These needs to be cleared if we need cluster to handle resource movement operations automatically.
|
crm resource clear pri-sapiq_systemd
|

Log Files:
Pacemaker Log File:
The systemd journal can be used to retrieve Pacemaker logs:
|
journactl -lf -u pacemaker
|

Alternatively, /var/log/messages can be referred for other errors
Decision Tree

by Contributed | Sep 23, 2020 | Azure, Technology, Uncategorized
This article is contributed. See the original author and article here.
Azure SQL Managed Instance is a fully-managed, secure, and always up-to-date SQL instance in the cloud. It provides state-of-the-art capabilities and industry-leading SLAs, allowing you to easily migrate and modernize your mission-critical applications in Azure.
Azure SQL Managed Instance is constantly being improved based on the customer feedback. There are many important updates to Managed Instances that will be launched as part of Ignite 2020 virtual conference (more details to follow in the upcoming blog posts), but in this post we’ll go deeper into the recent improvements in the areas of performance and cost efficiency.
Significantly improved transaction log write throughput
We have significantly improved the transaction log write throughput (often referred to as “log rate”) for the Azure SQL Managed Instances, greatly improving the overall performance for usage scenarios such as data ingestion and index maintenance.
The following table and the diagram summarize the improvements:
|
|
Previous log rate limit
|
New log rate limit
|
|
General Purpose
|
3 MB/s per vCore
Up to 22 MB/s per instance
|
3 MB/s per vCore
Up to 120 MB/s per instance
Per-database cap of 22-65 MB/s
|
|
Business Critical
|
4 MB/s per vCore
Up to 48 MB/s per instance
|
4 MB/s per vCore
Up to 96 MB/s per instance
|
General Purpose instances now have more than 5x larger per-instance log rate cap compared to the previous setting (120 MB/s versus 22 MB/s). However, the per-instance log rate cap cannot be achieved by a single database. The per-database log rate cap depends on the log file size (as explained in this blog post), and can go from 22 MB/s to 65 MB/s, as per the summary in the following table:
|
Log file size
(SQL MI General Purpose)
|
Log rate limit
|
|
<= 128 GB
|
22 MB/s
|
|
<= 512 GB
|
30 MB/s
|
|
<= 1 TB
|
50 MB/s
|
|
<= 2 TB
|
65 MB/s
|
The significantly improved log rate makes the General Purpose service tier an ideal candidate for hosting smaller (<8 TB in size) data marts and warehouses, due to greatly improved data loading speed.
When it comes to Business critical instances, the log rate cap is flat out doubled from 48 MB/s to 96 MB/s, with no per-database cap limitations (i.e. a single database on a Business Critical instance can use up the whole 96 MB/s log rate quota).
Improved data and log IOPS for Business Critical instances
Business Critical instances now have significantly improved IOPS rates for data and log operations. Previous limit of 2500 IOPS per vCore is now increased to 4000 IOPS per vCore, providing a fantastic 60% increase.
Improved IOPS rate will make the Business Critical tier an even better fit for the high-volume transactional processing workloads (OLTP scenarios).
Improved performance predictability for General Purpose instances
In one of our previous blogs we’ve shared the details on how the storage subsystem of General Purpose Managed Instances is designed. Essentially, we’re using remote storage (Azure Storage Premium Disks) to store the database and log files. While this design is both simple and scalable, it presents an interesting set of challenges since every disk I/O in Azure SQL Managed Instance becomes a network I/O against another Azure service.
We’ve taken great care to optimize the integration with Azure Storage to maximize the throughput, reduce the latency and improve the performance predictability. Our I/O scheduling, throttling and governance algorithms have been tweaked to ensure the smoothest possible experience for our customers.
Improved tempdb performance
Previously, the tempdb I/O operations were governed as part of the instance log rate cap (which used to be configured to 22 MB/s for General Purpose and 48 MB/s for Business Critical). With this set of improvements, tempdb I/O operations are no longer governed as part of the instance log rate cap, allowing for a significantly higher tempdb I/O rates.
The improved tempdb performance will greatly improve the speed of tempdb-bound operations, such as running queries with large sorts/spills, or data loading through tempdb.
Testing Results
When all the above improvements are combined, the end-result is a significant improvement to the performance of your SQL Managed Instance. The exact performance gain will vary based on your chosen service tier and your database workloads, but the improvements we’ve seen based on our testing are very encouraging:
- TPC-C – up to 2x-3x transaction throughput
- TPC-H – up to 23% lower test execution time
- Scans – up to 2x throughput
- Data Ingestion – 2x-3x data ingestion rate
More bang for your buck
These improvements are a fantastic value for our customers since there are no associated pricing changes. Basically, we’ve upgraded the “horsepower” of the SQL MI engine for no extra charge, providing an even better value for your investment.
Also, these changes were automatically enabled for all existing and future Azure SQL Managed Instances during the first half of September – we expect our customers will be pleasantly surprised when they discover this.
Conclusion
These performance improvements make Azure SQL Managed Instance an excellent choice for your performance-hungry database workloads.
And if you’re still new to Azure SQL Managed Instance, now is a great time to get started and take Azure SQL Managed Instance for a spin!
References
- For more details on Azure SQL Managed Instance resource limits, check out the public documentation
- For details on other improvements to Azure SQL Managed Instance launched at Ignite 2020, please see this blog
by Contributed | Sep 23, 2020 | Uncategorized
This article is contributed. See the original author and article here.
Yesterday, Brad Anderson announced that App Assure now includes Windows 10 on ARM64 personal computers (PCs). App Assure launched two years ago to provide customers with the confidence that your apps will work on Windows 10 and Office 365 (now Microsoft 365 Apps). If customers run into issues, our App Assure engineers help you to fix those issues. This is part of the FastTrack benefit, which comes at no additional cost with your eligible Microsoft 365 and Windows 10 plans of 150+ licenses.
Last year, App Assure expanded to include Windows Virtual Desktop (WVD) and Microsoft Edge, and now, we’re excited to provide application compatibility assistance for Windows 10 on ARM64 PCs. Originally, the desktop version of Windows 10 only ran on PCs powered by processors developed by Intel and AMD (x86 or x64) because they were optimized for performance. In contrast, ARM processors are often used in mobile devices where size, power consumption, and speed matter. In addition to Microsoft’s Surface Pro X, other manufacturers have started releasing ARM-based PCs, often built with Qualcomm’s Snapdragon chips. These devices have beneficial[i] features including all day battery life and support for mobile data networks.
An emulation layer built into Windows 10 on ARM enables the rich ecosystem of x86 Win32 applications to run unmodified. This means most 32-bit apps will install and run on ARM64 PCs without issue. However, we know that some of you may still have concerns about software compatibility, especially for those applications with kernel mode drivers (such as some third-party antivirus software) since they interact with core operating system components, which cannot be emulated.
For Windows 10 on ARM64 devices running version 1709 and later, App Assure is here to help. Our application compatibility promise is that Microsoft is committed to helping you ensure your apps work on the latest versions of our software. If you encounter issues, we’ll help you resolve them at no additional cost. Please note that there are a few instances where we have limitations: apps that rely on software drivers that aren’t compatible with ARM64 devices, use OpenGL or OpenCL, or are only available in 64-bit (x64) [1].
How do we keep this promise?
If you do encounter an app compat issue on an ARM64 PC, App Assure engineers will work with you to help you resolve the issue. Our experts will:
- Help you troubleshoot and identify a root cause
- Provide guidance to help you remediate the application compatibility issue
- Engage with third-party independent software vendors (ISVs) on your behalf to remediate some part of their app, so that it’s functional on the most modern version of our products
- Work with Microsoft product engineering teams to fix product bugs
We’re committed to not only helping you find a remediation for your app compat issue, but also going the extra mile by working with our engineering teams to find and fix the root cause, thus continuing to improve our products.
Do I have an ARM PC?
The following are some of the available or announced ARM64 PCs (as of September 2020):
- Surface Pro X
- Samsung Galaxy Book S
- Samsung Galaxy Book2
- Asus NovaGo
- HP Envy x2
- Lenovo Flex 5G
- Lenovo Yoga C630 WOS
- Lenovo Miix 630
- Acer Spin 7
- Huawei Matebook E (2019); only available in China
How do I get started with App Assure?
App Assure is available at no additional cost for eligible Microsoft 365 and Windows 10 plans of 150+ licenses. Visit aka.ms/AppAssureRequest to submit your request for assistance which will be assigned to your dedicated App Assure Manager. To learn more about App Assure compatibility assistance visit here. You can also watch the 2020 Microsoft Ignite Skilling Session on App Assure here.
[i] https://docs.microsoft.com/en-us/windows/uwp/porting/apps-on-arm
by Contributed | Sep 23, 2020 | Uncategorized
This article is contributed. See the original author and article here.
Introduction
Application scalability is very important for business success. Companies spend millions in ideation, software development, testing, and deployment to provide value to their customers. These customers then will use the app, but not in a regular basis. We might expect spikes during holidays, weekends, during the morning, etc.… In these cases, if the app is not ready to scale, then much of the investment might be lost.
In this workshop we will see the different solutions to scale applications in Kubernetes. We will explore 3 different solutions: Pods scalability, Node scalability and the Virtual Node. We’ll explore these options with a complete demo for each solution.
Setting up the environment
We will need a Kubernetes cluster; we are using Azure Kubernetes Service (AKS) which is a managed k8s cluster.
$ # Create an AKS cluster and a resource group
$ $aksRg="aks-demo"
$ $aksName="aks-demo"
$ #create a Resource Group
$ az group create -n $aksRg -l westeurope
$ # Create an AKS cluster with 2 nodes
$ az aks create -g $aksRg `
      -n $aksName `
      --node-count 2
$ # Connect to the AKS cluster
$ az aks get-credentials -g $aksRg -n $aksName
Then, we need to deploy a sample PHP application into k8s. This app will do some heavy calculations. The following yaml file creates a Deployment that will create a single Pod. And exposes it using a service object.
# deploy-svc.yaml
apiVersion: apps/v1
kind: Deployment
metadata:
  name: php-apache
spec:
  selector:
    matchLabels:
      run: php-apache
  replicas: 1
  template:
    metadata:
      labels:
        run: php-apache
    spec:
      containers:
      - name: php-apache
        image: k8s.gcr.io/hpa-example
        ports:
        - containerPort: 80
        resources:
          limits:
            cpu: 500m
          requests:
            cpu: 200m
---
apiVersion: v1
kind: Service
metadata:
  name: php-apache
  labels:
    run: php-apache
spec:
  ports:
  - port: 80
  selector:
    run: php-apache
Let’s deploy the deployment and service into Kubernetes and check the deployed pod.
  $ kubectl apply -f deploy-svc.yaml
 deployment.apps/php-apache created
 service/php-apache created
  $
  $ kubectl get pods
 NAME                          READY   STATUS    RESTARTS   AGE
 php-apache-79544c9bd9-vlwjp   1/1     Running   0          15s
- Pod scalability
Now, we have one single Pod deployed. Suppose we have lots of load/requests for one single pod and we need to scale out. Kubernetes have a built-in support for scalability in its core features. This could be done with 2 options. The first option is manually setting a hard number of replicas for the pods in the YAML file or by command line. The second option uses HPA. Next, we’ll explore these options.
The Deployment we created earlier have replicas set to 1. We can change that using the kubectl scale command as in the following:
 # Note 1 single Pod is deployed as per Deployment/Replicas
 $ kubectl get pods
NAME                          READY   STATUS    RESTARTS   AGE
php-apache-79544c9bd9-vlwjp   1/1     Running   0          13m
 $
 $ # Manually scale Pods
 $ kubectl scale --replicas=2 deployment/php-apache
deployment.apps/php-apache scaled
 $
 $ # Note 2 Pods are now deployed as per Deployment/Replicas
 $ kubectl get pods
NAME                          READY   STATUS    RESTARTS   AGE
php-apache-79544c9bd9-ggc77   1/1     Running   0          55s
php-apache-79544c9bd9-vlwjp   1/1     Running   0          14m
Manual scalability is just fine for two reasons. First, if we know ahead of time when the load will go up or down. Second, if it is fine to handle it manually. But, in real life, the spike can arrive at any moment. Thus, we should automate how the system will react.
- Pod auto-scalability using HPA
Scalability is one of the great features in Kubernetes. It could be achieved by scale out or scale in. This means increasing or decreasing the number of instances of a Pod. Kubernetes will manage how the load balancing between these Pods. This scalability could be automated by using HorizontalPodAutoscaler (HPA). The HPA will watch for CPU and Memory utilization metrics and decide to scale out or in. The metrics are exposed by the Metrics Server (https://github.com/kubernetes/metrics).
Let’s analyse the following example. This HPA will watch for the average CPU utilization for the Pods of the stated Deployment. The CPU average utilization should be around (and not exactly) 50%. When that is above 50%, the HPA will increase by one the number of replicas for the Deployment. If the average still above 50%, the HPA will increment the replicas again. The same process will be repeated until we either reach the 50% or the maximum number of allowed replicas (maxReplicas).
Scale in will be triggered when average CPU utilization is below 50%. Thus, the HPA will decrease the number of replicas until it reaches the targeted utilization or minimum number of allowed replicas (minReplicas).
The HPA will override the number of replicas stated in the Deployment configuration (replicas: 1) in respect to minReplicas: 3.
# hpa.yaml
apiVersion: autoscaling/v2beta2
kind: HorizontalPodAutoscaler
metadata:
  name: php-apache
spec:
  minReplicas: 3
  maxReplicas: 10
  scaleTargetRef:
    apiVersion: apps/v1
    kind: Deployment
    name: php-apache
  metrics:
  - type: Resource
    resource:
      name: cpu
      target:
        type: Utilization
        averageUtilization: 50
This HPA is based on CPU average utilization. But we can also use Memory utilization. These metrics are built in. In addition to that, we can extend these metrics by implementing the external or custom metrics server API. There are many implementations to get metrics from Prometheus (https://github.com/DirectXMan12/k8s-prometheus-adapter/blob/master/docs/walkthrough.md) or Azure Application Insights and Azure Monitor (https://github.com/Azure/azure-k8s-metrics-adapter). This enables scenarios like scalability based on Queue length, number of HTTP requests per second, etc.…
Let’s now deploy the HPA and check the created Pods.
 $ # Create the HorizontalPodAutoscaler (HPA)
 $ kubectl apply -f hpa.yaml
horizontalpodautoscaler.autoscaling/php-apache created
 $
 $ # Note 3 Pods are now deployed as per HPA minReplicas
 $ kubectl get pods
NAME                          READY   STATUS    RESTARTS   AGE
php-apache-79544c9bd9-ggc77   1/1     Running   0          4m33s
php-apache-79544c9bd9-vlwjp   1/1     Running   0          18m
php-apache-79544c9bd9-zmffh   1/1     Running   0          63s
 $
 $ # Check the current status of autoscaler
$ kubectl get hpa
NAME         REFERENCE               TARGETS   MINPODS   MAXPODS   REPLICAS   AGE
php-apache   Deployment/php-apache   0%/50%    3         10        3          2m39s
To test the HPA, we will increase the CPU utilization for the Pods. To do that, we will create 10 Pods that will send infinite HTTP/GET requests to the application Pods by using the script: ‘while true; do wget -q -O- http://php-apache; done’. The file have is the following content:
# load-generator-deploy.yaml
apiVersion: apps/v1
kind: Deployment
metadata:
  name: load-generator
spec:
  selector:
    matchLabels:
      run: load-generator
  replicas: 2
  template:
    metadata:
      labels:
        run: load-generator
    spec:
      containers:
      - name: load-generator
        image: busybox
        args: [/bin/sh, -c, 'while true; do wget -q -O- http://php-apache; done']
Let’s deploy the testing Deployment into Kubernetes. And after a few seconds we check the created Pods and the HPA status. Note we have now 10 instances of the application Pod created by the HPA.
 $ kubectl apply -f load-generator-deploy.yaml
deployment.apps/load-generator configured
 $ # Few seconds later
 $ kubectl get pods
NAME                              READY   STATUS    RESTARTS   AGE
load-generator-6d74bb99d5-6njgd   1/1     Running   0          9m27s
load-generator-6d74bb99d5-qn8pt   1/1     Running   0          9m27s
php-apache-79544c9bd9-2clfz       1/1     Running   0          20s
php-apache-79544c9bd9-925qp       1/1     Running   0          2m17s
php-apache-79544c9bd9-fl9hp       1/1     Running   0          5s
php-apache-79544c9bd9-hsn25       1/1     Running   0          5s
php-apache-79544c9bd9-kzscp       1/1     Running   0          5s
php-apache-79544c9bd9-lmxv7       1/1     Running   0          2m7s
php-apache-79544c9bd9-pwj5d       1/1     Running   0          20s
php-apache-79544c9bd9-r5487       1/1     Running   0          20s
php-apache-79544c9bd9-x59wz       1/1     Running   0          2m7s
php-apache-79544c9bd9-x9ptv       1/1     Running   0          5s
 $ kubectl get hpa
NAME         REFERENCE               TARGETS   MINPODS   MAXPODS   REPLICAS   AGE
php-apache   Deployment/php-apache   58%/50%   3         10        10         17m
This was how to scale an application on the Pod level. Next, we’ll demo scalability on the VM or Node level.
- Cluster node scalability
Scaling out the number of Pods is useful and efficient. But it is limited by the capacity available for the cluster. To solve this problem, AKS has a nice feature to scale out and scale in based on the number of VM or Node instances. This will add capacity to the cluster allowing for even more Pod scalability.
Like with Pods scalability, AKS can scale either manually or automatically. Let’s explore these options in the following sections.
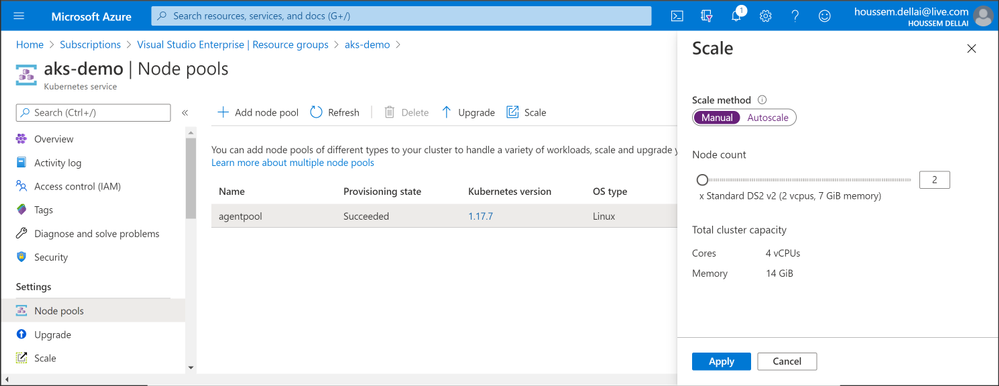
- Cluster node manual scalability
We have created the cluster with only 2 nodes. But we can increase or decrease that value at any time. In this demo we’ll set the number of instances to 3 and we should see a third node attached to the cluster in a few minutes. This could be done using the Azure portal:

And here is how to do that using the command line:
 $ az aks scale `
     --resource-group $aksRg `
     --name $aksName `
     --node-count 3

 $ kubectl get nodes
NAME                                STATUS   ROLES   AGE     VERSION
aks-agentpool-51725664-vmss000000   Ready    agent   32h     v1.17.7
aks-agentpool-51725664-vmss000001   Ready    agent   32h     v1.17.7
aks-agentpool-51725664-vmss00000d   Ready    agent   8m42s   v1.17.7
Note here we are using the Azure CLI instead of the kubectl. That is because the cluster scalability is implemented by the cloud provider and not by Kubernetes itself.
Manual scalability is fine for some cases. But in real life, we need to be proactive. That is why we can automate this task. The next section will show you how.
- Cluster node auto-scalability
AKS have a built in API that is surveilling the Scheduler API for any Pods that could not be scheduled due to cluster capacity or due to maximum number of allowed Pods per Node. And it will talk to the Azure ARM to provision and attach a new VM/Node to the cluster. The same process will run in a loop until it reaches the maximum number of allowed instances.
When the load goes down and Pods instances will be decreased, the VMs will be removed progressively in few minutes.
To demo how this works, we’ll increase the load on the application Pods by increasing the replicas of the load generator Pods to 100. And we will increase the maxReplicas of the HPA to 1000. Let’s edit the values in the YAML configuration files then deploy the changes.
 $ kubectl apply -f load-generator-deploy.yaml
deployment.apps/load-generator configured
 $ kubectl apply -f hpa.yaml
horizontalpodautoscaler.autoscaling/php-apache configured
 $ kubectl top nodes
NAME                                CPU(cores)   CPU%   MEMORY(bytes)   MEMORY%
aks-agentpool-51725664-vmss000000   1769m        93%    1786Mi          39%
aks-agentpool-51725664-vmss000001   1945m        102%   1780Mi          39%
aks-agentpool-51725664-vmss00000d   2010m        105%   1400Mi          30%

 $ kubectl get hpa
NAME         REFERENCE               TARGETS    MINPODS   MAXPODS   REPLICAS   AGE
php-apache   Deployment/php-apache   116%/50%   3         1000      50         86m

 $ kubectl get pods
NAME                              READY   STATUS    RESTARTS   AGE
load-generator-6d74bb99d5-2gjtn   1/1     Running   0          3m8s

<OTHER_PODS_REMOVED_FOR_BRIEVETY>

php-apache-79544c9bd9-xdlg7       1/1     Running   0          101s
php-apache-79544c9bd9-zj66j       0/1     Pending   0          101s

<OTHER_PODS_REMOVED_FOR_BRIEVETY>
Many Pods should be created to handle all the load, but that was stopped by the cluster capacity. Note how the Nodes CPU utilization is nearly 100%. And we still have Pods in Pending state. So, let’s leverage the AKS auto scalability.
We can do that using the Azure Portal as following:

And we can also configure scalability using the command line. In the following example we are enabling cluster autoscaler for AKS and we are setting min and max nodes count.
 $ az aks nodepool update `
     --resource-group $aksRg `
     --cluster-name $aksName `
     --name agentpool `
     --enable-cluster-autoscaler `
     --min-count 3 `
     --max-count 10

 $ # After few (5) minutes

 $ kubectl get nodes
NAME                                STATUS   ROLES   AGE     VERSION
aks-agentpool-51725664-vmss000000   Ready    agent   34h     v1.17.7
aks-agentpool-51725664-vmss000001   Ready    agent   34h     v1.17.7
aks-agentpool-51725664-vmss00000d   Ready    agent   125m    v1.17.7
aks-agentpool-51725664-vmss00000e   Ready    agent   11m     v1.17.7
aks-agentpool-51725664-vmss00000f   Ready    agent   10m     v1.17.7
aks-agentpool-51725664-vmss00000g   Ready    agent   11m     v1.17.7
aks-agentpool-51725664-vmss00000h   Ready    agent   10m     v1.17.7
aks-agentpool-51725664-vmss00000i   Ready    agent   6m17s   v1.17.7
aks-agentpool-51725664-vmss00000j   Ready    agent   6m32s   v1.17.7
aks-agentpool-51725664-vmss00000k   Ready    agent   6m18s   v1.17.7

 $ kubectl get hpa
NAME         REFERENCE               TARGETS    MINPODS   MAXPODS   REPLICAS   AGE
php-apache   Deployment/php-apache   102%/50%   3         1000      144        3h1m
Note that now we are running 10 Nodes in the AKS cluster because we have lots of Pods to be scheduled and we have set the maximum number to 10.
The HPA shows that the average CPU utilization is above the target. It needs to create even more Pods and Nodes. So, we can set the –max-count to a higher number like 100. In some extreme scenarios this might not be enough. A simple solution to this would be scaling up the VMs in the Node Pool.
- Virtual Node
Cluster autoscaler is a great feature to manage scalability. The Nodes will be ready in typically 2 to 5 minutes before the Pods could be scheduled. In some scenarios, these few minutes are like eternity. We need a faster solution for scalability. Here is where the Virtual Node comes in to play. The Virtual Node can schedule these Pods in just a few seconds.
The Virtual Node uses the Azure Container Instance (ACI) which is the Azure offering for Serverless Containers. The promise of ACI is that it can run a high number of containers in just few seconds without worrying on the infrastructure behind. Virtual Node extends AKS capacity with ACI.
The integration could be achieved using the Azure portal as following:

We can also set it up using the command line as performed in this link: https://docs.microsoft.com/en-us/azure/aks/virtual-nodes-cli.
After the creation of the cluster with 3 VMs and the Virtual Node enabled, we can see that there is a 4th Node named virtual-node-aci-linux. As the name states, it is a virtual node. It is not a VM. It is a connection to ACI, attached to the cluster as a Node that have ‘unlimited’ capacity.
 $ kubectl get nodes
NAME                                STATUS   ROLES   AGE   VERSION
aks-agentpool-10295500-vmss000000   Ready    agent   79m   v1.17.7
aks-agentpool-10295500-vmss000001   Ready    agent   80m   v1.17.7
aks-agentpool-10295500-vmss000002   Ready    agent   79m   v1.17.7
virtual-node-aci-linux              Ready    agent   43m   v1.14.3-vk-azure-aci-v1.2

 $ kubectl top nodes
NAME                                CPU(cores)   CPU%   MEMORY(bytes)   MEMORY%
aks-agentpool-10295500-vmss000000   134m         7%     982Mi           21%
aks-agentpool-10295500-vmss000001   83m          4%     1115Mi          24%
aks-agentpool-10295500-vmss000002   52m          2%     913Mi           20%
virtual-node-aci-linux              <unknown>  <unknown>  <unknown>  <unknown>
We can schedule an application on the ACI by adding nodeSelector and tolerations. Here is an example file:
# virtual-node.yaml
apiVersion: apps/v1
kind: Deployment
metadata:
  name: aci-helloworld
spec:
  replicas: 1
  selector:
    matchLabels:
      app: aci-helloworld
  template:
    metadata:
      labels:
        app: aci-helloworld
    spec:
      containers:
      - name: aci-helloworld
        image: microsoft/aci-helloworld
        ports:
        - containerPort: 80
      nodeSelector:
        kubernetes.io/role: agent
        beta.kubernetes.io/os: linux
        type: virtual-kubelet
      tolerations:
      - key: virtual-kubelet.io/provider
        operator: Exists
A full tutorial on how to work with Virtual Node is available in the following link:
docs.microsoft.com/en-us/azure/aks/virtual-nodes-portal.
Conclusion
AKS brings many options for application scalability that can work together in order to manage application scalability.
Disclaimer
The sample scripts are not supported under any Microsoft standard support program or service. The sample scripts are provided AS IS without warranty of any kind. Microsoft further disclaims all implied warranties including, without limitation, any implied warranties of merchantability or of fitness for a particular purpose. The entire risk arising out of the use or performance of the sample scripts and documentation remains with you. In no event shall Microsoft, its authors, or anyone else involved in the creation, production, or delivery of the scripts be liable for any damages whatsoever (including, without limitation, damages for loss of business profits, business interruption, loss of business information, or other pecuniary loss) arising out of the use of or inability to use the sample scripts or documentation, even if Microsoft has been advised of the possibility of such damages.

by Contributed | Sep 23, 2020 | Uncategorized
This article is contributed. See the original author and article here.
Recently we received such kind of issue that, when you simply just open a connection to SQL Server, you can see there was DTC transactions enlisted.
However, this only happened for the SQLOLEDB drivers, the SQL Native Client doesn’t have same behavior.
The minimum reproduce code :
using System;
using System.Collections.Generic;
using System.Data.Common;
using System.Linq;
using System.Text;
using System.Threading.Tasks;
using System.Transactions;
using static System.Console;
using System.Data.SqlClient;
namespace DTCTest
{
class Program
{
const string connStrGoodOleDB = “Provider=SQLOLEDB;DataTypeCompatibility=80;SERVER=MYTESTLAB;UID=testlogin;” +
“PWD=Password01!;APP=SQLOLEDBAPP;WSID=;DATABASE=TEST”;
private static object writer;
public static DbProviderFactory GetOleDbFactory()
{
return System.Data.OleDb.OleDbFactory.Instance;
}
static void Main(string[] args)
{
using (TransactionScope scope = new TransactionScope())
{
using (DbConnection connection = GetOleDbFactory().CreateConnection())
{
connection.ConnectionString = connStrGoodOleDB;
connection.Open();
scope.Complete();
}
}
WriteLine(“Complete”);
ReadKey();
return;
}
}
}
As you can see the above code only opened a connection, but in SQL Server profile trace, it showed I have DTCTransaction for SQLOLEDBAPP

Then I collected process monitor, and checked the stack of the whole process, found it was due to the System.Data.Oledb.OledbConnections, in the Open() function, it will check several condition, if meet, then it will automatically Enlist the transaction, and finally went to the DTC transactions related call.
And one of the conditions check was OLEDB Services, so I searched for it and found we already had a document noted this issue:
https://docs.microsoft.com/en-us/dotnet/framework/data/adonet/distributed-transactions
“You can disable auto-enlistment in existing transactions by specifying Enlist=false as a connection string parameter for a SqlConnection.ConnectionString, or OLE DB Services=-7 as a connection string parameter for an OleDbConnection.ConnectionString. “
This is also notified in below doc
https://docs.microsoft.com/en-us/sql/relational-databases/clr-integration-data-access-transactions/transaction-promotion?view=sql-server-ver15
You may not notice this connection string parameter, since it was not noted in the connection string part. So the solution is easy, just change my connection string as below you will get it resolved
const string connStrGoodOleDB = “Provider=SQLOLEDB;DataTypeCompatibility=80;SERVER=MYTESTLAB;UID=testlogin;OLE DB Services=-7;” +
“PWD=Password01!;APP=SQLOLEDBAPP;WSID=;DATABASE=TEST”;
by Contributed | Sep 23, 2020 | Uncategorized
This article is contributed. See the original author and article here.
Today, I’d like to introduce current status of Small Basic Online. At first, I will introduce fixed issues this year. Second, I’ll tell what is the difference between Small Basic Online (SBO) and Small Basic Desktop (SBD). At last, I will show some ideas to write in SBO.
Fixed issues 2020 in SBO
Following issues have been fixed this year. SBO issues are managed in GitHub.
- #152 Array index is not case insensitive.
- #150 Array entry never removed
- #134 Level 2 Tutorial Should Work (same as #106 and #112)
- #133 Level 1 Tutorial should work
- #129 Some of spaces will be lost in text literals
- #127 Page does not load on Mac+Safari
- #126 Default of FontBold is “False”
- #122 TextWindow.ReadNumber Doesn’t allow negative or decimal numbers
- #121 Text.Append does not append all printable character strings
- #112 GraphicsWindow.KeyDown event never be called
- #107 Turtle appears not on the trailing line on Chrome & Edge browsers
- #106 GraphicsWindow.LastKey always return null
- #58 GraphicsWindow.DrawImage doesn’t show the image
- #14 Turtle graphic missing on Edge browser
Changes in SBO
There are many changes in SBO from SBD. SBO is still beta. So, some may be fixed but some will remain as the difference.
New features
- Most important point is SBO allows us to program with only browser such as Edge and Chrome. This means SBO runs in not only Windows but other operating systems.
- 11 new features (Libraries Pane, Debug Mode, Updated Sample Program, New Icon Designs, Advanced Error Handling, Auto Filling, Hover Hints, Save & Open, TXT File Format, Open Source on GitHub, Double Display) are described in Ed’s “NEW UPDATES: Small Basic Website 2.2 & Small Basic Online 1.0“.
- Error messages are detailed in here.
- Shortcuts for keyboard are detailed in here.
Extensions cannot be used
Extensions such as Kinect for Small Basic and LitDev cannot be used.
Initial value of variable
The initial value of the variable is “”. But reference to the variable without initializing causes compile error in SBD, while no error in SBO.
Array initialization
In SBD, Not = “False = True; True = False;” could initialize the array Not, but in SBO, the variable Not simply contains the above string.
Specifying transparent color
In Small Basic v1.2, the alpha value for opacity was specified as “#aarrggbb”, but in SBO v1.0 it becomes “#rrggbbaa”.
Features not implemented
The following functions cannot be implemented in SBO (online). Writing in code will result in a syntax error of The library member’ObjXXX.MbrXXX’ cannot be used in the online editor. Please download the desktop editor to use it..
- File.AppendContents()
- File.CopyFile()
- File.CreateDirectory()
- File.DeleteFile()
- File.DeleteDirectory()
- File.GetDirectories()
- File.GetFiles()
- File.GetTemporaryFilePath()
- File.InsertLine()
- File.LastError
- File.ReadContents()
- File.ReadLine()
- File.WriteContents()
- File.WriteLine()
- ImageList.LoadImage()
The following features are not yet implemented in SBO v1.0. I can’t press the button.
The following features are not yet implemented in SBO v1.0. Writing in code results in a syntax error of The library member’ObjXXX.MbrXXX’ was available in older versions only, and has not been made available to this version yet..
- Desktop.Height
- Desktop.SetWallPaper()
- Desktop.Width
- Dictionary.GetDefinition()
- Dictionary.GetDefinitionEnglishToEnglish()
- Dictionary.GetDefinitionEnglishToFrench()
- Dictionary.GetDefinitionEnglishToGerman()
- Dictionary.GetDefinitionEnglishToItalian()
- Dictionary.GetDefinitionEnglishToJapanese()
- Dictionary.GetDefinitionEnglishToKorean()
- Dictionary.GetDefinitionEnglishToSimplifiedChinese()
- Dictionary.GetDefinitionEnglishToTraditionalChinese()
- Dictionary.GetDefinitionFrenchToEnglish()
- Dictionary.GetDefinitionGermanToEnglish()
- Dictionary.GetDefinitionItalianToEnglish()
- Dictionary.GetDefinitionJapaneseToEnglish()
- Dictionary.GetDefinitionKoreanToEnglish()
- Dictionary.GetDefinitionSimplifiedChineseToEnglish()
- Dictionary.GetDefinitionTraditionalChineseToEnglish()
- File.GetSettingsFilePath()
- File.ReadLine()
- File.WriteLine()
- Flickr.GetPictureOfMoment()
- Flickr.GetRandomPicture()
- Dictionary.GetDefinition()
- GraphicsWindow.CanResize
- GraphicsWindow.Left
- GraphicsWindow.Title
- GraphicsWindow.Top
- Program.ArgumentCount
- Program.Directory
- Program.GetArgument()
- TextWindow.CursorLeft
- TextWindow.CursorTop
- TextWindow.Left
- TextWindow.Pause()
- TextWindow.Title
- TextWindow.Top
Fonts
SBO has only Arial (Helvetica), Consolas, Courier New (Courier), Roboto and Times New Roman (Times). Details are described here.
Read-only GraphicsWindow size
The following properties are now read-only in SBO v1.0. Attempting to assign a value results in a syntax error Property’ObjXXX.PrpXXX’ cannot be assigned to. It is ready only..
- GraphicsWindow.Width
- GraphicsWindow.Height
Shapes size
When I made a square with Shapes.AddRectangle (100, 100), it was 100 x 100 pixels in size, including the thickness of the pen. On the other hand, when it was made with GraphicsWindow.DrawRectangle (10, 10, 100, 100), it was larger by the thickness of the pen. In SBO, the latter is unified, and if the pen thickness is 2 pixels, both will draw a square of 102 x 102 pixels.
Turtle design
The design of the turtle has changed. Especially the size has increased.
Turtle trails
The turtle trails are the same as Shapes in SBD, and the one created later was displayed in the foreground, but in SBO, the turtle trails are always in front of Shapes.
New programming style
Based on the above changes, I would like to explain the points about programming in the new Small Basic.
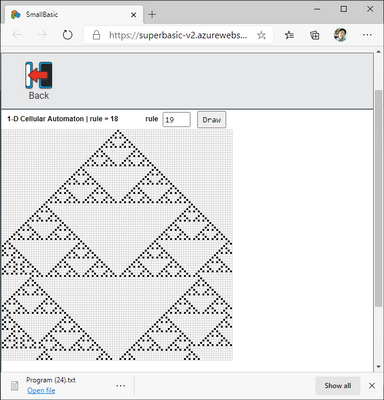
Make your own title
Neither GraphicsWindow.Title nor TextWindow.Title can be changed, so if you want to display the title, use Shapes.AddText, TextWindow.WriteLine, etc. to display it in the window.
Sample program XMC184-3 below has own title.

Ingenuity that does not depend on window size
There is a concept of responsive design so that the homepage can support devices of various sizes. Since SBO cannot specify GraphicsWindow.Width or GraphicsWindow.Height and is affected by the window size of the browser, it is a good idea to adopt the idea of responsive design. Specifically, it monitors GraphicsWindow.Width and GraphicsWindow.Height so that it will be repositioned on the screen when it changes.
Following program CVF012 will run in both SBO and SBD.

Conclusion
This time, as far as I know, I wrote about the changes in SBO and new programming styles based on it, but I will continue testing SBO and write a lot of programs for SBO from now on, so I will update this article as needed. Thanks.

Recent Comments