by Scott Muniz | Aug 14, 2020 | Azure, Microsoft, Technology, Uncategorized
This article is contributed. See the original author and article here.
Lots of news surrounding Azure security and hybrid offerings this week. Here are a couple of the news items we are covering this week: Azure Database for PostgreSQL Data encryption enhancements announced, New Microsoft Learn Modules for Azure and Windows Server IT Pros, Exchange Server 2016 End of Mainstream Support and Azure Cloud Shell running in an isolated virtual network and tools image open sourced.
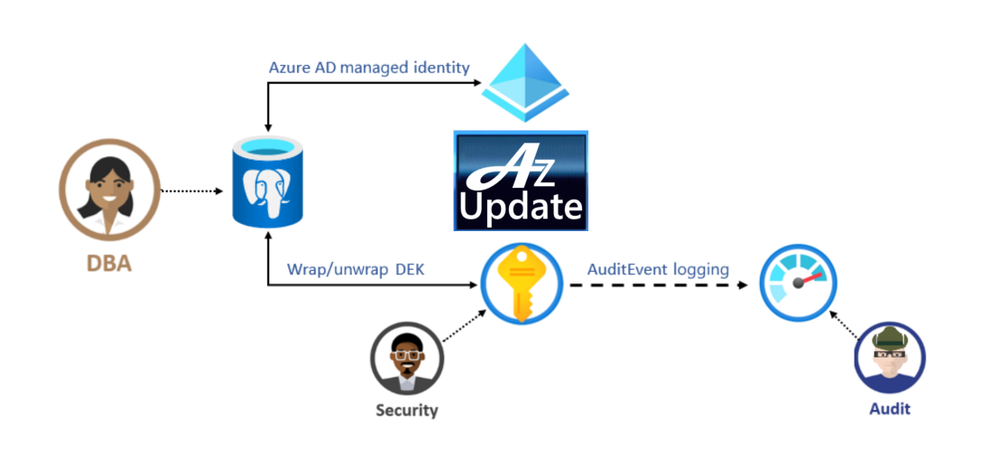
Azure Database for PostgreSQL Data encryption enhancements announced
Azure Database for PostgreSQL Infrastructure double encryption (preview)
The preview of infrastructure double encryption for Azure Database for PostgreSQL-single server is now available. Infrastructure double encryption adds a second layer of encryption using a FIPS 140-2 validated cryptographic module and a different encryption algorithm which gives an additional layer of protection for your data at rest. The key used in Infrastructure Double encryption is also managed by this service. This feature is not turned on by default as it will have performance impact due to the additional layer of encryption.
Data encryption with customer managed keys for Azure DB for PostgreSQL-single server
Data encryption with customer-managed keys for Azure Database for PostgreSQL-single server enables you to bring your own key (BYOK) for data protection at rest. It also allows organizations to implement separation of duties in the management of keys and data. With customer-managed encryption, you are responsible for, and in a full control of, a key’s lifecycle, key usage permissions, and auditing of operations on keys.

New Microsoft Learn Modules for Azure and Windows Server IT Pros
Whether you’re just starting or an experienced professional, the hands-on approach helps you arrive at your goals faster, with more confidence and at your own pace. In the last couple of days, the team at Microsoft published a couple of new Microsoft Learn modules around Azure, Hybrid Cloud, and Windows Server for IT Pros. These modules help you to learn how you can leverage Microsoft Azure in a hybrid cloud environment to manage Windows Server.
Exchange Server 2016 and the End of Mainstream Support
Microsoft has announced that Exchange Server 2016 enters the Extended Support phase of its product lifecycle on October 14th, 2020. During Extended Support, products receive only updates defined as Critical consistent with the Security Update Guide. For Exchange Server 2016, critical updates will also include any required product updates due to time zone definition changes. With the transition of Exchange Server 2016 to Extended Support, the quarterly release schedule of cumulative updates (CU) will end. The last planned CU for Exchange Server 2016, CU19, will be released in December 2020.
Azure Cloud Shell enhancements announced
Azure Cloud Shell can now run in an isolated virtual network (public preview)
Microsoft announced the public preview of Azure Cloud Shell running inside a private virtual network. This widely requested and optional feature allows you deploy a Cloud Shell container into an Azure virtual network that you control. Once you connect to Cloud Shell, you can interact with resources within the virtual network you selected. This allows you to connect to virtual machines that only have a private IP, use kubectl to connect to a Kubernetes cluster which has locked down access, or connect to other resources that are secured inside a virtual network.
The Azure Cloud Shell tools image is now open sourced
The Cloud Shell experience contains common command line tools to manage resources across both Azure and M365 and can now be found on GitHub. You can now file issues or pull requests directly to the tools image, and any changes that occur there will be reflected in the next release of Cloud Shell. You can use this container image in other management scenarios, with many tools already installed and updated regularly, removing the concern about updating your cloud management tools.
MS Learn Module of the Week

These hands-on-labs share details on how to configure an Azure environment so that Windows IaaS workloads requiring Active Directory are supported. You’ll also learn to integrate on-premises Active Directory Domain Services (AD DS) environment into Azure.
Let us know in the comments below if there are any news items you would like to see covered in next week show. Az Update streams live every Friday so be sure to catch the next episode and join us in the live chat.
by Scott Muniz | Aug 14, 2020 | Uncategorized
This article is contributed. See the original author and article here.
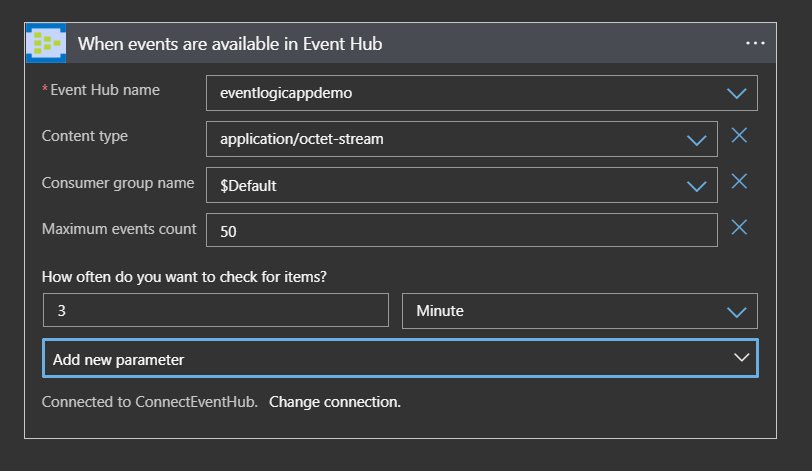
This article guides you on configuring the Event Hub Trigger of Logic App and later automate the workflows for the events pulled from Event Hub.
To introduce about the Event Hub Trigger :
All Event Hub triggers are long-polling triggers, which means that the trigger processes all the events and then waits 30 seconds per partition for more events to appear in your Event Hub. So, if the trigger is set up with four partitions, this delay might take up to two minutes before the trigger finishes polling all the partitions. If no events are received within this delay, the trigger run is skipped. Otherwise, the trigger continues reading events until your Event Hub is empty. The next trigger poll happens based on the recurrence interval that you specify in the trigger’s properties.
- The Event Hub Trigger pulls all the events until the number reaches the “Maximum event Counts “from one partition at a time.
- The next poll for next partition happens after 30 seconds gap.
- If next partition doesn’t have any data the trigger would count as skipped and again we have delay of 30 seconds.
- As a whole we would not know how long the Event Hub trigger would take to complete to poll all the partitions.
It depends on the previous poll time.
Hence, we would not be able to poll all the partitions of Event Hub at the same time by targeting all the partitions by LA Trigger as shown below.
If we configure the Event Hub Trigger without “Minimum Partition key” and “Maximum Partition key”, then by default all partitions will be polled.

If we configure the Event Hub Trigger with “Minimum Partition key” and “Maximum Partition key”(considering the number of partitions), then only specific partitions will be polled. In this case : partition 0,1,2 and 3 will be polled.

In either of the above cases we will have a Single logic App trigger polling for all the partitions with a polling interval of 3 minutes.
Suppose all the Event source data is pushed into a single partition (say partition 3), then it will take more than 12 minutes to pull the data.

Note : If the data is pushed into the Event Hub without targeting any of partitions then we cannot assume the data is distributed to all the partitions equally.
In a real time scenario, we may require to process all the events from all the partitions of Event Hub at the same time.
For this instance we shall again keep an Event Hub with only 4 partitions for demo.
Since we know a single Logic App Event Hub trigger shall poll all the partitions in round robin fashion and each trigger shall poll each partitions and our used case will not be satisfied. Hence, we shall go for 4 different Logic App which points to each Event Hub partition.

Each Logic App can point to different Partitions as shown in the below image.

If we have the common Logic of processing the Events then we can opt for Common Logic App which does the actual Processing of the Events. These 4 Logic App can pull the data and call the Common Logic App for processing. This helps in LA definition management and also helps in reducing the complexity.

Later we can call the Common Logic app from all the Other Logic Apps.

The above design can be made scalable in various aspects based on number of Events and Event Hub Partitions.
For example :
Let’s consider the scenario where you have more Events that are published and you will have to add more partitions to the Event hub. For now we keep it as 8 partitions.
If we have a single Logic App to poll all the partitions from 0 to 7 , it would take 24 minutes to poll all the data if we have configured to poll the Event Hub for every 3 minutes with total of 8 triggers fired.
Similarly, if we have the polling frequency set for 1 minute it would take at least 8 minutes to complete to poll all the partitions.

Trigger History for reference :

So by the time the Trigger would poll the partition which has more data the chances of overloading the EventHub would be even more because the events are not pulled from Event Hub in the rate that is received from the partition.
In Such scenarios we can add few more Logic Apps where each LA shall poll less partitions which in turn increases the frequency of poll.
For ex: we can clone 3 more Logic Apps separating the main logic of processing/automation of the Events in Child Logic Apps.
Choose Clone option under Overview of Logic Apps and create 3 more Logic Apps.

Later change the properties of LogicApp to poll 2 partitions each. For ex Logic App-1 to partition 0 and 1, Logic App-2 to partition 2 and 3, Logic App-3 to Partition 4 and 5 , Logic App-4 to partition 6 and 7.

Since the major logic goes into the Child(Common Logic App) there would be drastic reduction in maintenance work. If any changes related to business can be done in Child Logic App.
Reference : https://docs.microsoft.com/en-us/azure/connectors/connectors-create-api-azure-event-hubs
by Scott Muniz | Aug 14, 2020 | Azure, Microsoft, Technology, Uncategorized
This article is contributed. See the original author and article here.
This article provides a workaround for the limitation on API Management for returning 404 Operation Not Found instead of 405 Method Not Allowed. There is a Azure feedback and the Stack overflow about this limitation.
Current Status for API Management
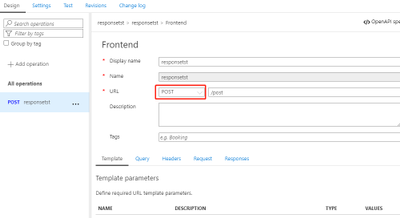
Defining API in APIM including creating the resources and allowed methods for each resource.
- Define a POST API:

- Test the API with POST method via Postman:

- Change the HTTP Method to GET or other methods, it returns with 404 operation not found:

The error returned by APIM in this scenario does not follow the definition of HTTP status code strictly. There was feedback that this is still a limitation for APIM and product team updated that there is still no plan on it.
Workaround:
- Handle the error
When APIM failed to identify an API or operation for the request, it will raise a configuration error which Responses the caller with 404 Resource Not Found. We need to handle this kind of configuration error by referring the Error Handling for APIM, this kind of error can be specified with configuration Error source and OperationNotFound Error reason. We can define a policy to single API or all of our APIs to capture the error, and set the status code to HTTP 405.
- Define the policy to all APIs:
Policy Code:
      <choose>
            <when condition="@(context.LastError.Source == "configuration" && context.LastError.Reason == "OperationNotFound")">
                <return-response>
                    <set-status code="405" reason="Method not allowed" />
                    <set-body>@{
                    return new JObject(
                        new JProperty("status", "HTTP 405"),
                        new JProperty("message", "Method not allowed"),
                        new JProperty("text", context.Response.StatusCode.ToString()),
                        new JProperty("errorReason", context.LastError.Message.ToString())
                    ).ToString();
                }</set-body>
                </return-response>
            </when>
            <otherwise />
        </choose>
You may wonder how the condition context.LastError.Source == “configuration” && context.LastError.Reason == “OperationNotFound” will specify this type of error, from the error OCP trace, we can see the an error is thrown with message in Configuration section “OperationNotFound”:

when this type error occurred during the evaluation, the error source will be captured as configuration. It will not forward request further. To exclude other configuration error, we need specify the error reason as “OperationNotFound”.
- Test the API with wrong HTTP method:

Tested on all APIs and with all wrong methods, it will get 405 Method Not Allowed.
Related links:
Error Handling for APIM
Hope this can be useful!
by Scott Muniz | Aug 14, 2020 | Uncategorized
This article is contributed. See the original author and article here.
Introduction
This is John Barbare and I am a Sr Customer Engineer at Microsoft focusing on all things in the Cybersecurity space. In this blog I will focus on the newly released feature of web content filtering in Microsoft Defender Advanced Threat Protection (ATP). Before July 6th, 2020 you either had to purchase or use a trial license though Cyren or be in public preview to use and/or test the feature.
With the overwhelming positive feedback during the public preview, it was highly recommended that Microsoft enable this feature inside Microsoft Defender ATP. With having a partner license with Cyren to be able to use it, customers did not want to implement it wide scale after the trial/preview and spend additional budget to activate and implement web content filtering. Microsoft is pleased to announce that customers can now activate and use web content filtering without spending any more budget, deploying additional hardware, or purchasing a third party license to use web content filtering through Cyren. The feature is still in public preview and anyone can turn the feature on by turning on preview features and then setting up web content filtering inside advanced features. With that said, lets see what web content filter does, configure the settings, test out in a lab, and then view the results in Microsoft Defender ATP.
Prerequisites for Web Content Filtering
- Windows 10 Enterprise E5 license
- Access to Microsoft Defender Security Center portal
- Devices running Windows 10 Anniversary Update (version 1607) or later with the latest MoCAMP update. Note that if SmartScreen is not turned on, Network Protection will take over the blocking.
Data Processing
Data processing will be handled by the region you selected when you first onboarded Microsoft Defender ATP (US, UK, or Europe) and will not leave the selected data region or shared between any third party providers or data providers. Certain times Microsoft may send the aggregated data to other third parties to assist in their feeds. Aggregated data is the process of combing the results in web content filtering into totals or summary statistics based off the results from applying and using the filtering. These detailed statistics provide companies with answers to large analytical questions without having to sort through private user information and large amounts of customer data that Microsoft deems private. Data processing is kept safe and secure when you enable and use web content filtering.
Web Content Filtering vs SmartSceen vs Network Protection
To gain a better understanding of the differences in web content filtering if you are already utilizing SmartScreen and Network Protection, we will summarize each one to gain a better understanding of what each technology detects/blocks and the similarities and differences of each one. Web content filtering in Microsoft Defender ATP allows you to secure your devices across the enterprise against web based threats and helps you regulate unwanted content based off multiple content categories and sub categories.

Microsoft Defender SmartScreen protects against phishing or malware websites and applications, and the downloading of potentially malicious files. This protects users from sites that are reported to host phishing attacks or attempt to distribute malicious software. It can also help protect against deceptive advertisements, scam sites, and drive-by attacks. Drive-by attacks are web-based attacks that tend to start on a trusted site, targeting security vulnerabilities in commonly used software. Microsoft Defender SmartScreen evaluates a website’s URLs to determine if they’re known to distribute or host unsafe content. It also provides reputation checks for apps, checking downloaded programs and the digital signature used to sign a file. If a URL, a file, an app, or a certificate has an established reputation, users won’t see any warnings. If, however, there’s no reputation, the item is marked as a higher risk and presents a warning to the user.

Network protection helps reduce the attack surface of your devices from Internet-based events. It prevents employees from using any application to access dangerous domains that may host phishing scams, exploits, and other malicious content on the Internet. IT expands the scope of Microsoft Defender SmartScreen by blocking all outbound requests to low reputation sources (based on the domain or hostname). When network protection blocks a connection, a notification will be displayed from the Action Center. You can customize the notification with your company details and contact information. You can also enable the rules individually to customize what techniques the feature monitors. Network Protection takes Microsoft Defender SmartScreen’s industry-leading protection and makes it available to all browsers and processes.

Setting up Web Content Filtering
Navigate to Microsoft Defender Security Center and login with your credentials at https://securitycenter.windows.com/

Navigate to Settings and then Advanced features. Make sure Web content filtering and Preview Features are turned to on. In later releases the preview feature will not need to be turned on but as of this article, it will need to be turned on.

Creating a Web Content Filtering Policy
To create a web content filtering policy, click on Web content filtering under Settings and then click on + Add Item at the top.

This will bring you to the creation of the initial policy. Give the web content filtering policy a name of your choosing and click next.

After you have selected next, it will take you to the most important part of the web content filtering policy where you will select which categories and subcategories to block against. The main five categories are adult content, high bandwidth, legal liability, leisure, and uncategorized as seen below.

Clicking on the arrow next to the categories will dropdown all the subcategories for each individual category.

You can select the box next to the left of the category to select all the subcategories underneath (category box will turn blue with a check) or just select a few of the subcategories that you want to filter web traffic on (category box will be blue but subcategory will turn blue with a check) as seen below. Once you have decided on what you want to filter, go ahead, and click next.

This will bring you to the scope of where the policy will be applied to. You have two options to select.
- All devices.
- Select devices. When selecting this, only select device groups will be prevented from accessing websites in the selected categories. All others will not be applied.
Also, for user access to devices in a group, you can add in Azure AD user groups and then pick the correct access. Go to Settings, Device groups, select the device group, and then select User access.

In this policy, the Dev Group was selected to apply the multiple categories and subcategories to this web content filter policy and the other groups will not be affected by this policy. Go ahead and click next when done.

Once you click next, you are able to review the final policy one last time before clicking save to apply to the new policy.

I’ve tested on my home lab machines and it has taken anywhere from 1-3 minutes to apply on the select machines in my group. With other clients it has taken up to 10, 15, or at the most 30 minutes depending on bandwidth, size of machine group, and how spread apart the machines are in a region.
Creating an Audit Policy and Testing
To deploy an audit policy for web content filtering in Microsoft Defender ATP, do the exact same steps as above, except do not select any of the categories and/or subcategories. Once reviewing that none have been selected, apply the policy to the appropriate device group to audit. By deploying an audit only policy, this will help your enterprise understand user behavior and the categories of websites they are viewing. Then you can create a block policy for the categories and subcategories of your choosing and apply to the select groups.
Before testing my new web content filtering policy on my lab machine, I will create an Audit policy to make sure everything is working.

Once applied, I will wait the appropriate time to make sure the audit policy has synced with my test machine. Next, I will go to a gambling site that is not malicious in nature, no known attack vectors, categorized as a gambling site, and a high URL/IP reputation. The reason for this is because I have SmartScreen and Network Protection enabled along with all the Microsoft Security Baselines for Microsoft Defender Antivirus to include Real Time Protection and direct access to the Microsoft Security Intelligence Graph. This way the site is a known good site and will not get blocked from SmartScreen, Network Protection, or the other security measures I have deployed.

The gambling site was able to load and was not blocked by any of the security features I had enabled. Since it was in audit mode, this was the expected behavior.
Heading back to Microsoft Defender ATP we can see the connection was made to the site successfully and all relevant information for the gambling site is shown below. Since it was not malicious or had a low URL/IP reputation, it did not get blocked.

Testing the Web Content Filtering Policy
Since we have the audit policy applied, we will switch the policy to the new policy we created at the start for the Dev Group in which we selected most of the categories and subcategories to include gambling sites. This way we can test the actual policy in block mode and see if the web content filter will block the gambling site we were able to successfully navigate to and also a social networking site.

Once the policy is synched, I will refresh the browser and see the use of Microsoft Defender ATP web content filtering in action.

As you can see the same gambling website was blocked using web content filtering. Next, I will test a social media site to see if it will get blocked since we have that checked in our policy.

If you want to double check the classification of a website against the web filter, you can go here and see where the URL is classified into a category based on a variety of information.
Microsoft Defender ATP Portal – Web Content Filtering Activity
To view all the activity and reports for your web content filtering policies, click on Reports and then Web protection. You can change the timeframe for web activity by category from last 30 days to last 6 months and the other cards can be changed by clicking on the colored bar from the chart in the row.
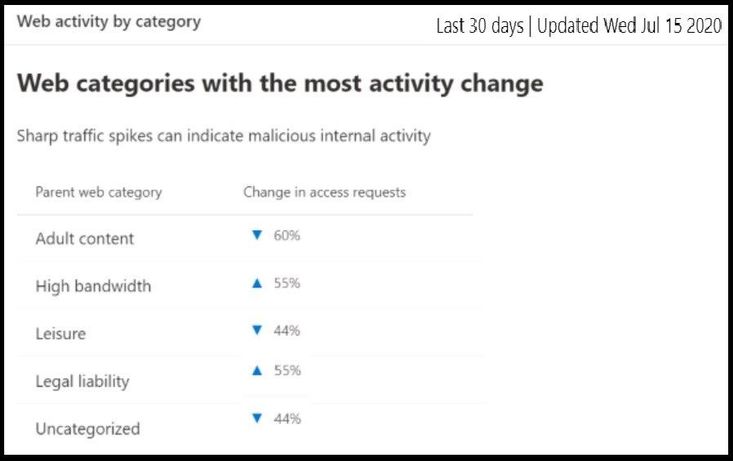
Web Activity by Category
This card lists the parent web content categories with the largest percentage change in the number of access attempts, whether they have increased or decreased. You can use this card to understand drastic changes in web activity patterns in your organization from last 30 days, 3 months, or 6 months. Select a category name to view more information about that particular category.
In the first 30 days of using this feature, your enterprise might not have sufficient data to display in this card. After the 30 days, the percentages will show as seen in the above screenshot.
Web content filtering summary card
This card displays the distribution of blocked access attempts across the different parent web content categories. Select one of the colored bars to view more information about a specific parent web category.
Web activity summary card
This card displays the total number of requests for web content in all URLs.
View card details
You can access the Report details for each card by selecting a table row or colored bar from the chart in the card. The report details page for each card contains extensive statistical data about web content categories, website domains, and device groups. Here I am selecting the Web content filtering summary colored bar to see all the activity from web categories, domains, and device groups and specifically the gambling website I tested.
- Web categories: Lists the web content categories that have had access attempts in your organization. Select a specific category to open a summary flyout.

- Domains: Lists the web domains that have been accessed or blocked in your organization. Select a specific domain to view detailed information about that domain.

- Device groups: Lists all the device groups that have generated web activity in your organization

Use the time range filter at the top left of the page to select a time period. You can also filter the information or customize the columns. Select a row to open a flyout pane with even more information about the selected item.
Errors and Known Issues
As of the publication of this blog, several known issues have been identified and are currently in the process of being corrected. Once corrected, this section will be updated and/or deleted from this blog post.
- Only Edge is supported if your device’s OS configuration is Server (cmd > Systeminfo > OS Configuration). This is because Network Protection is only supported in Inspect mode on Server devices which is responsible for securing traffic across Chrome/Firefox.
- Unassigned devices will have incorrect data shown within the report. In the Report details > Device groups pivot, you may see a row with a blank Device Group field. This group contains your unassigned devices in the interim before they get put into your specified group. The report for this row may not contain an accurate count of devices or access counts.
Conclusion
Thanks for taking the time to read this blog and I hope you had fun reading how to use the newly released feature of web content filtering in Microsoft Defender Advanced ATP that everyone can use now that has access to Microsoft Security Center. Some of my customers are currently paying/using a third party proxy, but now they can rest assured that using web content filtering in Microsoft Defender ATP can be used in its place. Before using a Microsoft security feature for the first time be sure to test in audit mode first before putting in block mode. Hope to see you in my next blog and always protect your endpoints!
Thanks for reading and have a great Cybersecurity day!
Follow my Microsoft Security Blogs: http://aka.ms/JohnBarbare
by Scott Muniz | Aug 13, 2020 | Azure, Microsoft, Technology, Uncategorized
This article is contributed. See the original author and article here.
The Azure Sphere OS quality update 20.08 is now available for evaluation via the Retail Eval feed. The retail evaluation period provides 14 days for backwards compatibility testing. During this time, please verify that your applications and devices operate properly with this release before it’s deployed broadly via the Retail feed. The Retail feed will continue to deliver OS version 20.07 until we publish 20.08.
The 20.08 release includes enhancements and bug fixes in the Azure Sphere OS; it does not include an updated SDK.
The following changes and bug fixes are included:
- Fixed issue with the system time not being maintained with RTC and battery.
- WifiConfig_GetNetworkDiagnostics now returns AuthenticationFailed in a manner consistent with 20.06 and earlier.
- Networking_GetInterfaceConnectionStatus now more accurately reflects the ConnectedToInternet state.
- Fixed issue in 20.07 where device recovery would not result in a random MAC address for Ethernet on an Ethernet configured device.
We have also released new guidance to device manufacturers that should improve the stability of device-to-PC connections, e.g. in a manufacturing setting. In particular, we have updated the FTDI EEPROM configuration file in the azure-sphere-hardware-designs repo on GitHub to use ‘D2XX Direct’ mode instead of Virtual Com Port (VCP) mode. This new file also enables auto-generation of a random serial number, which will enable more reliable and flexible device identification in future releases of the SDK.
For more information
For more information on Azure Sphere OS feeds and setting up an evaluation device group, see Azure Sphere OS feeds.
If you encounter problems
For self-help technical inquiries, please visit Microsoft Q&A or Stack Overflow. If you require technical support and have a support plan, please submit a support ticket in Microsoft Azure Support or work with your Microsoft Technical Account Manager. If you do not have a support plan and require technical support, please explore the Azure support plans.
by Scott Muniz | Aug 13, 2020 | Azure, Microsoft, Technology, Uncategorized
This article is contributed. See the original author and article here.
In 2020 Kubernetes only marked its sixth birthday, but in that time its usage has grown exponentially and it is now considered a core part of many organization’s application platforms. The flexibility and scalability of containerized environments makes deploying applications as microservices in containers very attractive and Kubernetes has emerged as the orchestrator of choice for many. Azure offers Azure Kubernetes Service (AKS) where your Kubernetes cluster is managed and integrated into the platform. In this blog we are going to look at how you can use Azure Sentinel to monitor your AKS clusters for security incidents.
Overview
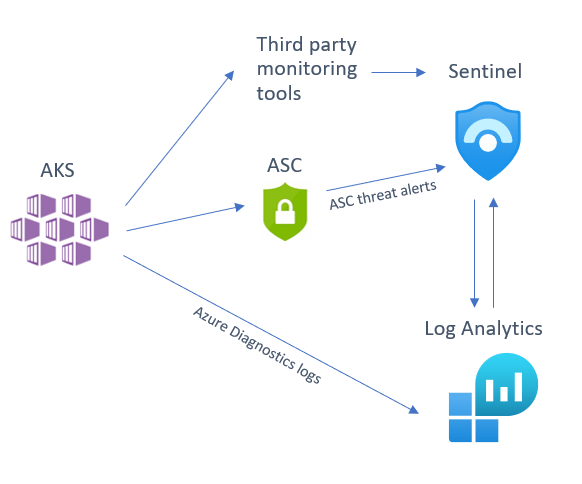
There are several sources that you can use to help monitor your AKS cluster, of which you can deploy one or several in tandem depending on your environment and the security posture of your organization. We will be looking at the following detection sources that you can integrate into Sentinel:
- Azure Security Center (ASC) AKS threat protection
- Azure Diagnostics logs
- Third party tool alert integration
Below is a diagram illustrating how these different sources integrate into Azure Sentinel:

Before we dive into each of these sources, I want to mention an excellent piece of work created by my colleague Yossi Weizman where he created a threat matrix for Kubernetes clusters, aligned to the MITRE ATT&CK framework. You can read his full article here but we will refer to this threat matrix when assessing whether you have considered if this scenario is applicable to your AKS implementation, and if it is, how you can get visibility of this happening in your environment.

Azure Security Center (ASC) AKS threat protection
Azure Security Center Standard has threat protection built-in for the resources that it monitors. ASC has an optional Kubernetes bundle that you can enable, and ASC threat protection will look at your AKS cluster for signs of suspicious activity. To enable the AKS bundle in ASC, go to “Pricing & settings”, select the subscription and make sure the “Kubernetes” resource type is enabled, as per the below:

(The ASC Kubernetes bundle also provides security configuration and hardening recommendations for your AKS cluster, but that is outside the scope of this blog post. You can read more about this here.)
If you have already connected ASC threat alerts to your Azure Sentinel workspace via the native ASC connector these AKS threat alerts will also be sent directly into Azure Sentinel. Some of the threats that ASC can detect in your AKS cluster are below:
- Container with a sensitive volume mount detected
- Digital currency mining container detected
- Exposed Kubernetes dashboard detected
For an up-to-date list of ASC AKS-specific detections, please go here.
To turn on Kubernetes in Azure Security Center, go to ASC Pricing & Settings, in the Select pricing tier by resource type, you need to Enable Kubernetes and Container Registries.
Azure Diagnostics logs
If you have use cases not covered by ASC threat detections, you can also turn on AKS diagnostic logs and send to a Log Analytics workspace (you may notice that some documents referenced here refer to Azure Monitor. Note that Log Analytics is part of the larger Azure Monitor platform.) Follow the steps found here to enable resource logging. The logs that can be retrieved from AKS in this manner include:
- kube-apiserver
- kube-controller-manager
- kube-scheduler
- kube-audit
- cluster-autoscaler
After you have enabled the logging to be sent your Log Analytics workspace, you can start to run detections on these logs. These logs will be sent to the AzureDiagnostics table.
Let’s look at a basic query you can on these logs in Sentinel to look at (in this case) an NGINX pod:
AzureDiagnostics
| where Category == "kube-apiserver"
| where log_s contains "pods/nginx"
| project log_s
Now let’s look at some more security-focused queries that you can run on AKS logs. Note that we are using the threat matrix mentioned earlier in this blog as a guide for the manner of detections one may require on an AKS cluster:
# query for cluster-admin clusterrolebinding + extend columns
# detects: kubectl create clusterrolebinding my-svc-acct-admin --clusterrole=cluster-admin --serviceaccount=brianredmond

AzureDiagnostics
| where Category == "kube-audit"
| where parse_json(log_s).verb == "create"
| where parse_json(tostring(parse_json(tostring(parse_json(log_s).requestObject)).roleRef)).name == "cluster-admin"
| where parse_json(tostring(parse_json(log_s).requestObject)).kind == "ClusterRoleBinding"
| extend k8skind = parse_json(tostring(parse_json(log_s).requestObject)).kind
| extend k8sroleref = parse_json(tostring(parse_json(tostring(parse_json(log_s).requestObject)).roleRef)).name
| extend k8suser = parse_json(tostring(parse_json(log_s).user)).username
| extend k8sipaddress = parse_json(tostring(parse_json(log_s).sourceIPs))[0]
# query for CronJob creation

AzureDiagnostics
| where Category == "kube-audit"
| where parse_json(log_s).verb == "create"
| where parse_json(tostring(parse_json(log_s).requestObject)).kind == "CronJob"
# query for actions from standard user account (az aks get-credentials)

AzureDiagnostics
| where Category == "kube-audit"
| project log_s
| where parse_json(tostring(parse_json(log_s).user)).username == "masterclient"
# query for specific source IP

AzureDiagnostics
| where Category == "kube-audit"
| project log_s
| where parse_json(tostring(parse_json(log_s).sourceIPs))[0] == "192.168.1.1"
# query for RBAC result (allow, deny, etc.)

AzureDiagnostics
| where Category == "kube-audit"
| project log_s
| where parse_json(log_s).verb == "create"
| where parse_json(tostring(parse_json(log_s).annotations)).["authorization.k8s.io/decision"] == "allow"
# query for Azure RBAC AKS role assignment

AzureActivity
| where OperationName == "Create role assignment"
| extend RoleDef = tostring(parse_json(tostring(parse_json(tostring(parse_json(Properties).requestbody)).Properties)).RoleDefinitionId)
| extend  Caller = tostring(parse_json(tostring(parse_json(tostring(parse_json(Properties).requestbody)).Properties)).Caller)
| where RoleDef contains "8e3af657-a8ff-443c-a75c-2fe8c4bcb635" or RoleDef contains "b24988ac-6180-42a0-ab88-20f7382dd24c"
| extend AccountCustomEntity = Caller
| extend IPCustomEntity = CallerIpAddress
| extend URLCustomEntity = HTTPRequest
| extend HostCustomEntity = ResourceId
Of course, this is just a start – there are many more AKS detections you could create with these logs that will be specific to your organization’s use cases and environment.
Third party tools
If you are using a third-party Kubernetes monitoring tool, this can also be integrated into Sentinel. At the time of writing, we already have a native connector for Alcide kAudit, but look for more native integrations to come in the future!
Remember, if you are using a third party tool that does not yet have a native connector in Sentinel, you can still integrate the logs using a custom connector. For example, Twistlock offers a number of ways to pull the audit events from the product itself.
Summary
Sentinel offers many options for monitoring AKS clusters, so we recommend that you look at your organization’s environment and the tools you have available to decide on a strategy that works best for you. Do you have some AKS-specific detections, Workbooks or something else to share? Please contribute to our GitHub repo here and share with the community!
With thanks to @GeorgeWilburn for his AKS queries and @Nicholas DiCola (SECURITY JEDI) and @Chi Nguyen for their comments and feedback on this article.

Recent Comments