by Scott Muniz | Aug 24, 2020 | Uncategorized
This article is contributed. See the original author and article here.
Hi Everyone!
My Name is Fabian Scherer, Customer Engineer (CE – formally PFE) at Microsoft Germany for Microsoft Endpoint Manager related topics.
Challenge
During the daily challenges at Customer Environments one thing was coming to my mind on every Engagement. No one trusts the monitoring status of their Console.

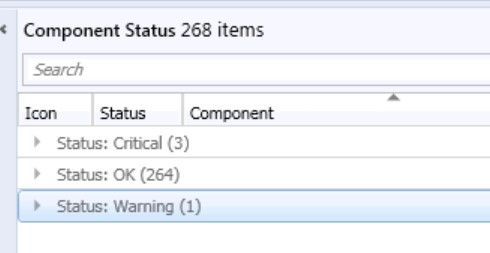
This is a familiar look in the morning at every Infrastructure I have seen during the past years. During the day, the counts are shifting a little bit but at midnight during the Status Summarizer Reset everything will go back to green and on the next day everything repeats. The most Customers are monitoring the Systems and will be notified if there is a bigger Issue with one of the Servers. But that’s an reactive Solution.
If you ask anyone about the status, the answers are always the same:
- We can’t trust this status
- If there is a big issue, we will get a Notification
- Our Infrastructure is too big
But if you want to get from the reactive to the proactive side it’s necessary to edit the Thresholds of the Stats in your Environment and to change the handling of the Supporters to a new level.
In this Blog I want to show you the journey we have taken to get to this point.
Preparation
After the decision to change the whole process the biggest and most annoying part of the project starts, the Preparation Phase. During this phase you must start to collect all the relevant data for your own infrastructure. This includes:
- Technical Understanding
- Listing Classification of your Components
- Thresholds during the past two weeks
- Status Messages which can be ignored
Technical Understanding
First, it is important to understand how the Threshold Topic works. You got all the Components at your Infrastructure and defined Thresholds like this:

(located at Administration > Site Configuration > Status Summarizers à Component Status Summarizer)
This means that the Component SMS_AD_SECURITY_GROUP_DISCOVERY needs 2,000 Messages of the Type Information to get to the Status Warning and 5,000 to get at the Critical state.

It also needs 10 Warning Messages to change to Warning and 50 Warnings to change to Critical state.

In Addition, it needs 1 Error Message to Change at the Warning State and 5 Error Messages to change to the Critical state.
This Defaults will make sense for some Components, but every Environment is different and needs separate Thresholds. Even at a Hierarchy you can’t compare Site A to Site B if there is a different count on Clients and Distribution Points.
One thing should also be clear – there is an separate Component named SMS_COMPONENT_STATUS_SUMMARIZER which detects if the Threshold of one Component is reached and switch it to the defined Status.
Listing Classification of your Components
So, let’s start on the top and list all Components in an Excel List.

After that you should also add the Systems where every of these Components is installed. When finally all Components are listed and linked to the Site Systems, you should start to tag the components with different Categories like this:
- Not installed
- Components which are not installed and shouldn’t be watched
- Not Relevant
- Components which are installed but currently not in Use
- Basic
- Components which are used by the Departments but just must be watched during Error and Warnings
- Important
- Components which are important for the Departments and there should be an investigation if something isn’t working in regular ways
- Critical
- Components which shows Critical Workflows and should be investigated as soon as something is strange

Thresholds during the past two weeks
As mentioned before the Count of Messages is relevant. So, you should start studying the Counts of Information, Warning and Error Messages for each Component during at least the past two weeks and wrote them down.

Some other Environment Issues like ‘Managements Points with a lower workload’ or ‘Distribution Points where the Site Server was unable to read the Registry’ got lighted out. This could be addressed during the Preparation Phase and were shown as good Quick Wins.
After you listed all the Message Counts you will be able to get an view all over the Weeks and to define how much Errors on some Components are ‘Normal’ and where too many Information Messages may can be Critical for the Environment.
Status Messages which can be ignored
On my Investigation, I found some Messages without any Sense for this Environment and Excluded them to minimize the Messages. For Example:
Message ID 9520 on SMS_DISTRIBUTION_MANAGER informs you that a Distribution will not take place because the Distribution Point is set on Maintenance Mode.
There are more Messages that could be not relevant for your own Environment, but you must detect and decide it by yourself.
Definition
After collecting all this Data it’s time to define new Thresholds for each Component on each Site. As first Key Factor you should choose the defined Category:
|
Category
|
Information to Warning
|
Information to Critical
|
Warning to Warning
|
Warning to Critical
|
Critical to Warning
|
Critical to Critical
|
|
Not Installed
|
–
|
–
|
–
|
–
|
–
|
–
|
|
Not Relevant
|
–
|
–
|
–
|
–
|
–
|
–
|
|
Basic
|
Unlimited
|
Unlimited
|
Individual Defined
|
Individual Defined
|
1
|
2
|
|
Important
|
Double the Daily average Plus 2
|
Triple the Daily average Plus 2
|
1
|
2
|
1
|
2
|
|
Critical
|
Daily Average Plus 2
|
Double the Daily Average Plus 2
|
1
|
2
|
1
|
2
|
(Note: The Information that the Component has been switched will also add one Message to your count.)
Examples:
- SMS_SITE_BACKUP | CAS | Critical | IW 12, IC 25, WW 1, WC 2, CW 1 CC 2
This Component on the CAS is writing 11 Information Messages per Day the whole Time I was spectating. If it’s writing more than 11 Messages, it’s important for me to see what’s different and if there is something we need to Investigate.
- SMS_SITE_SQL_BACKUP_% | SQL CAS | Critical | IW 5, IC 11, WW 1, WC 2, CW 2 CC 3
This Component on the SQL System related to the CAS is writing 4 Messages per Day the whole Time I was spectating. It also wrote 1 Error Message every Night. This was during the SMS_SITE_BACKUP and after one hour everything was fine. So, I accept the 1 Error Message per Night and let this Component switch after the Second Error Message.
Recommendation:
Discuss this step with all Units which are involved at your daily Business. They can show you some aspects you may not notice.
Implementation
After the Definition, the technically Part comes up. As mentioned before the Thresholds are defined at the GUI:
Administration > Site Configuration > Status Summarizers > Component Status Summarizer
But you can also list it using WMI:
WQL:
rootSMSSite_Sitecode
Select * from SMS_SCI_Component where ItemName like '%sms_component_Status_summarizer%'

Powershell:
$SiteCode = "<SiteCode>"

$ComputerName = "<FQDN>"

$QueryString =  "Select * from SMS_SCI_Component where ItemName like '%sms_component_status_summarizer%' and SiteCode='$SiteCode'"

$WMIObjects = Get-WmiObject -Namespace "rootsmssite_$SiteCode" -Query $QueryString -Impersonation 3 -ComputerName $Computername

$PropList = $WMIObjects.PropLists

$Property = $PropList | where {$_.PropertyListName -eq "Component Thresholds"}

$Values = $Property.Values

And also by using SQL:
select * from SC_Component_PropertyList where Name = 'Component Thresholds' and SiteNumber = '<SiteNumber>'

The SiteNumber can be detected by watching the SiteControlFile:
select * from vSMS_SC_SiteControlXML
The most uncomplicated (but also the longest way) to update the Thresholds is using the Console but it’s a pity to update all Files using the GUI:
4 Site Systems * 6 Entries * 70 Components would be 1.680 entries that must be manually edited.
The smartest way is using SQL. But be careful – The command must be exactly been executed. If you forget to define the Name your Environment will be crashed. So please perform a Backup before you try to edit the Thresholds and use the whole Command. I copied the Values of the .xml File at the SQL query and edited the defined thresholds.
Index:
IW = Information Messages to get The Warning State
IE = Information Messages to get the Critical State
WW = Warning Messages to get the Warning State
WE = Warning Messages to get the Critical State
EW = Error Messages to get the Warning State
EE = Error Message to get the Critical State
!YOU WILL HAVE TO UPDATE THE WHOLE XML FILE, NOT JUST THE ENTRIES YOU WANT TO EDIT!
If you choose this way you can use the following Query:
update SC_Component_PropertyList SET Value = '<The whole XML File>' where Name = 'Component Thresholds' AND SiteNumber = '<SiteNumber>'
It is possible that the defined Thresholds will be overwritten with the Default during an SCCM CB Update. So please check the Settings after every Update. You should also be aware of new Components releases with any Version.

Additional Words
This Adjustment is not the End of the Process – it’s the Start. After you have done the first part you can choose the possibilities and develop it to a new level. Some Thresholds will have to be edited later. You should implement a Documentation to get rid of recurrently appearing Issues and you can define Rules, E-Mail Messages or Actions that should be performed after special Events appear. It’s just the first step out of the reactive Support moving to a Proactive Service and an Improvement of your Service Quality.
Fabian Scherer
CE
Disclaimer
The sample scripts are not supported under any Microsoft standard support program or service. The sample scripts are provided AS IS without warranty of any kind. Microsoft further disclaims all implied warranties including, without limitation, any implied warranties of merchantability or of fitness for a particular purpose. The entire risk arising out of the use or performance of the sample scripts and documentation remains with you. In no event shall Microsoft, its authors, or anyone else involved in the creation, production, or delivery of the scripts be liable for any damages whatsoever (including, without limitation, damages for loss of business profits, business interruption, loss of business information, or other pecuniary loss) arising out of the use of or inability to use the sample scripts or documentation, even if Microsoft has been advised of the possibility of such damages.
by Scott Muniz | Aug 24, 2020 | Uncategorized
This article is contributed. See the original author and article here.
HDInsight 4.0 brings upgraded versions for all Apache components , but for this lab we specifically focus on the Hive versions.
| Component |
HDInsight 4.0 |
HDInsight 3.6 |
| Hive |
3.1.0 |
2.1.0 ; 1.2.1 |
Some key areas that Hive 3.x differs from earlier versions are.
Client
- Hive CLI support is deprecated in Hive 3.x and only the thin client Beeline is supported
Transaction Processing
- ACID tables are the default table type in Hive 3.x with performance as good as non Acid
- Automatic query cache
Catalogs
- Spark and Hive use independent catalogues for Spark SQL or Hive tables in same or independent clusters
- The Hive Warehouse connector is used to integrate between Spark and Hive workloads.
For an exhaustive overview of advancements in Hive 3.0 , listen to this presentation.
Lab
This lab is a simulation of a real migration and will consist of the following steps in sequence.
- Create an HDInsight Hadoop 3.6 cluster.
- Create test data in the HDInsight 3.6 cluster. We use TPCDS data here.
- Run TPCDS tests to simulate Hive workloads.
- Copy the Hive 2.1 Metastore and upgrade the Metastore copy to 3.1.
- Delete the older HDInsight Hadoop 3.6 cluster.
- Create a new HDInsight 4.0 cluster with the older storage account and new upgraded 3.1 Hive Metastore.
Run the same TPCDS tests to ensure everything is working as intended.
Create a Storage account
1. Create storage account and click create
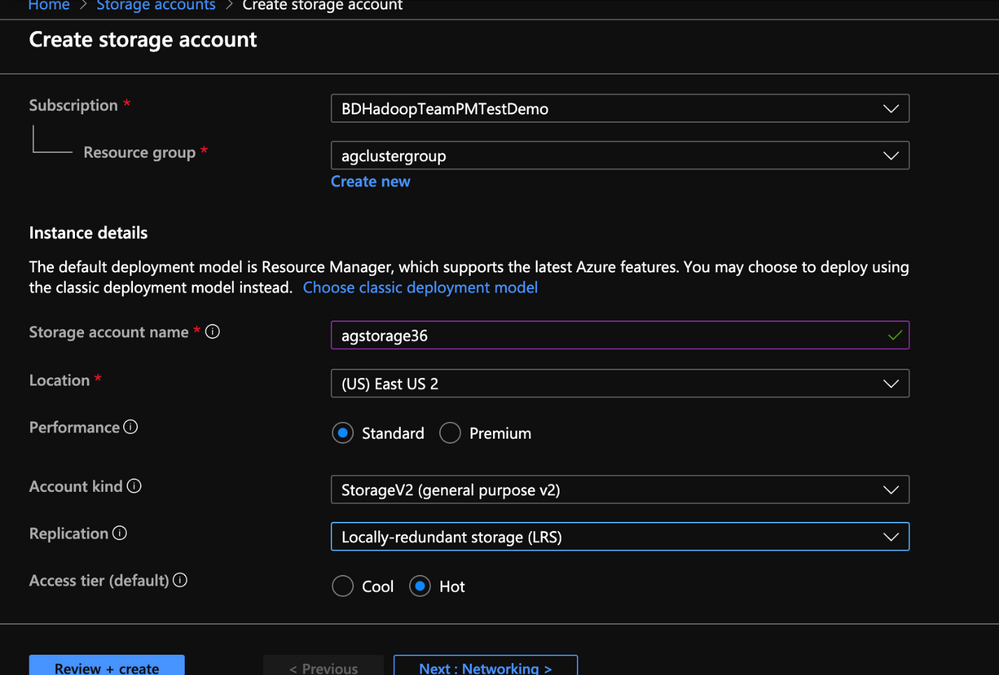
2. Populate the Basics tab of Storage account with the below information.
- Resource group: Create or use an existing resource group
- Storage account name: Enter a unique name for your storage account( I used agstorage36 to represent an older cluster )
- Location: Enter an Azure region( HDInsight cluster needs to be created in same the Azure region)
- Performance: Standard
- Account Kind: StorageV2(general purpose v2)
- Replication: Locally-redundant storage(LRS)
- Access Tier: Hot

3. Populate the Advanced tab of Storage account with the below information.
- Security(Secure transfer required): Enabled
- Virtual Network(Allow access from): All networks
- Data Protection(Blob soft delete:( Disabled
- Data Lake Storage Gen2(Hierarchical Namespace): Disabled
< Insert Image >
4. Make no changes to the Tags Tab and post validation click Create on the Review + Create tab to create an Azure Blob storage account.

5. In the next section we would create the external metastore for the HDInsight Hadoop 3.6 cluster.
Create an External Metastore for the HDInsight Hadoop 3.6 cluster
1. On the Azure Portal Navigate to the SQL Database blade and click create

2. Populate the Basics tab of SQL Server with the below information.


3. Compute+Storage : Click on the Configure Database link to Navigate to the database configuration page

4. In the Database Configuration page select the Standard Tier with the below settings and click Apply
- DTU: 200
- Data Max Size : A few GBs

5. In the Networking tab ensure the following settings are met
- Connectivity Method : Public endpoint
- Firewall Rules:
- Allow Azure Services and Resources to Access this Server : Yes
- Add current IP address: Yes

6.Leave the Additional settings and Tags to their default state
7. In the Review+Create tab click Create

8. In this section we created an External Hive Metastore(aghive36db) which we will use subsequently in an HDInsight 3.6 cluster.

Provision HDInsight Hadoop 3.6(Hive 2.1.0) cluster from Azure Management Portal
To provision HDInsight LLAP with Azure Management Portal, perform the below steps.
-
Go to the Azure Portal portal.azure.com. Login using your azure account credentials.
-
Select Create a resource -> Azure HDInsight -> Create
-
Click the Custom(size ,settings, apps) slider

2. In the Basics tab populate the following values.
- Resource Group:Put the cluster in the same resource group as the Storage account and Metastore
- Cluster Name: Enter the cluster name. A green tick will appear if the cluster name is available.
- Region: Choose the same region as the storage account
- Cluster Type : Cluster Type – Hadoop
- Version: Hadoop 2.7.3 (HDI 3.6)

- Cluster login username:Enter username for cluster administrator(default:admin)
- Cluster login password:Enter password for cluster login(admin)
- Confirm Cluster login password:Repeat the same password as used earlier
- Secure Shell(SSH) username:_Enter the SSH username for the cluster(default:sshuser)
- Use cluster login for SSH: Check this box(this makes your SSH password same as the cluster admin password)

5. In the Storage tab populate the following values.
- Primary Storage Type: Azure Storage
- Selection method: Select from list
- Primary Storage account: Select the Azure storage blob account created earlier.
- Container: Enter a name for the storage container

6. Metastore Settings: Enter the name for the SQL Database/SQL Server combination that was created in the last step


7. Click Authenticate to enter the username and password for the Metastore. Enter the username and password that was set for the SQL Server in the last exercise.

8. In the Configuration+Pricing tab select the node sizes for the cluster. There are no hard and fast rules and the recommendation is to select larger nodes for faster data processing. Note that choosing nodes that are too small may result in failures.

9. In the Review+Create tab , review the cluster specifics and click Create.

10. In this step we created an HDInsight 3.6 Hadoop cluster with preconfigured external metastore and storage account.

11. In the next step we will create some test data in the cluster to represent a production workload.
Create TPCDS test data on the HDInsight 3.6 Hadoop cluster with Beeline CLI
Goal of this step is to help generate TPCDS data with hive as a close representation of production data.
- Clone this repo
git clone https://github.com/hdinsight/tpcds-hdinsight && cd tpcds-hdinsight
- Upload the resources to DFS
hdfs dfs -copyFromLocal resources /tmp
- Run TPCDSDataGen.hql with settings.hql file and set the required config variables.( 1 GB of data)
beeline -u "jdbc:hive2://`hostname -f`:10001/;transportMode=http" -n "" -p "" -i settings.hql -f TPCDSDataGen.hql -hiveconf SCALE=1 -hiveconf PARTS=1 -hiveconf LOCATION=/HiveTPCDS/ -hiveconf TPCHBIN=`grep -A 1 "fs.defaultFS" /etc/hadoop/conf/core-site.xml | grep -o "wasb[^<]*"`/tmp/resources
SCALE is a scale factor for TPCDS. Scale factor 10 roughly generates 10 GB data, Scale factor 1000 generates 1 TB of data and so on.
PARTS is a number of task to use for datagen (parrellelization). This should be set to the same value as SCALE.
LOCATION is the directory where the data will be stored on HDFS.
TPCHBIN is where the resources are found. You can specify specific settings in settings.hql file.
- Create tables on the generated data.
beeline -u "jdbc:hive2://`hostname -f`:10001/;transportMode=http" -n "" -p "" -i settings.hql -f ddl/createAllExternalTables.hql -hiveconf LOCATION=/HiveTPCDS/ -hiveconf DBNAME=tpcds
- Generate ORC tables and analyze
beeline -u "jdbc:hive2://`hostname -f`:10001/;transportMode=http" -n "" -p "" -i settings.hql -f ddl/createAllORCTables.hql -hiveconf ORCDBNAME=tpcds_orc -hiveconf SOURCE=tpcds
beeline -u "jdbc:hive2://`hostname -f`:10001/;transportMode=http" -n "" -p "" -i settings.hql -f ddl/analyze.hql -hiveconf ORCDBNAME=tpcds_orc
- Run a few queries to represent a production workload. Change the query number in the end to test various queries.
beeline -u "jdbc:hive2://`hostname -f`:10001/tpcds_orc;transportMode=http" -n "" -p "" -i settings.hql -f queries/query12.sql
-
In this section we have created test data on the cluster and then tested a few queries representative of production datasets.
-
In the next section we would upgrade the Hive Metastore from 2.1.1. to 3.1.
Upgrade the Hive Metastore from Hive 2.1.1 to Hive 3.1
Create a copy of the Hive Metastore in HDInsight 3.6
- From the HDInsight 3.6 cluster click on the External Metastores.

2. Click on the Metastore to open the SQL DB portal.

3. On the SQL DB portal click on Restore.

- In the restore blade choose the below values to get the most recent copy of the Hive Metastore
- Select Source : Point-in-time
- Database name: Assign a new db name*( I chose the name aghive40db)
- Restore Point:
- Date: Current date
- Time: Current time
- Target Server: Choose SQL server create earlier
- Elastic Pool: None
- Pricing Tier: Same tier as older metastore db
Click OK to continue with creation of a copy

5. After creation, the new SQL db(aghive40db) appears as an additional database in the same SQL Server.


Upgrade the Hive 2.1.1 Metastore
- On the HDInsight cluster click on Script Actions.

2. On the Script action page populated the parameters as described below and click Create

3. The script action starts on the cluster

4. The script comes back with a green check mark which indicates successful completion.

Validate the Hive Metastore version
After the script finishes , we would need to validate if the Hive Metastore is indeed upgraded
- Launch the new SQL db portal(aghive40db) and click on Query Editor.You could alternatively use SSMS or Azure Data Studio.

-
Enter the below query in the query editor and click Run. Select * from [dbo].version
-
Validate to see the if the schema version was upgraded to 3.1.0 . This would indicate that the Hive metastore was succesfully upgraded.

4. Post up-gradation , delete the older HDInsight 3.6 cluster.


-
In this section we upgraded the new Hive Metastore aghive40db from version 2.1.2 to 3.1.0 post which we deleted the older HDInsight cluster.
-
In the next section , we would create a new HDInsight 4.0( Hive 3.1) cluster with the new Hive Metastore and the older storage account.
Provision HDInsight Hadoop 4.0(Hive 3.1.0) cluster from Azure Management Portal
To provision HDInsight LLAP with Azure Management Portal, perform the below steps.
-
Go to the Azure Portal portal.azure.com. Login using your azure account credentials.
-
Select Create a resource -> Azure HDInsight -> Create
-
Click the Custom(size ,settings, apps) slider
-
In the Basics tab populate the following values.
- Resource Group:Put the cluster in the same resource group as the Storage account and Metastore
- Cluster Name: Enter the cluster name. A green tick will appear if the cluster name is available.
- Region: Choose the same region as the storage account
- Cluster Type : Cluster Type – Hadoop
- Version: Hadoop 3.1.0(HDI 4.0)

- Cluster login username:Enter username for cluster administrator(default:admin)
- Cluster login password:Enter password for cluster login(admin)
- Confirm Cluster login password:Repeat the same password as used earlier
- Secure Shell(SSH) username:_Enter the SSH username for the cluster(default:sshuser)
- Use cluster login for SSH: Check this box(this makes your SSH password same as the cluster admin password)

- In the Storage tab populate the following values.
- Primary Storage Type: Azure Storage
- Selection method: Select from list
- Primary Storage account: Select the Azure storage blob account created earlier.
- Container: Enter the same storage container that was used for the previous HDInsight 3.6 cluster

- Metastore Settings: Enter the name for the new SQL Database/SQL Server(agclusterdbserver/aghive40db) combination that was upgraded in the last step

6. Click Authenticate to enter the username and password for the Metastore. Enter the username and password that was set for the SQL Server.

7. In the Configuration+Pricing tab select the node sizes for the cluster. There are no hard and fast rules and the recommendation is to select larger nodes for faster data processing. Note that choosing nodes that are too small may result in failures.

8. In the Review+Create tab , review the cluster specifics and click Create.

-
In this step we created an HDInsight 4.0 Hadoop cluster with preconfigured upgraded external metastore and mapped its storage to a preexisting storage container.
-
In the next step we will create some test data in the cluster to represent a production workload.
Run TPCDS test data on the HDInsight 4.0 Hadoop cluster with Beeline CLI
Goal of this step is to run TPCDS tests with an upgraded Hive Metastore to represent regression tests of Hive workloads.
-
The TPCDS repo should already be cloned and TPCDS data should already exist from what we created earlier.
-
SSH into the cluster using the ssh credentials provided durinng cluster creation.
-
Run a few TPCDS queries to represent a production regression test . Change the query number in the end to test various queries.
beeline -u "jdbc:hive2://`hostname -f`:10001/tpcds_orc;transportMode=http" -n "" -p "" -i settings.hql -f queries/query12.sql
- In this lab we migrated multiple HDInsight 3.6 Hive workloads to HDInsight 4.0.
Further reference:
by Scott Muniz | Aug 24, 2020 | Uncategorized
This article is contributed. See the original author and article here.
A few days ago I was discussing with a customer about backup and restore on the SQL DW so I made this lab: https://techcommunity.microsoft.com/t5/azure-synapse-analytics/lab-how-to-restore-a-deleted-database-on-azure-sql-dw/ba-p/1589360
After some discussion, another doubt was raised about how to schedule a user restore point. Remember SQL DW will create 42 restore points and the user can additionally create more 42 restore points. Basically it is a point in time restore.
Between some possibilities, one of them is to use the run book to schedule a power shell restore point.
Public doc: https://docs.microsoft.com/en-us/azure/automation/start-runbooks#:~:text=%20Start%20a%20runbook%20with%20the%20Azure%20portal,the%20status%20of%20the%20runbook%20job.%20More%20
Here it goes…Step by Step:
Let’s start with the Run Book.
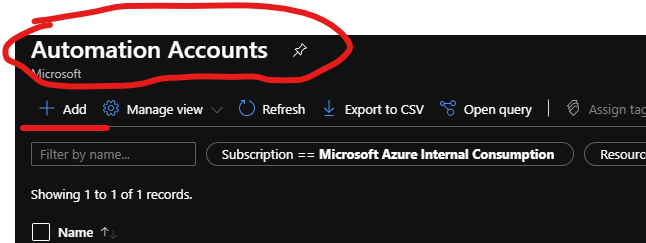
- Create an automation account by searching on the azure portal
- Add a new account – Fig 1:

Fig 1 New Account
- Runbooks -> Create a runbook – Fig 2

Fig 2 Create a Run book
3. Our runbook will use power shell code as this is pretty much the example available on the public doc. Fig 3

Fig 3 Power Shell
4. Here is the power shell script for a customer restore point: https://docs.microsoft.com/en-us/azure/synapse-analytics/sql-data-warehouse/sql-data-warehouse-restore-points
$SubscriptionName="<YourSubscriptionName>"

$ResourceGroupName="<YourResourceGroupName>"

$ServerName="<YourServerNameWithoutURLSuffixSeeNote>"  # Without database.windows.net

$DatabaseName="<YourDatabaseName>"

$Label = "<YourRestorePointLabel>"


Connect-AzAccount

Get-AzSubscription

Select-AzSubscription -SubscriptionName $SubscriptionName


# Create a restore point of the original database

New-AzSqlDatabaseRestorePoint -ResourceGroupName $ResourceGroupName -ServerName $ServerName -DatabaseName $DatabaseName -RestorePointLabel $Label
5. Once you fill the gaps, open power shell and test the script
6. You can check the script’s result on the SSMS by running the following:
select * from sys.pdw_loader_backup_runs
You can confirm it worked by checking the label that you defined for the restore point on the power shell script. My label was portal_test – Fig 4:

Fig 4 check label
6. If everything is working as it should. Proceed in creating the Job, in other words, back to run book:
Here the public doc for runbooks:https://docs.microsoft.com/en-us/azure/automation/learn/automation-tutorial-runbook-graphical
$SubscriptionName="Name of your Subscription"
$ResourceGroupName="Name of your resource group"
$ServerName="Your Server Name "   # Without database.windows.net
$DatabaseName="Your Database Name"
$Label = "Any label you want - I defined as test as I do not have imagination"

	# Ensures you do not inherit an AzContext in your runbook
	Disable-AzContextAutosave –Scope Process

	$Conn = Get-AutomationConnection -Name AzureRunAsConnection
	Connect-AzAccount -ServicePrincipal -Tenant $Conn.TenantID -ApplicationId $Conn.ApplicationID -CertificateThumbprint $Conn.CertificateThumbprint

	New-AzSqlDatabaseRestorePoint -ResourceGroupName $ResourceGroupName -ServerName $ServerName -DatabaseName $DatabaseName -RestorePointLabel $Label
Note: If by any chance when you tried to use the notebook you experience the same errors as follows ( I did):
Error: The term ‘Connect-AzAccount’ is not recognized as the name of a cmdlet, function, script file, or operable program. Check the spelling of the name, or if the path was included verify that the path is correct and try again.
This has been documented on the troubleshooting public doc:
https://docs.microsoft.com/en-us/azure/automation/troubleshoot/runbooks
The script to update the cmdlet is on the GitHub – run it on the runbook:
https://raw.githubusercontent.com/microsoft/AzureAutomation-Account-Modules-Update/master/Update-AutomationAzureModulesForAccount.ps1
I Needed the Az Modules. Therefore, I created a runbook to run the GitHub script.
Note: [string] $AzureModuleClass = ‘Az’,
[Diagnostics.CodeAnalysis.SuppressMessageAttribute("PSUseApprovedVerbs", "")]
param(
    [Parameter(Mandatory = $true)]
    [string] $ResourceGroupName,

[Parameter(Mandatory = $true)]
    [string] $AutomationAccountName,

[int] $SimultaneousModuleImportJobCount = 10,

[string] $AzureModuleClass = 'Az',

[string] $AzureEnvironment = 'AzureCloud',

[bool] $Login = $true,

    [string] $ModuleVersionOverrides = $null,

    [string] $PsGalleryApiUrl = 'https://www.powershellgallery.com/api/v2'
)
This one was importing the AzureRM, but I ran a second time to import the Az as well. Fig 5:

Fig 5 Update the modules
You also can check the modules available on the portal.
Automation accounts->name of your account->Shared Resources ->modules – Fig 6:

Fig 6 Check Modules
7. The next step would be linked to a schedule. This option is on the run book and allows you to add an existing schedule or create a new one. Fig 7

Fig 7 Schedule link
That is it!
Liliam
UK Engineer
by Scott Muniz | Aug 24, 2020 | Uncategorized
This article is contributed. See the original author and article here.
Issue:
With reference to article https://docs.microsoft.com/hi-in/azure/service-fabric/service-fabric-reliable-actors-delete-actors , after Calling the DeleteActorMethod and enumerating the Actor list, the disk space is not getting cleaned up.
What can we analyze from our end:
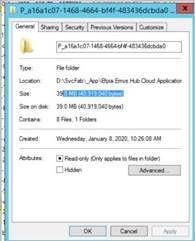
We can check the snapshot of the partition size after RDP into the node. Below is an example of one the Partition folder (E.g.: a16a1c07-1468-4664-bf4f-483436dcbda0) size before Calling DeleteActorMethod:


After Calling DeleteActorMethod: Disk space remains same:

Points to Note:
- Actual usage on disk depends on numerous factors from the underlying store and we don’t see immediate reduction of disk usage right after Actor deletion.
- Deleting data does not shrink the physical size of the DB down; it only shrinks the logical size (the size of the data) of the DB. However, the remaining space is reused when more data is added.
For example, imagine the execution of the following operations:
- Inserting 10GB of data.
- Deleting 7GB of data.
- Inserting 3GB of data.
The physical size of the DB remains to be 10GB after the occurrence of all the above operations. This is because of physical size not going down after the data is deleted as stated above. However, during step 3, the existing available space is reused instead of creating additional physical space.
- If we are interested in bringing the physical size of the db down, we can perform compaction. Shrinking of db file size is not supported proactively as it impacts write latency.
The recommended way is to test on workloads with real data which is having huge size. Disk space is rarely a bottleneck is general workloads.
- For compacting the partitions, we have added settings under LocalEseStoreSettings:
CompactionThresholdInMB = set to the max_data_size that customer expects to add like 5 GB + delta
FreePageSizeThresholdInMB = some threshold for skipping compaction if bloating is less than this size.. e.g. 500 MB
CompactionProbabilityInPercent = 5 or 10 %
These settings will make sure that compaction of partitions happen at appropriate time to reduce bloating of db files.
These can be set in settings.xml under “<ActorName>LocalStoreConfig” like “GameActorServiceLocalStoreConfig”
- Minimum db file size with 0 data is 4 MB. After that as we write data, file size will grow. Deletion information is shared by Hima above. Generally, file space is reused.
- The current compaction steps are deprecated in favor of new automatic compaction feature that we are working on priority and will update the Release Notes when the same is public.
- There may be a question where a node in the cluster fails for some reason and the cluster will automatically reconfigure the service replicas to the available node to maintain availability.
During this scenario, does the disk space reclaims?
The answer is No, because db file gets copied from some other node (which is in UP state) to new node.
For completeness, Replica folder and files get deleted on old node where replica is not needed anymore. New replica/node will get db files from current primary.
by Scott Muniz | Aug 23, 2020 | Uncategorized
This article is contributed. See the original author and article here.
SQL Server Extents, PFS, GAM, SGAM and IAM and related corruptions-2
In previous post, we discussed the PFS, GAM and SGAM pages. Today, I’m going show you two related corruptions on these pages.
SQL Server checks the bit in PFS, GAM, SGAM and IAM are checked when new pages are allocated. It guarantees that it does not store data to a wrong page/extent.
These pages are crucial to SQL Server, SQL Server considers it as a corruption if they are messed up.
I’m going to use the same database I used in previous .
You may restore the backup file and give it a try. Please note, restoring database will consume some pages and change the PFS, GAM, SGAM and IAM. You may get a different view from my mine.
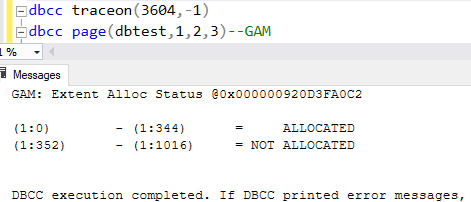
Let me show you some of the content of GAM and SGAM before the corruption samples.
Here are the GAM and SGAM page result:
1.GAM

2.SGAM

3.We can tell that the extent of page(1:352) and extents greater than that have not been allocated.
4.Let’s take a dive into the GAM page.

5.‘00000000 00f0’ interpretation:

5)Pages and extents of heaptable1
select allocated_page_file_id as [FileID],allocated_page_page_id as [PageID],page_type_desc,extent_page_id/8 as ExtentID, is_mixed_page_allocation,extent_page_id as [First Page in Extent],extent_page_id+7 as [LastPage in Extent],is_allocated From sys.dm_db_database_page_allocations(db_id(),object_id(‘dbo.heaptable1′),null,null,’detailed’) order by allocated_page_page_id

You will find all the data in this backup file dbtest20200823.zip.
1.Now let’s discuss the first corruption scenario: error 8903
1)The page 245,246,247,328,329,330,331,332,333 belongs to the table heaptable1.
2)Extent 30 and 41 have these pages.
3)These two extents are marked as allocated in GAM. What happen if the extents are marked as ‘not allocated’?
The answer is : that extent will be consider as corrupted and DBCC Checkdb may report the 8903 error:
Msg 8903, Level 16, State 1, Line 22
Extent (xx:xx) in database ID xx is allocated in both GAM (xx:xx) and SGAM (xx:xx).
4)It usually happens when disks or other hardware run into issue…
5)Here is the result of DBCC PAGE after the GAM page in data file is messed up:

6)’00000000 00f2’ interpretation.

7)DBCC PAGE of GAM with parameter 3.

8)Here is the result of DBCC CHECKDB:

9)Why (1:312) is marked as corruption?
Because I messed up the ’00000000 00f0ffff’: I replaced it with ‘00000000 00f2ffff‘.
The extent(1:328) is actually allocated, but ‘00000000 00f2ffff‘ conflicts the fact.
Takeaway: When SQL Server set a bit of extent to 0 in GAM to allocate an extent, it also set the bits in other allocation pages, like SGAM, IAM etc, that’s the normal behavior.
If the bits in these allocation pages conflict each other, SQL Server considers it’s corruption scenario.
Question: is the command ‘dbcc checkdb(dbtest,repair_rebuild)’ able to fix the issue? Why?
Please download the dbtest20200823_error8903.zip and give it a try.
2.Now let’s discuss the second corruption scenario: error 8905
1).The extent id of page(1:352) is 44, it’s not allocated yet. What if the extent 44(or the extent after 44) is marked as allocated only in GAM?
The answer is : that extent will be consider as corrupted and DBCC Checkdb may report the 8905 error:
Msg 8905, Level 16, State 1, Line 13
Extent (xxx:xxx) in database ID xx is marked allocated in the GAM, but no SGAM or IAM has allocated it.
2)It usually happens when disks or other hardware run into issue…
3)Here is the result of DBCC PAGE after the GAM page in data file is messed up:

4)’00000000 00f0ffff fe’ interpretation.

5)DBCC PAGE of GAM with parameter 3.

6)Here is the result of DBCC CHECKDB:

7)Why (1:512) is marked as corruption?
Because I messed up the ’00000000 00f0ffff ff’: I replaced it with ‘00000000 00f0ffff fe’.
Takeaway: When SQL Server set a bit of extent to 0 in GAM to allocate an extent, it also sets the bits in other allocation pages, like SGAM, IAM etc, that’s the normal behavior.
If the bit is only set in GAM, but not in SGAM or IAM, then there is erroneous info in the allocation pages, it’s a corruption! SQL Server detects it and raise an error.
Question: Is the command ‘dbcc checkdb(dbtest,repair_rebuild)’ able to fix the issue? Why?
Please download the dbtest20200823_error8905.bak and give it a try.
by Scott Muniz | Aug 23, 2020 | Uncategorized
This article is contributed. See the original author and article here.
When opening SSIS package, SSDT loads the package, validates it and shows you the validation results by default. To accelerate the opening of SSIS package, we enable you to skip package validation when opening the package and validate it when you want to, since SQL Server Integration Services Projects version 3.9 and SSDT for VS2017 15.9.6.
This tutorial walks you through the process on how to accelerate the opening of SSIS package by skipping package validation.
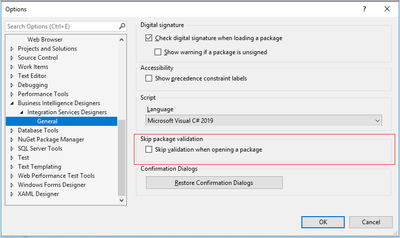
Switch “Skip validation when opening a package” on/off
To switch “Skip validation when opening a package” on/off, select the “Tools -> Options” item on SSDT menu and check/uncheck the “Business Intelligence Designers -> Integration Services Designers –> General -> Skip validation when opening a package” checkbox on “Options” window.
When the checkbox is checked, package validation will be skipped when opening the package. When the checkbox is unchecked, package will be validated when opened. By default, the checkbox is unchecked.

SSDT monitors SSIS package opening time and hint you to switch “Skip validation when opening a package” on
SSDT monitors the time of opening SSIS package. If the time is too long, SSDT will pop up a dialog below to hint you to switch “Skip Validation when opening a package” on. If you select “Yes”, the checkbox “Skip validation when opening a package” in the window above will be checked and the package validation will be skipped when opening the package. If you check “Do not show this dialog again”, this dialog won’t show up again regardless you select “Yes” or “No”.

Validate package proactively
When “Skip validation when opening a package” is switched on, you can validate the package proactively by right clicking the package design panel and clicking the “Validate” button.


Recent Comments